East to West: Bonds & tariffs hurt developing markets and crude prices

10-Year Treasury yields are consolidating in a triangle below long-term resistance at 3.00 percent. Breakout above 3.00 would signal a primary advance, ending the decades-long bull market in bonds. This would have a heavy impact on developing economies, including China, with a stronger Dollar forcing higher interest rates.

10-year Treasury Yields

A Trend Index trough above zero would signal buying pressure and a likely upward breakout.

Crude oil prices, as a consequence of higher interest rates and the threat of trade tariffs, are starting to form a top. Bearish divergence on the Trend Index warns of selling pressure. Breach of support at $65/barrel would signal reversal to a primary down-trend.

Nymex Light Crude

Commodity prices are leading, breach of support at 85.50 already having signaled a primary down-trend.

DJ-UBS Commodity Index

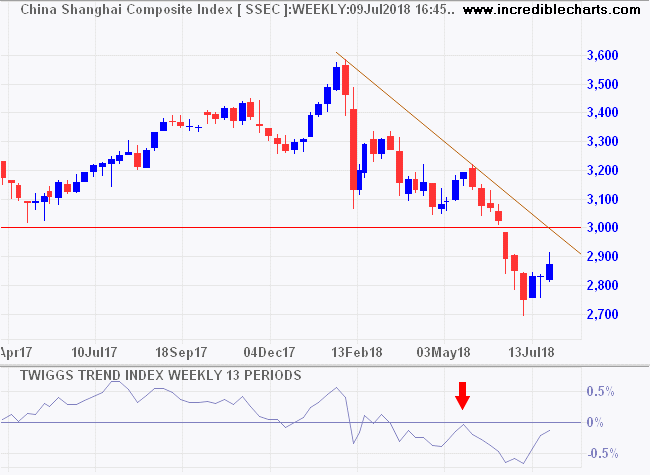
China’s Shanghai Composite Index is in a primary down-trend. Trend Index peaks below zero warn of selling pressure. Breach of support at 2700 is likely. The long-term target is the 2014 low at 2000.

Shanghai Composite Index

Germany’s DAX is headed for a test of primary support at 11,800. Descending peaks on the Trend Index warn of secondary selling pressure. Breach of primary support is uncertain but would offer a target of 10,500.

DAX

The Footsie also shows secondary selling pressure on the Trend Index, warning of a test of primary support at 6900/7000.

FTSE 100

In stark contrast, North American tech stocks have made huge gains in the last four months, but are now retracing to test support. Breach of the rising trendline and support at 7400 would warn of a correction; a test of the long-term rising trendline at 7000 the likely target.

Nasdaq 100

The S&P 500 has also made new highs. Penetration of the rising trendline would warn of a correction to the LT trendline at 2800.

S&P 500

North America leads the global recovery, developing markets including China are falling, while Europe is sandwiched in the middle, with potential loss of trade from East and West if a trade war erupts.

From the AFR today:

President Donald Trump said he’s ready to impose tariffs on an additional $US267 billion in Chinese goods on short notice, on top of a proposed $US200 billion that his administration is putting the final touches on.

“….I will say this: the world trading system is broken.” Trump is “dead serious” in his determination to push China to reform its trade policies, [White House economic adviser Larry Kudlow] added.

Can’t say he didn’t warn us.

East to West in three charts

The S&P 500 is making new highs while a rising Trend Index indicates buying pressure. Target for the advance is 3000.

S&P 500

China’s Shanghai Composite Index is in a primary down-trend. Trend Index peaks below zero warn of selling pressure. Breach of support at 2700 is likely and would offer a long-term target of the 2014 low at 2000.

Shanghai Composite Index

The Footsie broke support at 7600. Follow-through below 7500 warns of a correction to test primary support at 6900/7000.

FTSE 100

North America leads the global recovery, China is falling, while Europe is sandwiched in the middle, with potential loss of trade from East and West if a trade war erupts.

China threatened by loss of US trade

The threat of a US-China trade war has rattled investors, with the Shanghai Composite Index breaking primary support at 2700 to signal another decline. Trend Index peaks below zero warn of strong selling pressure. Long-term target is the 2012 to 2014 lows at 2000.

Shanghai Composite Index

Hong Kong’s Hang Seng Index is also under the pump, breaking support at 28,000 to warn of another decline.

Hang Seng Index

Copper prices, a good barometer of the Chinese economy, are also falling. Breach of $6,000 offers a target of $5,500/tonne.

Copper S1

The Yuan has fallen almost 10 percent, testing support at 14.5 US cents. Failure of the PBOC to support the Yuan (by selling some of their $3 trillion of foreign reserves) may cushion the economic impact in the short-term but only invites further escalation from the Trump administration.

Chinese Yuan/USD

There is no easy way out. Trump clearly has the upper hand in trade negotiations.

Bears in the East, Bulls in the West

Market fears of a trade war appear to be easing but investors in China and South Korea remain cautious.

The Shanghai Composite Index is retracing to test resistance at the former primary support level at 3000.

Shanghai Composite Index

Dow Jones – UBS Commodity Index shows a similar retracement in commodity prices.

DJ-UBS Commodity Index

While crude oil prices have found support at the LT rising trendline.

Nymex Light Crude

South Korea’s Seoul Composite Index is in a primary down-trend but retracement to test the former primary support level at 2350 is likely.

Seoul Composite Index

Japan is more isolated and the Nikkei 225 is testing resistance at 23,000. A rising Trend Index suggests that breakout is likely, which would test the January high at 24,000.

Nikkei 225 Index

India is stronger, with the Nifty breaking resistance at its January high of 11,100 to signal a primary advance with a target of 12,000. But first, expect retracement to test the new support level.

Nifty Index

Europe

Dow Jones Euro Stoxx 600 was boosted by news that the EU-US trade dispute is settled. A Trend Index trough above zero signals strong buying pressure. and another test of 400 is likely.

DJ Euro Stoxx 600 Index

A bullish saucer pattern on the Footsie suggest further gains. The Trend Index trough above zero indicates buying pressure. Breakout of the index above 7800 would signal another advance, with a target of 8200.

FTSE 100 Index

North America

The Nasdaq 100 retreated when Facebook (FB) and Twitter (TWTR) reported disappointing growth for the quarter. Bearish divergence on the Trend Index warns of selling pressure but this appears secondary and support at 7000 is likely to hold. Respect would confirm another advance.

Nasdaq 100

Friday’s retreat is also evident on the S&P 500 daily chart. Expect retracement to test new support at 2800. A strong GDP result should strengthen support.

S&P 500

Canada’s TSX 60 retraced to test the new support level at 970. Respect would signal a test of 1000 but breach is as likely, testing support at 940.

TSX 60 Index

Trade tariff impact on China & Australia

The yuan is falling as threat of a tariff war rises.

Yuan

The Shanghai Composite Index is testing its 2016 low at 2700. Breach would warn of a decline to the 2014 low at 2000.

Shanghai Composite Index

Commodity prices are plunging in anticipation of falling demand from China.

DJ-UBS Commodity Index

Chinese monthly iron ore imports are down at 83.24 mt, compared to earlier peaks of 100 mt earlier in 2017. Iron ore spot price is testing primary support $63/tonne. A Trend Index peak below zero warns of selling pressure. Breach of support is likely and would warn of a decline to $58/tonne.

Iron Ore

A falling Aussie Dollar may cushion local resources stocks from some of the impact.

Australian Dollar

But ASX 300 Metals & Mining index continues to test medium-term support at 3800. Breach of support is likely and would warn of a correction to test the rising trendline.

ASX 300 Metals & Mining

Resources stocks remain in a primary up-trend but I am bearish on the medium-term outlook.

S&P 500 retraces while Shanghai shudders

The S&P 500 retreated from resistance at 2800. Retracement is modest and I expect support above the rising trendline (2700). Volatility (Twiggs 21-Day) is below 1.0%, indicating that market risk has returned to normal levels.

S&P 500 and Twiggs Volatility

The tech-heavy Nasdaq 100 is in a stronger position, making a new high at 7300, but is now likely to retrace to test the new support level at 7000. I am wary of Twiggs Money Flow as a lower peak would signal bearish divergence. A lot will depend on how buyers react at the new support level.

Nasdaq 100

China’s Shanghai Composite Index, on the other hand, broke support at 3000, signaling a primary decline. Initial target is the February 2016 low at 2700.

Shanghai Composite Index

Hong Kong’s Hang Seng Index weakened in sympathy. Breach of support at 29000 would signal a primary down-trend.

Hang Seng Index

Around the markets: Hong Kong & India bullish

Canada’s TSX 60 continues to test resistance at the former primary support level of 900. Bearish divergence on Twiggs Money Flow warns of strong selling pressure. Decline below 880 would confirm a primary down-trend, with an initial target of 865*.

TSX 60 Index

* Target calculation: 900 – ( 935 – 900 ) = 865

The Footsie recovered above 7400 but bearish divergence on Twiggs Money Flow warns of long-term selling pressure. Another test of primary support at 7100 remains likely.

FTSE 100 Index

European stocks are taking a beating, with the Dow Jones Euro Stoxx 50 Index testing support at 3400. Sharp decline on Twiggs Money Flow warns of selling pressure. Breach of 3400 would warn of a test of 3200.

DJ Euro Stoxx 50 Index

* Target calculation: 3650 – ( 3650 – 3450 ) = 3850

India’s Sensex remains in a bull market.

BSE Sensex

* Target calculation: 29000 + ( 29000 – 26000 ) = 32000

As does Hong Kong’s Hang Seng Index.

Hang Seng Index

* Target calculation: 24000 – ( 24000 – 21500 ) = 26500

While China’s Shanghai Composite index ranges between 3000 and 3300. Government interference remains a concern.

Shanghai Composite Index

Round the world: India & Hong Kong advance, Canada falters

Canada’s TSX 60 retraced to test resistance at the former primary support level of 900. Respect is likely and would signal a bear market. Decline of Twiggs Money Flow/Trend Index below zero would strengthen the bear signal. Medium-term target for the decline is 865*.

TSX 60 Index

* Target calculation: 900 – ( 935 – 900 ) = 865

The Footsie is losing momentum, with penetration of successive trendlines and declining Twiggs Trend Index. A test of primary support at 7100 is likely.

FTSE 100 Index

Dow Jones Euro Stoxx 50 Index, representing the 50 largest stocks in the Euro Zone, found support above 3400. Penetration of the declining trendline would indicate the correction is over and suggest the start of another advance — confirmed if the index breaks its recent (May 2017) high.

DJ Euro Stoxx 50 Index

* Target calculation: 3650 – ( 3650 – 3450 ) = 3850

It’s full steam ahead for India’s Sensex. Trend Index troughs above zero indicate strong buying pressure. Expect some profit-taking at the target of 32000* but any correction is likely to be shallow as the bull market gathers momentum.

BSE Sensex

* Target calculation: 29000 + ( 29000 – 26000 ) = 32000

Hong Kong’s Hang Seng Index has also reached its target of 26500. Again Trend Index troughs above zero indicate solid buying pressure.

Hang Seng Index

* Target calculation: 24000 – ( 24000 – 21500 ) = 26500

China’s Shanghai Composite index is also rallying but I remain wary of government intervention.

Shanghai Composite Index

China: Stay clear

“Never trade against the central bank” is a golden rule of trading. Rule #2 should be: “When the central bank behaves erratically, stay clear.” The PBOC announced a crackdown on wealth management products in May but alarm at the rapid contraction elicited a quick retraction.

The Shanghai Composite Index broke support at 3050/3100 signaling a primary decline. But the PBOCs sudden reversal spurred a recovery, with the index now likely to test resistance at 3300. Rising Twiggs Money Flow indicates buying pressure. Reversal below 3050 is unlikely but would confirm a primary down-trend.

Shanghai Composite Index

Shanghai intervention

The Shanghai Composite Index recovered above primary support at 3100, after the state moved quickly to ease contractionary pressures from the recent crackdown on wealth management products. Rising Twiggs Money Flow signals buying pressure but the situation is artificial. Normally breach of primary support would elicit strong selling.

Shanghai Composite Index

* Target medium-term: May 2016 low of 2800