Nasdaq breaks resistance

Real GDP growth came in at a healthy 3.2% for the 12 months ended 31 March 2019. Growth in total hours worked is lagging below 2.0%, suggesting that further acceleration is unlikely.

Real GDP and Total Hours Worked

Growth in total non-farm payrolls continues at close to 2.0%, minimizing the chance of an interest rate cut by the Fed.

Payroll Growth

The S&P 500 is testing its previous high at 2940, while a rising Trend Index (13-week) indicates buying pressure.

S&P 500

The Nasdaq 100 broke resistance at 7700, signaling another advance. Expect retracement to test the new support level. The long-term target is 9000.

Nasdaq 100

A rapid advance would outstrip earnings growth, with high earnings multiples warning of elevated risk. The market is quite capable of continuing this behavior for an extended time but I urge readers to be cautious and look for rising sales and earnings to support the stock price.

S&P 500: Rate cuts and employment

Ten-year Treasury yields rallied for the last two weeks but remain in a down-trend. Respect of resistance at 2.60% would warn of another decline.

10-year Treasury yields

Inflation is subdued and it would be difficult for the Fed to motivate a rate cut when inflation is close to its 2.0% target. The consumer price index (CPI) came in at 1.86% for the 12 months to March 2019, while the more stable Core CPI (ex- Food & Energy) remains close to target at 2.04%.

CPI and Core CPI

After price stability, the second part of the Fed’s dual mandate is to maintain maximum sustainable employment. A review of the last three cycles shows the Fed raising the funds rate (FFR) to curb inflation and then being forced to cut (red highlights) when growth in employment slows.

Payroll Changes and Fed Funds Rate

Total non-farm payrolls are currently growing at close to 2.0%. The Fed would normally need payroll growth to slow by at least 1.0% to motivate a rate cut. The exception is if inflation falls below target, then the Fed may act sooner.

The S&P 500 is headed for another test of its high at 2950, while Trend Index (13-week) recovered to signal moderate buying pressure.

S&P 500

The Nasdaq 100 is similarly testing its earlier high at 7700.

Nasdaq 100

Momentum is slowing and we can expect stubborn resistance at the former highs.

It’s a funny kind of bear market

The US economy continues to show signs of robust good health.

Total hours worked are rising, signaling healthy real GDP growth.

Real GDP and Total Hours Worked

Growth in average hourly wage rates is rising, reflecting a tighter labor market. Underlying inflationary pressures may be rising but the Fed seems comfortable that this is containable.

Average Hourly Wage Rates

The Leading Index from the Philadelphia Fed maintains a healthy margin above 1.0% (below 1% is normally a signal that the economy is slowing).

Leading Index

But market volatility remains high, with S&P 500 Volatility (21-day) above 2.0%. A trough above 1% on the next multi-week rally would confirm a bear market — as would an index retracement that respects 2600.

S&P 500

The Nasdaq 100 is undergoing a similar retracement with resistance at 6500.

Nasdaq 100

The primary disturbance is the trade confrontation between the US and China. There is plenty of positive spin from both sides but I expect trade negotiations to drag out over several years — if they are successful. If not, even longer.

I keep a close watch on the big five tech stocks as a barometer of how the broader market will be affected. So far the results are mixed.

Apple is most vulnerable, with roughly 25% of projected sales to China. Recent downward revision of their sales outlook warns that Chinese retail sales are falling. AAPL is testing its primary support level at 150.

ASX 200

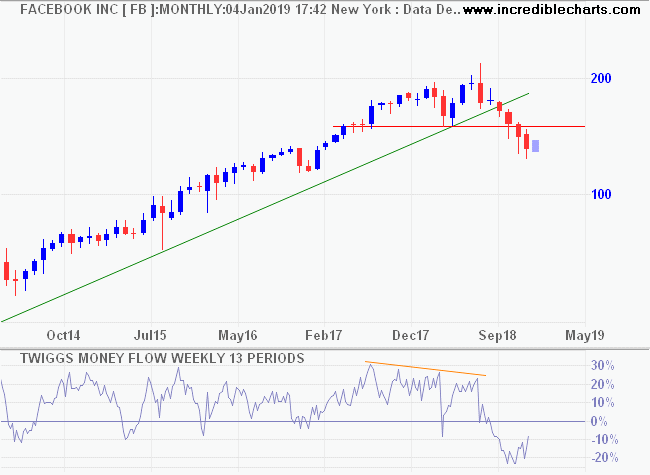
Facebook and Alphabet are largely unaffected by a Chinese slowdown, but have separate issues with user privacy. Facebook (FB) is in a primary down-trend.

ASX 200

While Alphabet (GOOGL) is testing primary support at 1000.

ASX 200

Amazon (AMZN) is similarly isolated from a Chinese slow-down although there may be a secondary impact on suppliers. Primary support at 1300 is likely to hold.

ASX 200

Microsoft (MSFT) is the strongest performer of the five. Their segment reporting does not provide details of exposure to China but it appears to be a small percentage of total sales.

ASX 200

The outlook for stocks is therefore mixed. Be cautious but try to avoid a bearish mindset, where you only see problems and not the opportunities. Even if China does suffer a serious slowdown we can expect massive stimulus similar to 2008 – 2009, so the impact on developing markets and resources markets may be cushioned.

Best wishes for the New Year.

Risk averse rather than fearful

The S&P 500 is again testing the band of primary support between 2600 and 2550. Follow-through below this level would warn of a bear market. Volatility (21-day) is in the amber zone between 1% and 2%. A real test of market resilience will be the next sizable rally or advance. If declining volatility remains above 1%, that would warn of an imminent market sell-off.

S&P 500

The Nasdaq 100 is in a similar position, with declining Money Flow warning of medium-term selling pressure.

Nasdaq 100

Of the big five tech stocks, only Microsoft looks strong. Facebook is in a primary down-trend but Apple and Google are testing primary support. Apple’s exposure to China is obviously a concern. China accounts for roughly 25% of Apple’s global market but Apple estimates that it is responsible for 4.8 million jobs in China which gives them some negotiating clout.

Big Five tech stocks

If two more of the big five broke primary support, that would in my opinion signal a bear market.

Asia

The Shanghai Composite Index is consolidating in a narrow band below 2700. Downward breakout is likely and would signal another decline, with a target of 2300.

Shanghai Composite Index

India’s Nifty is testing resistance at 11,000. Respect would be bearish, warning of another test of primary support at 10,000. Declining peaks on the Trend Index warn of long-term selling pressure.

NSX Nifty

Europe

Dow Jones Euro Stoxx is in a primary down-trend. Follow-through below 350 confirms a bear market, warn of a decline to test 305/310.

DJ Euro Stoxx 600

The Footsie also broke primary support at 6900. Retracement is testing the new resistance level but respect of 7000 is likely and would confirm a bear market, with a target between 5600 and 6000.

FTSE 100

There is a high level of uncertainty in global markets at present. Europe has Brexit and Italy. The US has investigations into Donald Trump’s election campaign. China has the threat of a trade war with the US. But my sense is that the market has become risk averse rather than fearful. There is no sign of panic selling as yet. But investors are clearly on the defensive and prepared to sell off vulnerable stocks.

Adopt the pace of nature: her secret is patience.

~ Ralph Waldo Emerson

Europe cracks but US steady

Dow Jones Euro Stoxx 600 followed through below 350, confirming a bear market in Europe. A Trend Index peak below zero warns of strong selling pressure. Expect a decline to test 305/310.

DJ Euro Stoxx 600

The Footsie broke support at 6900, signaling a primary down-trend, while a Trend Index peak at zero warns of selling pressure. Expect a decline, with a target of 6000.

FTSE 100

US markets are high on volatility but low on direction.

The S&P 500 continues to range between 2600 and 2800. Breach of 2600 would warn of a primary decline but rising volatility does not flag immediate danger. A large trough above 1% extending over at least six to eight weeks, however, would warn of elevated risk.

S&P 500

The Nasdaq 100 shows a W-shaped bottom above primary support at 6500. Declining Money Flow is still above the zero line suggesting that the sell-off is secondary in nature.

Nasdaq 100

Last week I mentioned that bellwether transport stock Fedex had breached primary support but quarterly Fedex Express package shipments were rising in August 2018. Statistics for Q2, to November 30, are due for release on December 18 and I expect will reflect a robust economy.

Fedex

East to West

The S&P 500 put in a strong blue candle this week but one swallow doesn’t make a summer. Follow-through above 2800 would signal a test of 2950. Small bullish divergence on Twiggs Money Flow looks promising but is secondary in nature and may not alter the larger trend.

S&P 500

The Nasdaq 100 shows a similar W-shaped bottom but weaker divergence.

Nasdaq 100

Bellwether transport stock Fedex recovered above the former primary support level at 225 but still looks weak. Reversal below 220 would warn of another decline.

Fedex

Asia

The Shanghai Composite Index rally ran out of steam. Respect of 2700 warns of another decline, with a target of 2300.

Shanghai Composite Index

India’s Nifty is headed for a test of 11,000. Respect would be bearish, warning of another test of primary support at 10,000. Declining peaks on the Trend Index warn of long-term selling pressure.

NSX Nifty

Australia

The ASX 200 is testing primary support at 5650 following a down-turn on the mining index. Bullish divergence on Twiggs Money Flow has now rolled over, with penetration of the rising trendline. Breach of primary support would warn of a decline, with a target of 5000.

ASX 200

Europe

Dow Jones Euro Stoxx warns of a bear market. Breach of primary support at 365, and respect of the new resistance level on the subsequent retracement, warn of a decline to test 305/310.

DJ Euro Stoxx 600

The Footsie is testing support at 6900, while bearish divergence on the Trend Index warns of selling pressure. Breach would signal a decline, with a target between 5600 and 6000.

FTSE 100

Never cut a tree down in the wintertime. Never make a negative decision in the low time. Never make your most important decisions when you are in your worst moods. Wait. Be patient. The storm will pass. The spring will come.

~ Robert Schuller

Two years is a long time

An outcome where neither Republicans nor Democrats control both chambers provides markets with reassurance that nothing too radical will emerge, making the outlook for the next two years appear more predictable and the settings more stable……But the complacency might be premature. ~ Stephen Bartholomeusz

With Democrats in control, Donald Trump is unlikely to get further tax cuts through Congress. Even a large infrastructure spending program, which both major parties support, is unlikely to enjoy a smooth passage through the House because of a polarizing President and a federal budget deficit already close to 5.0% of GDP.

The Fed will continue to raise interest rates in order to contain inflationary pressures, fueled by low unemployment and the current budget deficit. Rising average hourly wage rates warn that the Fed will be forced to act.

Average Hourly Wage Rate

Earnings growth rates are likely to slow because of higher interest rates, higher wages and higher input costs from imports and trade tariffs (although a strong Dollar may soften the blow). But there is no sign of this in Q2 2018, with profits rising and employee compensation falling as a percentage of value added.

Corporate Profits and Employee Compensation as a Percentage of Value Added

Restraint from buybacks in October — the four weeks prior to earnings releases are known as the “blackout period” — may have contributed to the severity of the recent correction. But now most earnings have been reported and buybacks are likely to return with a vengeance, taking advantage of low prices. I expect support at October lows to hold, though there is likely to be another test in the next few weeks.

Declining Twiggs Money Flow peaks on the S&P 500 warn of selling pressure and it is likely to take several months for confidence to be restored. Recovery above 2850 would be bullish, suggesting another advance.

S&P 500

The Nasdaq 100 respected its long-term rising trendline at 6600. Again, recoveries take time: there are few “V-shaped” corrections and plenty with a “W-shape”.

Nasdaq 100

Buybacks and strong reported Q3 earnings are likely to counter bearish sentiment but there is one wild-card. Trade is one of the few areas where the President still has the reins and he is likely to make full use of them. I suspect that the Chinese will attempt to wait him out, making conciliatory noises but doing little that is concrete, which is likely to frustrate Trump further. He may try to force a deal through before the next election in two years. That could only end badly.

The two most powerful warriors are patience and time.

~ Leo Tolstoy

Nasdaq and S&P 500 rally

The Nasdaq 100 rallied now that mid-term election results are emerging largely as expected. Faith in the primary up-trend is growing but it will take several weeks, if not months, for confidence to be restored and memory of the correction to fade. Hesitancy and a second test of new support at 6600/6700 are likely. There are few “V-shaped” corrections of this magnitude. Most are “W-shaped”, as in the first quarter.

Nasdaq 100

The S&P 500 displays a similar rally but it will take time for Twiggs Money Flow to break the descending trendline and signal that buying strength is restored. Expect another test of support at 2600/2650.

S&P 500

Buckley’s chance that rate hikes will slow

Average hourly wage rates are rising, with Production & Non-Supervisory Employees growing at an annual rate of 3.20% and All Employees at 3.14%.

Average Hourly Wage Rate

This is a clear warning to the Fed that underlying inflationary pressures are rising. There is Buckley’s chance* that they will ease off on rate hikes.

The Fed adopts a restrictive stance whenever hourly wage rate growth exceeds 3%, illustrated below by a high or rising Fed Funds Rate.

Average Hourly Wage Rate

The market is adopting a wait-and-see attitude ahead of Tuesday’s mid-term elections. Stocks like Apple (AAPL) have been sold down on strong volume despite good earnings results: earnings per share of $2.91 and revenue of $62.9 billion for Q4-18, compared to consensus estimates of $2.79 and $61.5 billion.

Apple

Optimism over a possible trade deal with China may not last the week.

A harami-like candle on the S&P 500 reflects indecision, while bearish divergence on Twiggs Money Flow warns of long-term selling pressure. Breach of 2550 is still unlikely but would warn of a primary down-trend.

S&P 500

The Nasdaq 100 tells a similar story, with primary support at 6300.

Nasdaq 100

* William Buckley was an English convict transported to Australia. He escaped when the ships laid anchor in Port Phillip Bay in 1803. The nearest permanent settlement, Sydney, was more than 1000 km away and, considered to have no chance of survival, he was given up for dead. Thirty-two years later, having lived among the Wathaurung Aboriginal people, he emerged from the bush when a settlement was established at Port Phillip in 1835. “Buckley’s chance” is an Australian colloquialism meaning having no chance at all.

No explanation required

In the past week, I have seen a number of market commentators attempting to explain the current correction. Reasons given vary from rising interest rates, Fed shrinking its balance sheet, the impact of trade tariffs on manufacturing input costs and inflation, mid-term elections and peak growth in earnings.

Truth is, there is no single reason that could justify the dramatic market falls. Some of the reasons cited are insufficient while others are invalid. But no explanation is necessary. Market sentiment has simply shifted. The scale has tipped and more investors are taking profits than new money coming into the market. When that happens, prices fall. And falling prices become a self-fulfilling prophecy, scaring off new investors and panicking investors with a short-term outlook.

How long this will go on for, I cannot tell. But I am sure there are growing numbers of long-term investors picking through the debris looking for opportunities. And the greater the fall, the greater the opportunity.

Earlier in the week I cited Netflix (NFLX) as one such example. Price has fallen almost 20% in October 2018, while recently released earnings announced a 34% year-on-year increase in revenue for the third quarter and a 130% increase in operating income.

Netflix

Patience is required but opportunities abound.

East to West

A quick recap of markets.

China’s Shanghai Composite Index is in a primary down-trend, having broken primary support at 2650, but rising troughs on the Trend Index warn of strong support. I suspect this is government-orchestrated as investors have little reason for optimism.

Shanghai Composite Index

India’s Nifty is testing primary support at 10,000.

Nifty

Europe is in a primary down-trend, with the DJ Euro Stoxx 600 respecting its former primary support level at 365/366.

DJ Euro Stoxx 600

The Footsie is testing primary support at 6900/7000.

FTSE 100

Dow Jones Industrial Average is undergoing a strong correction. Bearish divergence on the Trend Index warns of a reversal but only breach of primary support at 23,500, completing a double-top, would confirm.

Dow Jones Industrial Average

Dow Jones Transportation Average is already testing primary support at 10,000. Reversal signals on both averages would confirm a bear market according to Dow Theory.

Dow Jones Transportation Average

But technology stocks play a far larger role than in Charles Dow’s day, more than a hundred years ago. The Nasdaq 100 is still a long way above primary support at 6,300. Bearish divergence on Money Flow warns of selling pressure, but only breach of primary support would confirm a bear market.

Nasdaq 100

The only thing we have to fear is fear itself.

~ Franklin D. Roosevelt, 1933 inaugural address