
We have had a number of major indicators warning of a bear market over the year, with the S&P 500 falling by more than 20%, completing a Dow Theory reversal, and 100-day Momentum holding below zero.

On the recession front, GDP recorded two quarters of negative growth — a useful rule of thumb recession measure. The middle of the Treasury yield curve also inverted — with the 10-year yield falling below the 2-year — warning of a recession ahead.

But unemployment (3.5%) is the lowest since the 1960s and the NBER has not moved to confirm a recession.

The front-end of the yield curve also remained positive, failing to confirm the signal from the 10-year/2-year negative spread.
Until now, that is.
On Tuesday, the 10-year/3-month Treasury spread turned negative, confirming the earlier 10Y/2Y recession warning.

Why is that important?
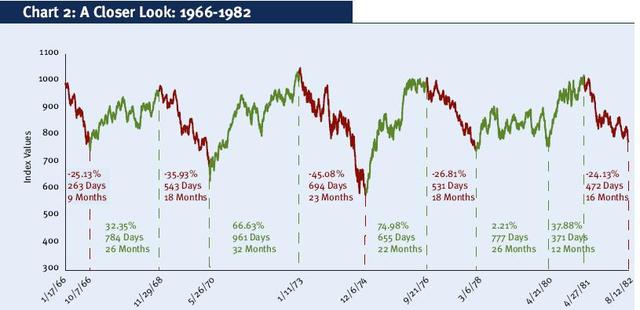
Because a negative 10-year/3-month spread has preceded every recession since 1960. One possible exception is 1966 (orange circle below). The 10Y/3M inverted, the Dow fell by 25%, and the NBER confirmed a recession but later changed their mind and airbrushed the recession out of the record. All-in-all, the 10Y/3M is our most reliable recession indicator, with a 100% track record in our view, over the past sixty years.

Conclusion
Our most reliable recession indicator, a negative 10-year/3-month Treasury yield differential, now confirms the recession warning from other indicators. But the signal is often early and it could take 6 to 12 months for the actual recession to arrive.
After their recent track record, expectations that the Fed will manufacture a soft landing are the triumph of hope over experience.
Employment is a lagging indicator and often only falls during the recession. Inflation likewise lags monetary policy by up to 6 months, before the full impact is clear. We expect the Fed to continue hiking, waiting for employment and inflation to fall, until the lagged impact of past rate hikes comes into view. Instead of cutting interest rates to soften the impact, the Fed has indicated they will hold rates high for longer. If so, we are likely to experience a severe recession.
Our strategy is to invest in cash in the short-term and limit exposure to equities, other than precious metals, critical materials, and defensive stocks.

Colin Twiggs is a former investment banker with almost 40 years of experience in financial markets. He founded PVT Capital (AFSL number 546090), which provides income and growth strategies to wholesale clients.
Colin also co-founded Incredible Charts and writes the popular Patient Investor newsletter.
Using a top-down approach, Colin identifies macro trends in the global economy and then combines fundamental and technical analysis to evaluate opportunities in sectors that stand to benefit.
Focusing on interest rates and financial market liquidity as primary drivers of the economic cycle, he warned of the 2008/2009 and 2020 bear markets well ahead of actual events.


