Our 2023 Outlook

This is our last newsletter for the year, where we take the opportunity to map out what we see as the major risks and opportunities facing investors in the year ahead.

US Economy

The Fed has been hiking interest rates since March this year, but real retail sales remain well above their pre-pandemic trend (dotted line below) and show no signs of slowing.

Real Retail Sales

Retail sales are even rising strongly against disposable personal income, with consumers running up credit and digging into savings.

Retail Sales/ Disposable Personal Income

The Fed wants to reduce demand in order to reduce inflationary pressure on consumer prices but consumers continue to spend. Household net worth has soared — from massive expansion of home and stock prices, fueled by cheap debt, and growing savings boosted by government stimulus during the pandemic. The ratio of household net worth to disposable personal income has climbed more than 40% since the global financial crisis — from 5.5 to 7.7.

Household Net Worth/ Disposable Personal Income

At the same time, unemployment (3.7%) has fallen close to record lows, increasing inflationary pressures as employers compete for scarce labor.

Unemployment

Real Growth

Hours worked contracted by an estimated 0.12% in November (-1.44% annualized).

Real GDP & Hours Worked

But annual growth rates for real GDP growth (1.9%) and hours worked (2.1%) remain positive.

Real GDP & Hours Worked

Heavy truck sales are also a solid 40,700 units per month (seasonally adjusted). Truck sales normally contract ahead of recessions, marked by light gray bars below, providing a reliable indicator of economic growth. Sales below 35,000 units per month would be bearish.

S&P 500

Inflation & Interest Rates

The underlying reason for the economy’s resilience is the massive expansion in the money supply (M2 excluding time deposits) relative to GDP, after the 2008 global financial crisis, doubling from earlier highs at 0.4 to the current ratio of 0.84. Excessive liquidity helped to suppress interest rates and balloon asset prices, with too much money chasing scarce investment opportunities. In the hunt for yield, investors became blind to risk.

S&P 500

Suppression of interest rates caused the yield on lowest investment grade corporate bonds (Baa) to decline below CPI. A dangerous precedent, last witnessed in the 1970s, negative real rates led to a massive spike in inflation. Former Fed Chairman, Paul Volcker, had to hike the Fed funds rate above 19.0%, crashing the economy, in order to tame inflation.

S&P 500

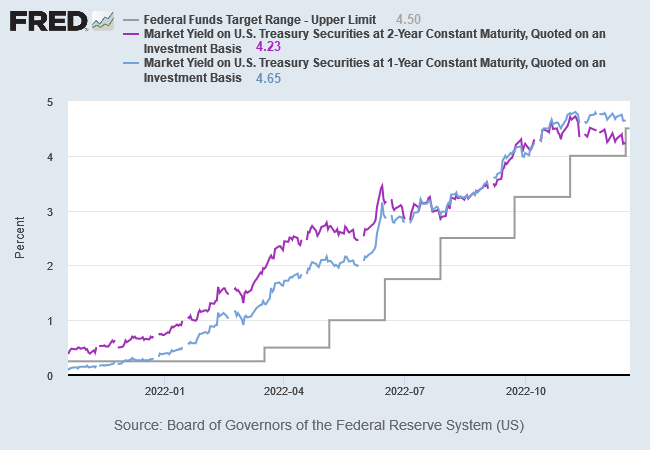
The current Fed chair, Jerome Powell, is doing his best to imitate Volcker, hiking rates steeply after a late start. Treasury yields have inverted, with the 1-year yield (4.65%) above the 2-year (4.23%), reflecting bond market expectations that the Fed will soon be forced to cut rates.
S&P 500

A negative yield curve, indicated by the 10-year/3-month spread below zero, warns that the US economy will go into recession in 2023. Our most reliable indicator, the yield spread has inverted (red rings below) before every recession declared by the NBER since 1960*.

S&P 500

Bear in mind that the yield curve normally inverts 6 to 18 months ahead of a recession and recovers shortly before the recession starts, when the Fed cuts interest rates.

Home Prices

Mortgage rates jumped steeply as the Fed hiked rates and started to withdraw liquidity from financial markets. The sharp rise signals the end of the 40-year bull market fueled by cheap debt. Rising inflation has put the Fed on notice that the honeymoon is over. Deflationary pressures from globalization can no longer be relied on to offset inflationary pressures from expansionary monetary policy.

S&P 500

Home prices have started to decline but have a long way to fall to their 2006 peak (of 184.6) that preceded the global financial crisis.

S&P 500

Stocks

The S&P 500 is edging lower, with negative 100-day Momentum signaling a bear market, but there is little sign of panic, with frequent rallies testing the descending trendline.

S&P 500

Bond market expectations of an early pivot has kept long-term yields low and supported stock prices. 10-Year Treasury yields at 3.44% are almost 100 basis points below the Fed funds target range of 4.25% to 4.50%. Gradual withdrawals of liquidity (QT)  by the Fed have so far failed to dent bond market optimism.

10-Year Treasury Yield & Fed Funds Rate

Treasuries & the Bond Market

Declining GDP is expected to shrink tax receipts, while interest servicing costs on existing fiscal debt are rising, causing the federal deficit to balloon to between $2.5 and $5.0 trillion according to macro/bond specialist Luke Gromen.

Federal Debt/GDP & Federal Deficit/GDP

With foreign demand for Treasuries shrinking, and the Fed running down its balance sheet, the only remaining market  for Treasuries is commercial banks and the private sector. Strong Treasury issuance is likely to increase upward pressure on yields, to attract investors. The inflow into bonds is likely to be funded by an outflow from stocks, accelerating their decline.

Energy

Brent crude prices fell below $80 per barrel, despite slowing releases from the US strategic petroleum reserve (SPR). Demand remains soft despite China’s relaxation of their zero-COVID policy — which some expected to accelerate their economic recovery.

S&P 500

European natural gas inventories are near full, causing a sharp fall in prices. But prices remain high compared to their long-term average, fueling inflation and an economic contraction.

S&P 500

Europe

European GDP growth is slowing, while inflation has soared, causing negative real GDP growth and a likely recession.

S&P 500

Australia, Base Metals & Iron Ore

Base metals rallied on optimism over China’s reopening from lockdowns. Normally a bullish sign for the global economy, breakout above resistance at 175 was short-lived, warning of a bull trap.

S&P 500

Iron ore posted a similar rally, from $80 to $110 per tonne, but is also likely to retreat.

S&P 500

The ASX benefited from the China rally, with the ASX 200 breaking resistance at 7100 to complete a double-bottom reversal. Now the index is retracing to test its new support level. Breach of 7000 would warn of another test of primary support at 6400.S&P 500

China

Optimism over China’s reopening may be premature. Residential property prices continue to fall.

S&P 500

The reopening also risks a massive COVID exit-wave, against an under-prepared population, when restrictions are relaxed.

“In my memory, I have never seen such a challenge to the Chinese health-care system,” Xi Chen, a Yale University global health researcher, told National Public Radio in America this week. With less than four intensive care beds for every 100,000 people and millions of unvaccinated or partially protected older adults, the risks are real.

With official data highly unreliable, it is hard to track exactly what impact China’s U-turn is having. Authorities on Friday reported the first Covid-19 deaths since most restrictions were lifted in early December, but there have been reports that funeral homes in Beijing are struggling to handle the number of bodies being brought in.

“The risk factors are there: eight million people are essentially not vaccinated,” said Huang Yanzhong, senior fellow for global health at the Council on Foreign Relations.

“Unless this variant has evolved in a way that makes it harmless, China can’t avoid what happened in Taiwan or in Hong Kong,” he added, referring to significant “exit waves” in both places.

The scale of the surge is unlikely to be apparent for months, but modelling suggests it could be grim. A report from the University of Hong Kong released on Thursday warned that a best case scenario is 700,000 fatalities – forecasts from a UK-based analytics firm put deaths at between 1.3 and 2.1 million.

“We’re still at a very early stage in this particular exit wave,” said Prof Ben Cowling, an epidemiologist at the University of Hong Kong. (The Telegraph)

China relied on infrastructure spending to get them out of past economic contractions but debt levels are now too high for stimulus on a similar scale to 2008. Expansion of credit to local government and real estate developers is likely to cause further stagnation, with the rise of zombie banking and real estate sectors — as Japan experienced for more than three decades — suffocating future growth.

S&P 500

Conclusion

Resilient consumer spending, high household net worth, and a tight labor market all make the Fed’s job difficult. If the current trend continues, the Fed will be forced to hike interest rates higher than the bond market expects, in order to curb demand and tame inflation.

Expected contraction of European and Chinese economies, combined with rate hikes in the US, are likely to cause a global recession.

There are two possible exits. First, if central banks stick to their guns and hold interest rates higher for longer, a major and extended economic contraction is almost inevitable. While inflation may be tamed, the global economy is likely to take years to recover.

The second option is for central banks to raise inflation targets and suppress long-term interest rates in order to create a soft landing. High inflation and negative real interest rates may prolong the period of low growth but negative real rates would rescue the G7 from precarious debt levels that have ensnared them over the past decade. A similar strategy was successfully employed after WWII to extricate governments from high debt levels relative to GDP.

As to which option will be chosen is a matter of political will. The easier second option is therefore more likely, as politicians tend to follow the line of least resistance.

We have refrained from weighing in on the likely outcome of the Russia-Ukraine conflict. Ukraine presently has the upper hand but the conflict is a wild card that could cause a spike in energy prices if it escalates or a positive boost to the European economy in the unlikely event that peace breaks out.

Our strategy is to remain overweight in gold, critical materials, defensive stocks and cash, while underweight bonds and high-multiple technology stocks. In the longer term, we will seek to invest cash in real assets when the opportunity presents itself.

Acknowledgements

  • Hat tip to Macrobusiness for the Pantheon Macroeconomics (China Residential) and Goldman Sachs (China Local Government Funding & Excavator Hours) charts.

Notes

* The yield curve inverted ahead of a 25% fall in the Dow in 1966. The NBER declared a recession but later changed their minds and airbrushed it out of their records.

Coronavirus: “We are all Keynesians now”

An economic depression requires a 10% (or more) decline in real GDP or a prolonged recession that lasts two or more years.

The current contraction, sparked by the global coronavirus outbreak, is likely to be severe but its magnitude and duration are still uncertain. After an initial spike in cases, with devastating consequences in many countries — both in terms of the number of deaths and the massive economic impact — the rate of contagion is expected to drop significantly. But we could witness further flare-ups, as with SARS.

Development of a vaccine is the only viable long-term defense against the coronavirus but health experts warn that this is at least 12 to 18 months away — still extremely fast when compared to normal vaccine development programs.

The economic impact may soften after the initial shutdown but some industries such as travel, airlines, hotels, cruise lines, shopping malls, and cinemas are likely to experience lasting changes in consumer behavior. The direct consequences will be with us for some time. So will the indirect consequences: small business and corporate failures, widespread unemployment, collapsing real estate prices, and solvency issues within the financial system. The Fed is going to be busy putting out fires. While it can fix liquidity issues with its printing press, it can’t fix solvency issues.

There are three key factors that are likely to determine whether countries end up with a depression or a recession:

1. Leadership during the crisis

Many countries were caught by surprise and the rapid spread of the virus from its source in Wuhan, China. South Korea, Singapore and Taiwan were best prepared, after dealing with the SARS outbreak in the early 2000s. Extensive testing, tracing and an effective quarantine program helped South Korea to bring the spread under control, after initially being one of the worst-hit.

Daily Increase - South Korea

South Korea: Initial Cases of Coronavirus COVID-19 (JHU)

The World Health Organization (WHO) did little to help, delaying declaration of a pandemic to appease the CCP. Economic and political self-interest has been the root cause of many failures along the way, including China’s failure to alert global authorities of the outbreak (they had already shut down Wuhan Naval College on January 1st). But this was aided by failure of many leaders to heed warnings from infectious disease experts in late January/early February. When they finally did wake up to the threat, many were totally unprepared, resulting in a massive spike in cases across Europe and North America.

Testing is a major bottleneck, with the FDA fast-tracking approval of new tests, but production volumes are still limited. Abbott recently obtained FDA approval for a new 5-minute test kit that can be used in temporary screening locations, outside of a hospital, but production is currently limited to 50,000 per day. A drop in the ocean. It would take 6 months to produce 9 million kits for New York alone.

Daily Increase - USA

USA: Initial Cases of Coronavirus COVID-19 (JHU)

Daily Increase - UK

UK: Initial Cases of Coronavirus COVID-19 (JHU)

Daily Increase - Germany

Germany: Initial Cases of Coronavirus COVID-19 (JHU)

Daily Increase - Italy

Italy: Initial Cases of Coronavirus COVID-19 (JHU)

Widespread testing and tracing, social-distancing, and effective quarantine methods have enabled some countries to flatten the curve. Australia may be succeeding in reducing the number of new cases but inadequate testing and tracing could lead to further flare-ups. One of the biggest dangers is asymptomatic carriers who can infect others. Flattening the curve is the first step, but keeping it flat is essential, and requires widespread testing and tracing.

Daily Increase - Australia

Australia: Initial Cases of Coronavirus COVID-19 (JHU)

The curves for North America and Europe remain exponential. They may even spike a lot higher if hospital facilities are overrun. Success in flattening the curve is critical, not just in minimizing the number of deaths but in containing the economic impact.

2. Economic rescue measures during the crisis

Rescue measures amounting to roughly 10% of annual GDP have been introduced in several countries, including the US and Australia, to soften the economic impact of the shutdown. More Keynesian stimulus may be needed if the coronavirus curve is not flattened. Layoffs have spiked and many small businesses will be unable to recover without substantial support.

3. Economic stimulus after the crisis

This is not a time for half-measures and the $2 trillion infrastructure program proposed in the US is also appropriate in the circumstances. Australia is likely to need a similar program (10% of GDP) but it is essential that the money be spent on productive infrastructure assets. Productive assets must generate a market-related return on investment ….or generate an equivalent increase in government tax revenue but this is much more difficult to measure. Investment in unproductive assets would leave the country with a sizable debt and no ready means of repaying it (much like Donald Trump’s 2017 tax cuts).

Conclusion

Social-distancing and effective quarantine measures are necessary to flatten the curve but widespread testing and tracing is essential to prevent further flare-ups. Development of a vaccine could take two years or more. Until then there is likely to be an on-going economic impact, long after the initial shock. This is likely to be compounded by a solvency crisis in small and large businesses, threatening the stability of the financial system. The best we can hope for, in the circumstances, is to escape with a recession — less than 10% contraction in GDP and less than two year duration — but this will require strong leadership, public cooperation and skillful prioritization of resources.

—–

“We are all Keynesians now.” ~ Richard Nixon (after 1971 collapse of the gold standard)

Australia needs to break the downward spiral

Ross Gittins, Economics Editor at The Sydney Morning Herald, sums up Australia’s predicament:

“The problem is, the economy seems to be running out of puff because it’s caught in a vicious circle: private consumption and business investment can’t grow strongly because there’s no growth in real wages, but real wages will stay weak until stronger growth in consumption and investment gets them moving.

Policy has to break this cycle. But, as [RBA governor] Lowe now warns in every speech he gives, monetary policy (lower interest rates) isn’t still powerful enough to break it unaided. Rates are too close to zero, households are too heavily indebted, and it’s already clear that the cost of borrowing can’t be the reason business investment is a lot weaker than it should be.

That leaves the budget as the only other instrument available. The first stage of the tax cuts will help, but won’t be nearly enough…..”

Cutting already-low interest rates is unlikely to cure faltering consumption and business investment. Low wage growth and a deteriorating jobs market are root causes of the downward spiral and not much will change until these are addressed.

Low unemployment is misleading. Underemployment is growing. Trained barristers working as baristas may be an urban legend but there is an element of truth. The chart below shows underemployment in Australia as a percentage of total employment.

Australia: Underemployment % of Total Employment

How to halt the spiral

Tax cuts are an expensive sugar hit. The benefit does not last and may be frittered away in paying down personal debt or purchasing imported items like flat-screen TVs and smart phones. Tax cuts are also expensive because government is left with debt on its balance sheet and no assets to show for it.

Infrastructure spending can also be wasteful — like school halls and bridges to nowhere — but if chosen wisely can create productive assets that boost employment and build a healthy portfolio of income-producing assets to offset the debt incurred.

The RBA has already done as much as it can — and more than it should. Further rate cuts, or God forbid, quantitative easing, are not going to get us out of the present hole. What they will do is further distort price signals, leading to even greater malinvestment and damage to the long-term economy.

What the country needs is a long-term infrastructure plan with bipartisan support. Infrastructure should be a national priority. There is too much at stake for leadership to take a short-term focus, with an eye on the next election, rather than consensus-building around a long-term strategy with buy-in from both sides of the house.

12 Charts on the Australian economy

Australian GDP grew at a robust 3.1% for the year ended 31 March 2018 but a look at the broader economy shows little to cheer about.

Wages growth is slowing, with the Wage Price Index falling sharply.

Australia: Wage Price Index Growth

Falling growth in disposable income is holding back consumption (e.g. retail spending) and increasing pressure on savings.

Australia: Consumption and Savings

Housing prices are high despite the recent slow-down, while households remain heavily indebted, with household debt at record levels relative to disposable income.

Australia: Housing Prices and Household Debt

Housing price growth slowed to near zero and we are likely to soon see house prices shrinking.

Australia: Housing Prices

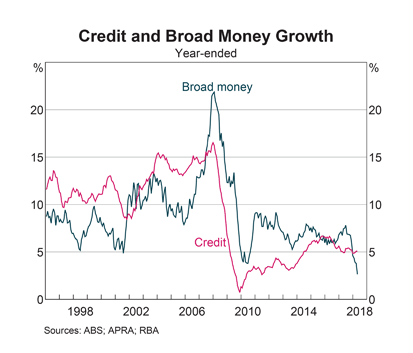
Broad money growth is falling sharply, reflecting tighter financial conditions, while credit growth is also slowing.

Australia: Broad Money and Credit Growth

Mining profits are up, while non-mining corporation profits (excluding banks and the financial sector) have recovered to about 12% of GDP.

Australia: Corporate Profits

But business investment remains weak, which is likely to impact on future growth in both profits and wages.

Australia: Investment

Exports are strong, especially in the Resources sector. Manufacturing is the only flat spot.

Australia: Exports

Iron ore export tonnage continues to grow, while demand for coal has leveled off in recent years.

Australia: Bulk Commodity Exports

Our dependence on China as an export market also continues to grow.

Australia: Exports by Country

Corporate bond spreads — the risk premium over the equivalent Treasury rate charged to non-financial corporate borrowers — remain low, reflecting low financial risk.

Australia: Non-financial Bond Spreads

Bank capital ratios are rising but don’t be fooled by the risk-weighted percentages. Un-weighted Common Equity Tier 1 leverage ratios are closer to 5% for the four major banks. Common Equity excludes bank hybrids which should not be considered as capital. Conversion of hybrids to common equity was avoided in the recent Italian banking crisis, largely because of the threat this action posed to stability of the entire financial system.

Australia: Bank Capital Ratios

Low capital ratios mean that banks are more likely to act as “an accelerant rather than a shock-absorber” in times of crisis (2014 Murray Inquiry). Professor Anat Admati from Stanford University and Neel Kashkari, President of the Minneapolis Fed are both campaigning for higher bank capital ratios, at 4 to 5 times existing levels, to ensure stability of the financial system. This is unlikely to succeed, considering the political power of the bank sector, unless the tide goes out again and reveals who is swimming naked.

The housing boom has run its course and consumption is slowing. The banks don’t have much in reserve if the housing market crashes — not yet a major risk but one we should not ignore. Exports are keeping us afloat because we hitched our wagon to China. But that comes at a price as Australians are only just beginning to discover. If Chinese exports fail, Australia will need to spend big on infrastructure. And infrastructure that will generate not just short-term jobs but long-term growth.

China’s infrastructure boom is over

China has been on a record-breaking infrastructure binge over the last decade, but that era is coming to an end. Fall of the Baltic Dry Index below its 2008 low illustrates the decline of bulk commodity imports like iron ore and coking and thermal coal, important inputs in the construction of new infrastructure and housing.

Baltic Dry Index

High-end commodities like copper held up far better since 2008, but they too are now on the decline.

Copper

With the end of the infrastructure boom, China’s economy may well prove to be a one-trick pony. Transition from a state-directed infrastructure ‘miracle’ to a broad-based consumer society will be a lot more difficult.

Here’s How to Achieve Full Employment

Economic Policy Institute President Lawrence Mishel provides the U.S. House Committee on Education and the Workforce with a shopping list of measures he believes are necessary to achieve full employment. Some are right on the mark while others seem to have missed the basic rules of Supply and Demand taught in Econ 101. My comments are in bold.

The goals that economic policy must focus on are, thus, creating jobs and reaching robust full employment, generating broad-based wage growth, and improving the quality of jobs.

Jobs

Policies that help to achieve full employment are the following:

1. The Federal Reserve Board needs to target a full employment with wage growth matching productivity.

The most important economic policy decisions being made about job growth in the next few years are those of the Federal Reserve Board as it determines the scale and pace at which it raises interest rates. Let’s be clear that the decision to raise interest rates is a decision to slow the economy and weaken job and wage growth. There are many false concerns about accelerating wage growth and exploding inflation based on the mistaken sense that we are at or near full employment. Policymakers should not seek to slow the economy until wage growth is comfortably running at the 3.5 to 4.0 percent rate, the wage growth consistent with a 2 percent inflation target (since trend productivity is 1.5 to 2.0 percent, wage growth 2 percent faster than this yields rising unit labor costs, and therefore inflation, of 2 percent). The key danger is slowing the economy too soon rather than too late.

Fed monetary policy should not target one sector of the economy (i.e. wages) but the whole economy (i.e. nominal GDP).

2. Targeted employment programs

Even at 4 percent unemployment, there will be many communities that will still be suffering substantial unemployment, especially low-wage workers and many black and Hispanic workers. To obtain full employment for all, we will need to undertake policies that can direct jobs to areas of high unemployment……

Government programs don’t create jobs, they merely redistribute income from the taxed to the subsidised.

3. Public investment and infrastructure

There is widespread agreement that we face a substantial shortfall of public investment in transportation, broadband, R&D, and education. Undertaking a sustained (for at least a decade) program of public investment can create jobs and raise our productivity and growth…..

Agree. But we must invest in productive assets that generate income that can be used to repay the debt. Else we are left with a pile of debt and no means to repay it.

Policies that do not help us reach full employment include:

1. Corporate tax reform

There are many false claims that corporate tax reform is needed to make us competitive and bring us growth. First off, the evidence is that the corporate tax rates U.S. firms actually pay (their “effective rates”) are not higher than those of other advanced countries. Second, the tax reform that is being discussed is “revenue neutral,” necessarily meaning that tax rates on average are actually not being reduced; for every firm or sector that will see a lower tax rate, another will see a higher tax rate. It is hard to see how such tax reform sparks growth.

Zero-sum thinking. If we want to increase employment, we need to increase investment. Tax rates and allowances should encourage domestic investment rather than offshore expansion.

2. Cutting taxes

There will surely be many efforts in this Congress to cut corporate taxes and reduce taxes on capital income (e.g., capital gains, dividends) and individual marginal tax rates, especially on those with the highest incomes. It’s easy to see how those strategies will not work….

Same as above. We need to encourage investment by private corporations.

3. Raising interest rates

There are those worried about inflation who are calling on the Federal Reserve Board to raise interest rates soon and steadily thereafter. Their fears are, in my analysis, unfounded. But we should be clear that those seeking higher interest rates are asking our monetary policymakers to slow economic growth and job creation and reflect a far-too-pessimistic assumption of how far we can lower unemployment, seemingly aiming for unemployment at current levels or between 5.0 and 5.5 percent….

Agreed. Raising interest rates too soon is as dangerous as raising too late.

Wage growth

It is a welcome development that policymakers and presidential candidates in both parties have now acknowledged that stagnant wages are a critical economic challenge…… Over the 40 years since 1973, there has been productivity growth of 74 percent, yet the compensation (wages and benefits) of a typical worker grew far less, just 9 percent (again, mostly in the latter 1990s)……

Wage stagnation is conventionally described as being about globalization and technological change, explanations offered in the spirit of saying it is caused by trends we neither can nor want to restrain. In fact, technological change has had very little to do with wage stagnation. Such an explanation is grounded in the notion that workers have insufficient skills so employers are paying them less, while those with higher wages and skills (say, college graduates) are highly demanded so that employers are bidding up their wages…….

Misses the point. Technology has enabled employers in manufacturing, finance and service industries to cut the number of employees to a fraction of their former size.

Globalization has, in fact, served to suppress wage growth for non-college-educated workers (roughly two-thirds of the workforce). However, such trends as import competition from low-wage countries did not naturally develop; they were pushed by trade agreements and the tolerance of misaligned and manipulated exchange rates that undercut U.S. producers.

This small paragraph hits on the key reason for wage stagnation in the US. Workers are not only competing in a global labor market, but against countries who have manipulated their exchange rate to gain a competitive advantage.

There are two sets of policies that have greatly contributed to wage stagnation that receive far too little attention. One set is aggregate factors, which include factors that lead to excessive unemployment and others that have driven the financialization of the economy and excessive executive pay growth (which fueled the doubling of the top 1 percent’s wage and income growth). The other set of factors are the business practices, eroded labor standards, and weakened labor market institutions that have suppressed wage growth. I will examine these in turn.

Aggregate factors

1. Excessive unemployment

Unemployment has remained substantially above full employment for much of the last 40 years, especially relative to the post-war period before then. Since high unemployment depresses wages more for low-wage than middle-wage workers and more for middle-wage than high-wage workers, these slack conditions generate wage inequality. ……

The excessive unemployment in recent decades reflects a monetary policy overly concerned about inflation relative to unemployment and hostile to any signs of wage growth……

2. Unleashing the top 1 percent: finance and executive pay

The major forces behind the extraordinary income growth and the doubling of the top 1 percent’s income share since 1979 were the expansion of the finance sector (and escalating pay in that sector) and the remarkable growth of executive pay …… restraining the growth of such income will not adversely affect the size of our economy. Moreover, the failure to restrain these incomes leaves less income available to the vast majority……

Zero-sum thinking.

Labor standards, labor market institutions, and business practices

There are a variety of policies within the direct purview of this committee that can greatly help to lift wage growth:
1. Raising the minimum wage

The main reason wages at the lowest levels lag those at the middle has been the erosion of the value of the minimum wage, a policy undertaken in the 1980s that has never fully been reversed. The inflation-adjusted minimum wage is now about 25 percent below its 1968 level……

Will reduce demand for domestic labor and increase demand for offshoring jobs.

2. Updating overtime rules

The share of salaried workers eligible for overtime has fallen from 65 percent in 1975 to just 11 percent today……

This will continue for as long as the manufacturing sector is white-anted by offshoring jobs.

3. Strengthening rights to collective bargaining

The single largest factor suppressing wage growth for middle-wage workers over the last few decades has been the erosion of collective bargaining (which can explain one-third of the rise of wage inequality among men, and one-fifth among women)……

How will this improve Supply and Demand?

4. Regularizing undocumented workers

Regularizing undocumented workers will not only lift their wages but will also lift wages of those working in the same fields of work…..

How will this improve Supply and Demand?

5. Ending forced arbitration

One way for employees to challenge discriminatory or unfair personnel practices and wages is to go to court or a government agency that oversees such discrimination. However, a majority of large firms force their workers to give up their access to court and government agency remedies and agree to settle such disputes over wages and discrimination only in arbitration systems set up and overseen by the employers themselves…..

How will this improve Supply and Demand?

6. Modernizing labor standards: sick leave, paid family leave

We have not only seen the erosion of protections in the labor standards set up in the New Deal, we have also seen the United States fail to adopt new labor standards that respond to emerging needs……

No issue with this. But how will it improve Supply and Demand?

7. Closing race and gender inequities

Generating broader-based wage growth must also include efforts to close race and gender inequities that have been ever present in our labor markets…….

No issue with this. But how will it improve Supply and Demand?

8. Fair contracting
These new contracting rules can help reduce wage theft, obtain greater racial and gender equity and generally support wage growth……

No issue with this. But how will it improve Supply and Demand?

9. Tackling misclassification, wage theft, prevailing wages

There are a variety of other policies that can support wage growth. Too many workers are deemed independent contractors by their employers when they are really employees……

No issue with this. But how will it improve Supply and Demand?

Policies that will not facilitate broad-based wage growth

1. Tax cuts: individual or corporate

The failure of wages to grow cannot be cured through tax cuts. Such policies are sometimes offered as propelling long-run job gains and economic growth (though they are not aimed at securing a stronger recovery from a recession, as the conservatives who offer tax cuts do not believe in counter-cyclical fiscal policy). These policies are not effective tools to promote growth, but even if they did create growth, it is clear that growth by itself will not lift wages of the typical worker…….

Zero-sum thinking. Compare economic growth in high-tax countries to growth in low tax countries and you will find this a highly effective policy tool.

2. Increasing college or community college completion

……advancing education completion is not an effective overall policy to generate higher wages……. What is needed are policies that lift wages of high school graduates, community college graduates, and college graduates, not simply a policy that changes the number of workers in each category.

Better available skills-base leads to increased competitiveness in global labor market and more investment opportunities in the domestic market.

3. Deregulation

There is no solid basis for believing that deregulation will lead to greater productivity growth or that doing so will lead to wage growth. Deregulation of finance certainly was a major factor in the financial crisis and relaxing Dodd–Frank rules will only make our economy more susceptible to crisis.

What we need is (simple) well-regulated markets rather than (complex) over-regulation.

4. Policies to promote long-term growth

Policies that can substantially help reduce unemployment in the next two years are welcomed and can serve to raise wage growth. Policies aimed at raising longer-term growth prospects may be beneficial but will not help wages soon or necessarily lead to wage growth in future years. This can be seen in the decoupling of wage growth from productivity over the last 40 years. Simply increasing investments and productivity will not necessarily improve the wages of a typical worker. What is missing are mechanisms that relink productivity and wage growth. Without such policies, an agenda of “growth” is playing “pretend” when it comes to wages.

Long-term investment is the only way forward. To dismiss this in favor of short-term band-aid solutions is nuts!

My proposal is a lot simpler, consisting of only five steps:

  1. Invest in productive infrastructure.
  2. A simplified tax regime with low rates and few deductions apart from incentives to increase domestic investment.
  3. Restrict capital inflows through trade agreements and maintain a fair exchange rate.
  4. Fed monetary policy supportive in the short-term but with long-term target of neutral debt growth — in line with GDP (nominal).
  5. Move education up the priority list for government spending. Improve the education standards and training of teachers — they are the lifeblood of the system — rather than increasing numbers.

Will the global economy follow Japan?| Michael Pettis’ CHINA FINANCIAL MARKETS

More from Michael Pettis on “Japanification” of the global economy. How abundant capital and investment in unproductive works may lead to long-term stagnation:

“Panics do not destroy capital,” John Mill proposed in his 1868 paper to the Manchester Statistical Society. “They merely reveal the extent to which it has been previously destroyed by its betrayal into hopelessly unproductive works.” Our ability to postpone the recognition of the full extent of these unproductive works depends in part on our ability to expand the supply of credible money. If we are constrained in our ability to expand the money supply, one impact of the crisis is a contraction in money (velocity collapses) that forces lenders to write down debt. If money can expand without constraints, however, debt does not have to be written down nearly as quickly.

With the main central banks of the world having banded together to issue unprecedented amounts of credible currency, in other words, we may have changed the dynamics of great global rebalancing crises. We may no longer have to forcibly write down “hopelessly unproductive works”, during which process the seemingly endless capital of the globalization phase is wiped out, and we enter into a phase in which capital is scarcer and must be allocated much more carefully and productively.

Instead, the historically unprecedented fact of our unlimited ability to issue a credible fiat currency allows us to postpone a quick and painful resolution of the debt burdens we have built up. It is too early to say whether this is a good thing or a bad thing. On the one hand, it may be that postponing a rapid resolution protects us from the most damaging consequences of a crisis, when slower growth and a rising debt burden reinforce each other, while giving us time to rebalance less painfully — the Great depression in the US showed us how damaging the process can be. On the other hand the failure to write down the debt quickly and forcefully may lock the world into decades of excess debt and “Japanification”. We may have traded, in other words, short, brutal adjustments for long periods of economic stagnation.

Investment in infrastructure is essential to rescue an economy from a contraction of aggregate demand following a financial crisis. The unpalatable alternative is a deflationary spiral and significant contraction in GDP. But we need to ensure that investment is made in productive assets — that generate market-related returns — rather than investments in social infrastructure that cannot generate sufficient revenue to service, nor be be sold to repay, debt funding.

Read more at Can monetary policy turn Argentina into Japan? | Michael Pettis' CHINA FINANCIAL MARKETS.

Should Beijing raise subway fares? | Michael Pettis

Michael Pettis’ argues that not only are SOEs “destroying value in the aggregate on a huge scale” but misallocated investment is endemic in China.

I have to confess that the reason I started saying in 2006-07 that China was eventually going to replace 1980s Japan as the global archetype of investment misallocation was not because I had a lot of data proving my case. Overinvestment is almost impossible to prove until after the fact, especially when you consider the circularity of the data – the growth assumptions feed into the valuation of the investment, which then feeds back into the growth assumptions.

My reasons were much more “systemic”. I did not believe it was possible for any country not to experience significant wasted investment after so many years – more than a decade in this case – of the highest investment growth rate in the world funded by massive credit expansion at such incredibly low lending rates roughly one-third the nominal GDP growth rate, and 1-3 percentage points below the GDP deflator. Add more spicy ingredients to the stew – first, the very limited experience of Chinese bankers and regulators, and most of that in a one-way market, second, widespread moral hazard, third, weak corporate governance, fourth, very fuzzy data, and finally, no enforced system of accountability – and I found it impossible to doubt that investment was being dangerously misallocated.

He also dispels the counter-argument that “Western” models don’t apply to China and that “a very poor, low-capital-stock country far from the technological frontier like China” is able to absorb higher levels of investment.

In 2008 (Red Star) I compared China to a red star in astronomy:

Students of astronomy will tell you that a red star, far from indicating heat, is cooling appreciably. While its diameter may expand, its core is contracting and its temperature falling. Eventually it will either explode or shrink to become a dwarf star….

My warning of an imminent collapse may have been premature, but no economy can survive such high levels of investment misallocation without major upheaval. China risks following the boom-bust growth path of Japan and the Asian tigers in the 1980s and 1990s.

Read more at Should Beijing raise subway fares? | Michael Pettis' CHINA FINANCIAL MARKETS.

High-speed gravy trains

Infrastructure spending is fraught with pitfalls. One of the most dangerous is lobbying by special interest groups who stand to profit from the project.

Dr Richard Wellings from the Institute of Economic Affairs recently completed a report on the UK’s £43 billion High Speed 2 rail project — close to £80 billion if fully costed — and comments:

It’s time the government abandoned its plans to proceed with HS2. The evidence is now overwhelming that this will be unbelievably costly to the taxpayer while delivering incredibly poor value for money.

It’s shameful that at a time of such financial difficulty for many families the government is caving in to lobbying from businesses, local councils and self-interested politicians more concerned with winning votes than governing in the national interest.

The conclusions in his report The High-Speed Gravy Train: Special Interests, Transport Policy and Government Spending are even more damning:

  • The decision to build High Speed 2 is not justified by an analysis of the costs and benefits of the scheme. Even the government’s own figures suggest that HS2 represents poor value for money compared with alternative investments in transport infrastructure.
  • Ministers appear to have disregarded the economic evidence and have chosen to proceed with the project for political reasons. An analysis of the incentives facing transport policymakers provides plausible explanations for their tendency to favour a low-return, high-risk project over high-return, low-risk alternatives.
  • A group of powerful special interests appears to have had a disproportionate influence on the government’s decision to build HS2. The high-speed-rail lobby includes engineering firms likely to receive contracts to build the infrastructure and trains for HS2, as well as senior officials of the local authorities and transport bureaucracies that expect to benefit from the new line.
  • An effective lobbying campaign in favour of HS2 was initiated and funded by concentrated interests expecting to make economic gains from the project. This effort appears to have been effective at marshalling support for the scheme among policymakers.
  • ‘Vote buying’ incentives were also important in building political support for a high-speed line. The policy was initially adopted partly as a response to local opposition to Heathrow expansion.
  • The main losers from HS2 – the taxpayers in every part of the UK who will be forced to fund it – are highly dispersed, and therefore have weak incentives to actively oppose it. By contrast, members of communities along the route, where losses are concentrated, have had very strong incentives to campaign. This pattern of activity has enabled the debate to be misleadingly framed in the media in terms of local objections versus national economic benefits.
  • Policymakers have strong incentives to ‘buy off’ opposition along the route at the expense of taxpayers, for example by increasing the amount of tunnelling or diverting the line. The large scale of HS2, its high political salience and its potential electoral importance, increase the risk that budgets will be expanded.
  • Local authorities, transport bureaucracies and business groups are already lobbying central government to fund new infrastructure along the route, with several schemes already identified. HS2 will trigger billions of pounds of additional expenditure on commercially loss-making, taxpayer-funded projects.
  • Along with design changes to ‘buy off’ opposition and subsidised regeneration projects, these proposals threaten to push total spending far beyond the basic budget. £80 billion plus is a plausible estimate of the overall cost, if these extras and the trains are included.
  • In addition to the direct costs, there will be even larger opportunity costs from the misallocation of transport investment. Institutional reform is needed to reduce the malign influence of rent-seeking special interests on transport policy. New infrastructure could then be provided on a more economically rational basis.

California is undertaking a similar scale high-speed rail project to connect Los Angeles and San Francisco. Elon Musk, founder of Tesla and SpaceX, has proposed an alternative Hyperloop solution that would transport travellers four times as fast at one-tenth of the cost. Debate still rages over whether the concept is viable, but the fact that alternatives were never adequately explored highlights the dangers inherent in allowing political control of infrastructure spending.

Unless adequate safeguards are in place to minimize political interference and adhere to market-related rates of return on investment, taxpayer funds are likely to be wasted on gigantic projects that are an ongoing burden on the fiscal budget.

Why is Australia paying Japanese prices for natural gas?

Australian-born chairman and CEO of the Dow Chemical Company, Andrew Liveris, talks with Alan Kohler on ABC Inside Business about the US fiscal cliff and why Australia needs a cohesive energy policy.

“We have to create an infrastructure such that we can have gas-on-gas on competition domestically. If you build the infrastructure, and private sector can do it, and allow shared pipelines, if you build it you will get a domestic gas system and a pricing system that defies the oil gas parity pricing that countries like Australia should never have. If you have the resource in your country, you shouldn’t be paying the highest alternative price of the country that doesn’t have the resource. Why are we paying Japan energy prices when we have domestic gases?”