It’s a funny kind of bear market

The US economy continues to show signs of robust good health.

Total hours worked are rising, signaling healthy real GDP growth.

Real GDP and Total Hours Worked

Growth in average hourly wage rates is rising, reflecting a tighter labor market. Underlying inflationary pressures may be rising but the Fed seems comfortable that this is containable.

Average Hourly Wage Rates

The Leading Index from the Philadelphia Fed maintains a healthy margin above 1.0% (below 1% is normally a signal that the economy is slowing).

Leading Index

But market volatility remains high, with S&P 500 Volatility (21-day) above 2.0%. A trough above 1% on the next multi-week rally would confirm a bear market — as would an index retracement that respects 2600.

S&P 500

The Nasdaq 100 is undergoing a similar retracement with resistance at 6500.

Nasdaq 100

The primary disturbance is the trade confrontation between the US and China. There is plenty of positive spin from both sides but I expect trade negotiations to drag out over several years — if they are successful. If not, even longer.

I keep a close watch on the big five tech stocks as a barometer of how the broader market will be affected. So far the results are mixed.

Apple is most vulnerable, with roughly 25% of projected sales to China. Recent downward revision of their sales outlook warns that Chinese retail sales are falling. AAPL is testing its primary support level at 150.

ASX 200

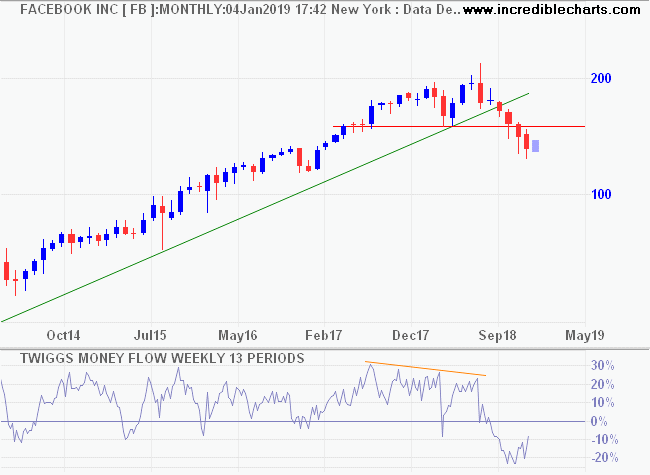
Facebook and Alphabet are largely unaffected by a Chinese slowdown, but have separate issues with user privacy. Facebook (FB) is in a primary down-trend.
ASX 200

While Alphabet (GOOGL) is testing primary support at 1000.

ASX 200

Amazon (AMZN) is similarly isolated from a Chinese slow-down although there may be a secondary impact on suppliers. Primary support at 1300 is likely to hold.

ASX 200

Microsoft (MSFT) is the strongest performer of the five. Their segment reporting does not provide details of exposure to China but it appears to be a small percentage of total sales.

ASX 200

The outlook for stocks is therefore mixed. Be cautious but try to avoid a bearish mindset, where you only see problems and not the opportunities. Even if China does suffer a serious slowdown we can expect massive stimulus similar to 2008 – 2009, so the impact on developing markets and resources markets may be cushioned.

Best wishes for the New Year.

Buckley’s chance that rate hikes will slow

Average hourly wage rates are rising, with Production & Non-Supervisory Employees growing at an annual rate of 3.20% and All Employees at 3.14%.

Average Hourly Wage Rate

This is a clear warning to the Fed that underlying inflationary pressures are rising. There is Buckley’s chance* that they will ease off on rate hikes.

The Fed adopts a restrictive stance whenever hourly wage rate growth exceeds 3%, illustrated below by a high or rising Fed Funds Rate.

Average Hourly Wage Rate

The market is adopting a wait-and-see attitude ahead of Tuesday’s mid-term elections. Stocks like Apple (AAPL) have been sold down on strong volume despite good earnings results: earnings per share of $2.91 and revenue of $62.9 billion for Q4-18, compared to consensus estimates of $2.79 and $61.5 billion.

Apple

Optimism over a possible trade deal with China may not last the week.

A harami-like candle on the S&P 500 reflects indecision, while bearish divergence on Twiggs Money Flow warns of long-term selling pressure. Breach of 2550 is still unlikely but would warn of a primary down-trend.

S&P 500

The Nasdaq 100 tells a similar story, with primary support at 6300.

Nasdaq 100

* William Buckley was an English convict transported to Australia. He escaped when the ships laid anchor in Port Phillip Bay in 1803. The nearest permanent settlement, Sydney, was more than 1000 km away and, considered to have no chance of survival, he was given up for dead. Thirty-two years later, having lived among the Wathaurung Aboriginal people, he emerged from the bush when a settlement was established at Port Phillip in 1835. “Buckley’s chance” is an Australian colloquialism meaning having no chance at all.

Apple AAPL correction

Apple with its massive market capitalization holds significant sway over the Nasdaq 100. Its monthly chart reflects a strong bull trend, with 63-day Twiggs Momentum holding above zero since early 2009, before a massive 50%+ gain over the last 3 months. Bearish divergence on 13-week Twiggs Money Flow warned of strong resistance and the stock is now signaling a correction.
Apple Monthly Chart

Are we going to see a short correction followed by another surge, or is this a full-blown correction back to the long-term rising trendline?  The daily chart already shows a bullish hammer candlestick, hinting at reversal.

Apple Daily Chart

When we break the day down into 30 minute candles, however, we can see retracement encountered a new resistance level at $575. Breakout would indicate a rally to $600, but not necessarily the end of the correction, while reversal below support at $568/$570 would signal another decline and test the lower trend channel around $550.

Apple 30 Minute Candlesticks