Allianz SE (ALIZF)

30 June 2026

Allianz SE (ALIZF.OTC) provides property-casualty insurance, life/health insurance, and asset management products and services worldwide.

The company’s Property-Casualty segment offers motor liability, accident, fire and property, general liability, credit, and travel insurance, as well as assistance services, to private and corporate customers.

Its Life/Health segment provides a range of life and health insurance products on an individual and group basis, including annuities, endowment and term insurance, unit-linked and investment-oriented products, private and supplemental health, and long-term care insurance.

The Asset Management segment offers institutional and retail asset management products and services to third-party investors, comprising equity and fixed-income funds, cash, and multi-asset funds, and alternative investment products, including real estate, infrastructure debt/equity, real assets, liquid alternatives, and solutions business. In addition, it provides banking services for retail clients and digital investment services.

Allianz SE was founded in 1890 as a transport and accident insurance firm by Carl von Thieme and Wilhelm von Finck, the founders of Munich Re (MURGY). It expanded into Europe and North America, was listed in Berlin, and added the life business in the 1920s. After World War II, Allianz lost its foreign business and was forced to relocate its head office to Munich. It set about reacquiring its foreign interests, starting with Austria, and became the largest European insurer during the postwar boom.

Market Position

Customers in the insurance business tend to shop around based on price, and insurers have limited pricing power. Return on invested capital (ROIC) at 15.9% is not in the league of Progressive (30.3%), but is close to Zurich Insurance AG (ZURVY) at 16.7%, and well above Sun Life (SLF) at 10.5%, Berkshire Hathaway (BRK.A) at 9.3%, AXA (AXAHF) at 6.7%, and Swiss Life (SWSDF) at 6.1%.

Growth & Earnings

ALIZF has demonstrated strong revenue and earnings growth over the past 3 years, averaging 25.9% and 21.4%, respectively, and trades at a reasonable forward P/E of 13.3x earnings.

Profit margins weakened during the COVID-19 pandemic, but have since rebounded to new highs.

Allianz (ALIZF) Revenue & Profit Margins

Financial Position

The company’s Debt-Equity ratio is reasonable at 0.53, and it generates healthy free cash flow.

Allianz (ALIZF) Debt-Equity Ratio & Book Value per share

Dividends

Allianz’s forward dividend yield is respectable at 4.4%, and dividend growth since 2016 has averaged 8.4%. Using the Gordon Growth Model, we combine the two for a total projected return of 12.8%.

Allianz (ALIZF) EPS & Dividends

Chart

Allianz (ALIZF) is in a long-term uptrend on the monthly chart, holding above its 12-month weighted moving average. The stock has consolidated between 400 and 450 over the past 14 months, and a breakout above 450 would signal another advance. The Trend Index has declined during the consolidation, and an upturn would reinforce a buy signal.

Allianz SE (ALIZF) Monthly Chart

Recommendation: BUY

We recommend ALIZF as a long-term addition to the PVT portfolio.

Acknowledgements

Fundamental data is from Morningstar.

Australian Growth: Performance Jul-2023

Australian Growth portfolio performance since inception on 1 July 2018 is set out below. We expect to hold most growth stocks for 5 to 10 years.
Australian Growth Annualized Performance 1-Jul-2018 to 31-Jul-2023: Portfolio 3.92%, ASX 200 Accumulation Index 7.69%

Individual Stocks

[Content protected for Premium, Australian Growth members only]

Past Performance

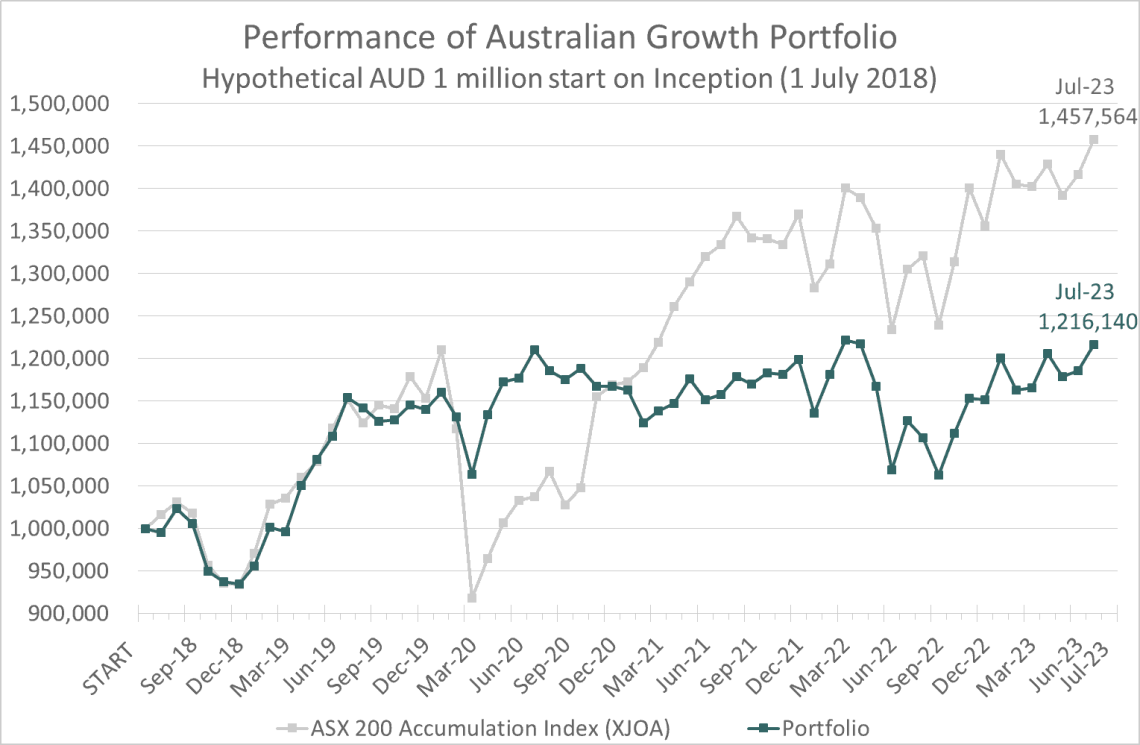
Hypothetical $1 million invested in the Australian Growth portfolio on 1 July 2018:

Hypothetical AUD 1 million invested on 1-Jul-2018 would have grown to 1.22 million by 31-Jul-23, compared to the ASX 200 Accumulation Index (XJOA) which would have grown to 1.46 million.

Performance Notes:

  • Performance is calculated in Australian Dollars.
  • Annualized performance is calculated using the CAGR formula.
  • Returns are calculated after brokerage costs but excludes all other fees and charges.
  • Franking credits are excluded from return calculations.
  • Not all stocks have equal weighting nor held for the full period.
  • Past performance is not a guarantee of future performance.

Portfolio Allocation

The graph below reflects current portfolio allocation:

Australian Growth Current Allocation

For a detailed discussion of target sectors see Changes to Australian portfolio allocation.

Past Allocations

Allocations have evolved over time to deal with elevated market risk, over-priced sectors, and opportunities in cyclicals:

Australian Growth Past Allocations

International Growth: Performance Jul-2023

International Growth portfolio performance since inception on July 1, 2018 is set out below. We expect to hold most growth stocks for 5 to 10 years.

International Growth Annualized Performance July 1, 2018 to July 31, 2023: Portfolio 9.65%, S&P 500 Total Return Index 12.9%

And in Australian Dollars:

International Growth in AUD Annualized Performance July 1, 2018 to July 31, 2023: Portfolio 11.72%, S&P 500 Total Return Index 15.04%

Performance of Individual Stocks

[Content protected for Premium, International Growth members only]

Past Performance

Hypothetical $1 million invested in the International Growth portfolio on July 1, 2018, calculated in US Dollars:

Hypothetical USD 1 million invested on July 1, 2018 would have grown to 1.6 million by July 31, 2023, compared to the S&P 500 Total Return Index (SPXT) which would have grown to 1.85 million.

Converted to Australian Dollars (on a month-end basis):

Hypothetical AUD 1.35 million (equivalent of USD 1 million) invested on July 1, 2018 would have grown to 2.38 million by July 31, 2023, compared to the S&P 500 Total Return Index (SPXT) which would have grown to 2.76 million.

Performance Notes:

  • Performance is calculated in US Dollars except where otherwise stated.
  • Annualized performance is calculated using the CAGR formula.
  • Returns are calculated after brokerage costs but exclude all other fees and charges.
  • Not all stocks have equal weighting nor held for the full period.
  • Past performance is not a guarantee of future performance.

Portfolio Allocation

The graph below reflects current portfolio allocation:

International Growth Current Allocation

For a detailed discussion of target sectors see Changes to International portfolio allocation.

Past Allocations

Allocations have evolved over time to deal with elevated market risk, over-priced sectors, and opportunities in cyclicals:

International Growth Past Allocations

International Growth: Performance Jun-2023

International Growth portfolio performance since inception on July 1, 2018 is set out below. We expect to hold most growth stocks for 5 to 10 years.

International Growth Annualized Performance July 1, 2018 to June 30, 2023: Portfolio 9.63%, S&P 500 Total Return Index 12.42%

And in Australian Dollars:

International Growth in AUD Annualized Performance July 1, 2018 to June 30, 2023: Portfolio 11.93%, S&P 500 Total Return Index 14.77%

Performance of Individual Stocks

[Content protected for Premium, International Growth members only]

Past Performance

Hypothetical $1 million invested in the International Growth portfolio on July 1, 2018, calculated in US Dollars:

Hypothetical USD 1 million invested on July 1, 2018 would have grown to 1.58 million by June 30, 2023, compared to the S&P 500 Total Return Index (SPXT) which would have grown to 1.8 million.

Converted to Australian Dollars (on a month-end basis):

Hypothetical AUD 1.35 million (equivalent of USD 1 million) invested on July 1, 2018 would have grown to 2.38 million by June 30, 2023, compared to the S&P 500 Total Return Index (SPXT) which would have grown to 2.69 million.

Performance Notes:

  • Performance is calculated in US Dollars except where otherwise stated.
  • Annualized performance is calculated using the CAGR formula.
  • Returns are calculated after brokerage costs but exclude all other fees and charges.
  • Not all stocks have equal weighting nor held for the full period.
  • Past performance is not a guarantee of future performance.

Portfolio Allocation

The graph below reflects current portfolio allocation:

International Growth Current Allocation

For a detailed discussion of target sectors see Changes to International portfolio allocation.

Past Allocations

Allocations have evolved over time to deal with elevated market risk, over-priced sectors, and opportunities in cyclicals:

International Growth Past Allocations

Australian Growth: Performance Jun-2023

Australian Growth portfolio performance since inception on 1 July 2018 is set out below. We expect to hold most growth stocks for 5 to 10 years.

Australian Growth Annualized Performance 1-Jul-2018 to 30-Jun-2023: Portfolio 3.47%, ASX 200 Accumulation Index 7.22%

Individual Stocks

[Content protected for Premium, Australian Growth members only]

Past Performance

Hypothetical $1 million invested in the Australian Growth portfolio on 1 July 2018:

Hypothetical AUD 1 million invested on 1-Jul-2018 would have grown to 1.19 million by 30-Jun-23, compared to the ASX 200 Accumulation Index (XJOA) which would have grown to 1.42 million.

Performance Notes:

  • Performance is calculated in Australian Dollars.
  • Annualized performance is calculated using the CAGR formula.
  • Returns are calculated after brokerage costs but excludes all other fees and charges.
  • Franking credits are excluded from return calculations.
  • Not all stocks have equal weighting nor held for the full period.
  • Past performance is not a guarantee of future performance.

Portfolio Allocation

The graph below reflects current portfolio allocation:

Australian Growth Current Allocation

For a detailed discussion of target sectors see Changes to Australian portfolio allocation.

Past Allocations

Allocations have evolved over time to deal with elevated market risk, over-priced sectors, and opportunities in cyclicals:

Australian Growth Past Allocations

International Growth: Performance May-2023

International Growth portfolio performance since inception on July 1, 2018 is set out below. We expect to hold most growth stocks for 5 to 10 years.

International Growth Annualized Performance July 1, 2018 to May 31, 2023: Portfolio 8.3%, S&P 500 Total Return Index 11.18%

And in Australian Dollars:

International Growth in AUD Annualized Performance July 1, 2018 to May 31, 2023: Portfolio 11.16%, S&P 500 Total Return Index 14.12%

Performance of Individual Stocks

[Content protected for Premium, International Growth members only]

Past Performance

Hypothetical $1 million invested in the International Growth portfolio on July 1, 2018, calculated in US Dollars:

Hypothetical USD 1 million invested on July 1, 2018 would have grown to 1.48 million by May 31, 2023, compared to the S&P 500 Total Return Index (SPXT) which would have grown to 1.68 million.

Converted to Australian Dollars (on a month-end basis):

Hypothetical AUD 1.35 million (equivalent of USD 1 million) invested on July 1, 2018 would have grown to 2.28 million by May 31, 2023, compared to the S&P 500 Total Return Index (SPXT) which would have grown to 2.59 million.

Performance Notes:

  • Performance is calculated in US Dollars except where otherwise stated.
  • Annualized performance is calculated using the CAGR formula.
  • Returns are calculated after brokerage costs but exclude all other fees and charges.
  • Not all stocks have equal weighting nor held for the full period.
  • Past performance is not a guarantee of future performance.

Portfolio Allocation

The graph below reflects current portfolio allocation:

International Growth Current Allocation

For a detailed discussion of target sectors see Changes to International portfolio allocation.

Past Allocations

Allocations have evolved over time to deal with elevated market risk, over-priced sectors, and opportunities in cyclicals:

International Growth Past Allocations

Australian Growth: Performance May-2023

Australian Growth portfolio performance since inception on 1 July 2018 is set out below. We expect to hold most growth stocks for 5 to 10 years.

Australian Growth Annualized Performance 1-Jul-2018 to 31-May-2023: Portfolio 3.39%, ASX 200 Accumulation Index 6.96%

Individual Stocks

[Content protected for Premium, Australian Growth members only]

Past Performance

Hypothetical $1 million invested in the Australian Growth portfolio on 1 July 2018:

Hypothetical AUD 1 million invested on 1-Jul-2018 would have grown to 1.18 million by 31-May-23, compared to the ASX 200 Accumulation Index (XJOA) which would have grown to 1.39 million.

Performance Notes:

  • Performance is calculated in Australian Dollars.
  • Annualized performance is calculated using the CAGR formula.
  • Returns are calculated after brokerage costs but excludes all other fees and charges.
  • Franking credits are excluded from return calculations.
  • Not all stocks have equal weighting nor held for the full period.
  • Past performance is not a guarantee of future performance.

Portfolio Allocation

The graph below reflects current portfolio allocation:

Australian Growth Current Allocation

For a detailed discussion of target sectors see Changes to Australian portfolio allocation.

Past Allocations

Allocations have evolved over time to deal with elevated market risk, over-priced sectors, and opportunities in cyclicals:

Australian Growth Past Allocations

Australian Growth: Performance Apr-2023

Australian Growth portfolio performance since inception on July 1, 2018 is set out below. We expect to hold most growth stocks for 5 to 10 years.

Australian Growth Annualized Performance 1-Jul-2018 to 30-Apr-2023: Portfolio 3.94%, ASX 200 Accumulation Index 7.66%

Individual Stocks

[Content protected for Premium, Australian Growth members only]

Past Performance

Hypothetical $1 million invested in the Australian Growth portfolio on July 1, 2018:

Hypothetical AUD 1 million invested on July 1, 2018 would have grown to 1.21 million by April 30, 2023, compared to the ASX 200 Accumulation Index (XJOA) which would have grown to 1.43 million.

Performance Notes:

  • Performance is calculated in Australian Dollars.
  • Annualized performance is calculated using the CAGR formula.
  • Returns are calculated after brokerage costs but excludes all other fees and charges.
  • Franking credits are excluded from return calculations.
  • Not all stocks have equal weighting nor held for the full period.
  • Past performance is not a guarantee of future performance.

Portfolio Allocation

Current portfolio allocation differs from our target allocation due to medium-term technical trends and over-pricing in targeted sectors. For further details see Changes to Australian portfolio allocation.

Current Allocation

The graph below reflects current portfolio allocation:

Australian Growth Current Allocation

Past Allocations

Allocations have evolved over time to deal with elevated market risk, over-priced sectors, and opportunities in cyclicals:

Australian Growth Past Allocations

International Growth: Performance Apr-2023

International Growth portfolio performance since inception on July 1, 2018 is set out below. We expect to hold most growth stocks for 5 to 10 years.

International Growth Annualized Performance 1-Jul-2018 to 30-Apr-2023: Portfolio 8.45%, S&P 500 Total Return Index 11.29%

And in Australian Dollars:

International Growth in AUD Annualized Performance 1-Jul-2018 to 30-Apr-2023: Portfolio 10.97%, S&P 500 Total Return Index 13.88%

Performance of Individual Stocks

[Content protected for Premium, International Growth members only]

Past Performance

Hypothetical $1 million invested in the International Growth portfolio on July 1, 2018, calculated in US Dollars:

Hypothetical USD 1 million invested on July 1, 2018 would have grown to 1.48 million by April 30, 2023, compared to the S&P 500 Total Return Index (SPXT) which would have grown to 1.68 million.

Converted to Australian Dollars (on a month-end basis):

Hypothetical AUD 1.35 million (equivalent of USD 1 million) invested on July 1, 2018 would have grown to 2.24 million by April 30, 2023, compared to the S&P 500 Total Return Index (SPXT) which would have grown to 2.54 million.

Performance Notes:

  • Performance is calculated in US Dollars except where otherwise stated.
  • Annualized performance is calculated using the CAGR formula.
  • Returns are calculated after brokerage costs but exclude all other fees and charges.
  • Not all stocks have equal weighting nor held for the full period.
  • Past performance is not a guarantee of future performance.

Portfolio Allocation

Current portfolio allocation differs from our target allocation due to medium-term technical trends and over-pricing in targeted sectors. For further details see Changes to International portfolio allocation.

Allocations Changed Apr-2023

We have revised the allocation of some stocks held in the model portfolio. These changes have been applied to the current and past allocations below.

[Content protected for Premium, International Growth members only]

Current Allocation

The graph below reflects current portfolio allocation:

International Growth Current Allocation

Past Allocations

Allocations have evolved over time to deal with elevated market risk, over-priced sectors, and opportunities in cyclicals:

International Growth Past Allocations

International Growth: Performance Mar-2023

International Growth portfolio performance since inception on July 1, 2018 is set out below. We expect to hold most growth stocks for 5 to 10 years.

International Growth Annualized Performance 1-Jul-2018 to 31-Mar-2023: Portfolio 8.96%, S&P 500 Total Return Index 11.13%

And in Australian Dollars:

International Growth in AUD Annualized Performance 1-Jul-2018 to 31-Mar-2023: Portfolio 11.29%, S&P 500 Total Return Index 13.5%

Performance of Individual Stocks

[Content protected for Premium, International Growth members only]

Past Performance

Hypothetical $1 million invested in the International Growth portfolio on July 1, 2018, calculated in US Dollars:

Hypothetical USD 1 million invested on July 1, 2018 would have grown to 1.5 million by March 31, 2023, compared to the S&P 500 Total Return Index (SPXT) which would have grown to 1.65 million.

Converted to Australian Dollars (on a month-end basis):

Hypothetical AUD 1.35 million (equivalent of USD 1 million) invested on July 1, 2018 would have grown to 2.25 million by March 31, 2023, compared to the S&P 500 Total Return Index (SPXT) which would have grown to 2.47 million.

Performance Notes:

  • Performance is calculated in US Dollars except where otherwise stated.
  • Annualized performance is calculated using the CAGR formula.
  • Returns are calculated after brokerage costs but exclude all other fees and charges.
  • Not all stocks have equal weighting nor held for the full period.
  • Past performance is not a guarantee of future performance.

Portfolio Allocation

Current portfolio allocation differs considerably from our target allocation, set as a long-term aspirational goal, due to elevated market risk, over-priced sectors, and opportunities in cyclicals (including gold and precious metals).

Current Allocation

The graph below reflects current portfolio allocation:

International Growth Current Allocation

Past Allocations

Allocations have evolved over time to deal with elevated market risk, over-priced sectors, and opportunities in cyclicals:

International Growth Past Allocations