
Australian Growth portfolio performance since inception on 1 July 2018 is set out below. We expect to hold most growth stocks for 5 to 10 years.

Individual Stocks
[Content protected for Premium, Australian Growth members only]Past Performance
Hypothetical $1 million invested in the Australian Growth portfolio on 1 July 2018:
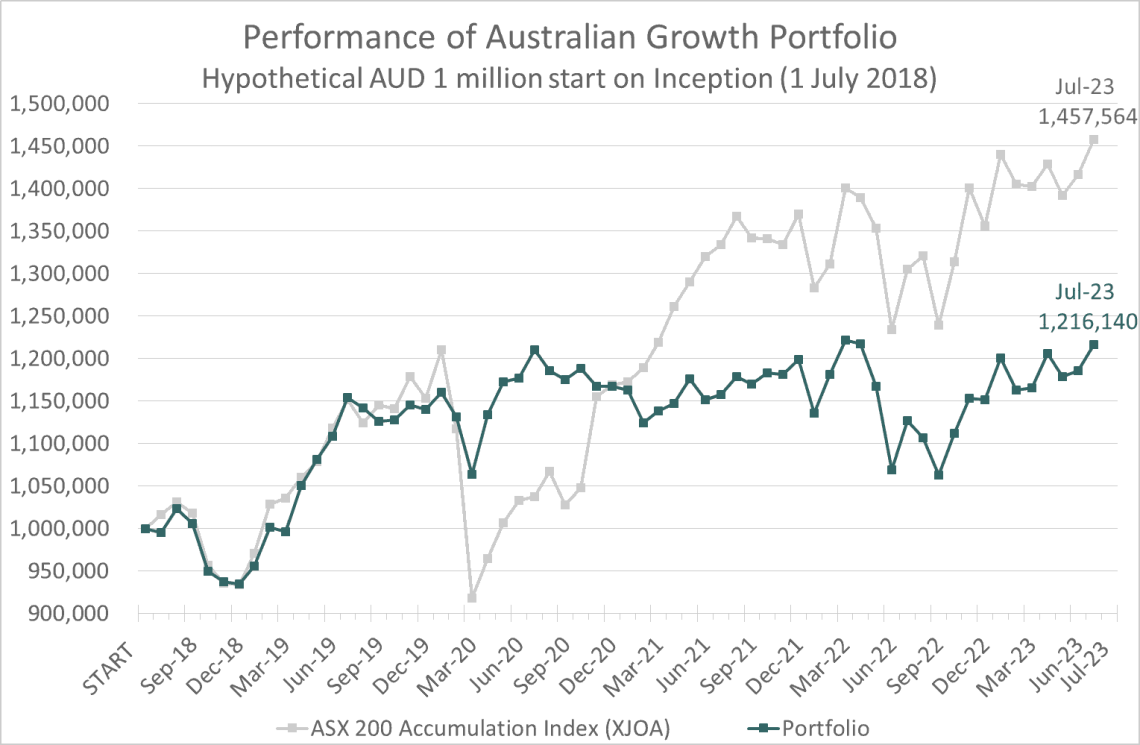
Performance Notes:
- Performance is calculated in Australian Dollars.
- Annualized performance is calculated using the CAGR formula.
- Returns are calculated after brokerage costs but excludes all other fees and charges.
- Franking credits are excluded from return calculations.
- Not all stocks have equal weighting nor held for the full period.
- Past performance is not a guarantee of future performance.
Portfolio Allocation
The graph below reflects current portfolio allocation:

For a detailed discussion of target sectors see Changes to Australian portfolio allocation.
Past Allocations
Allocations have evolved over time to deal with elevated market risk, over-priced sectors, and opportunities in cyclicals:

You must be logged in to post a comment.