Moody’s negative outlook and falling consumer sentiment

Ten-year Treasury yields continue to respect support at 4.50%. We expect another test of resistance at 5.0%.

10-Year Treasury Yield

Moody’s kept their AAA rating for the US government but changed their outlook from stable to negative. The reasons cited  — large deficits and a polarized ineffective Congress — are strong arguments for higher Treasury yields:

Moody's Rating

Japan has also broken above 150 yen to the Dollar, increasing pressure on the BoJ to relax their cap on long-term JGB yields. Any move to relax yield curve control would be likely to cause an outflow from US Treasuries and the Dollar, driving down prices.

USDJPY

Inflation

Inflation expectations are rising, with University of Michigan 1-year expectations jumping to 4.4% — and the 3-month moving average to 3.9%.

University of Michigan Inflation expectations 1-Year

Five-year expectations are also rising, reaching 3.2% in October, with the 3-month moving average at 3.0%.

University of Michigan Inflation expectations 5-Year

Higher inflation expectations add to upward pressure on long-term yields.

Financial Conditions

Financial conditions remain loose — despite the strong rise in long-term yields — with the spread between Baa corporate bonds and the equivalent Treasury yield at a low 1.84%.
Moody's Baa Corporate Bond Spreads

Economic Outlook

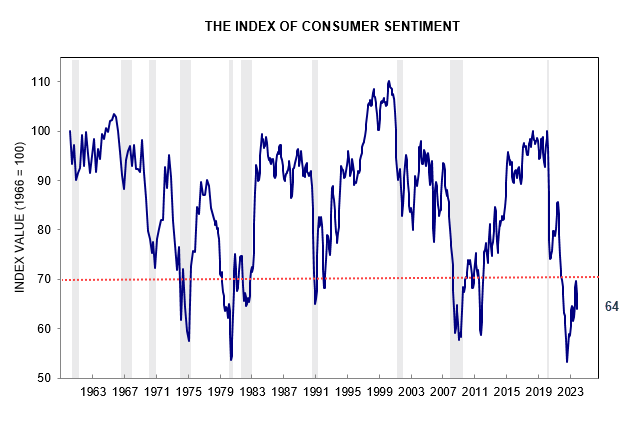
Low consumer sentiment, with the University of Michigan Index at 64, continues to warn of a recession.
University of Michigan Consumer Sentiment

Heavy truck sales — a reliable leading indicator — are falling steeply. A fall below 35,000 units would be cause for concern.

Heavy Truck Sales

Stocks

The S&P 500 ended the week stronger, with a bullish candle testing resistance at 4400.

S&P 500

Small caps continue to warn of weakness, however, with the Russell 2000 iShares ETF (IWM) likely to test primary support at 162. Trend Index peaks below zero warn of strong selling pressure. Small caps tend to outperform large caps by a wide margin in the first phase of a bull market — clearly not the case here.

Russell 2000 Small Caps iShares ETF (IWM)

Global Economy

Copper is retracing for another test of primary support at $7800 per metric ton. Breach would warn of a global recession.

Copper

Gold

Gold broke support at $1900 per ounce, indicating a test of $1900. Rising long-term interest rates are undermining investor demand for Gold.

Spot Gold

But Gold is supported by strong central bank purchases, led by China.

Central Bank Gold Purchases & Sales

Australia

The ASX 200 retreated below 7000 on Friday but a bullish close on the S&P 500 should see retracement to test resistance. Declining Trend index peaks, however, warn of rising selling pressure.

ASX 200

Conclusion

We expect upward pressure on long-term Treasury yields to continue, boosted by Moody’s negative outlook for the US, a weakening Japanese Yen and rising inflation expectations.

Declining heavy truck sales and weak consumer sentiment are bearish for the economy. The S&P 500 remains bullish but small caps are more bearish, warning that this is not a broad-based recovery.

Copper breach of $7800 per metric ton would warn of a global recession.

We remain overweight cash, money market funds, short-duration term deposits and financial securities (up to 12 months), defensive stocks, critical materials and gold.

Acknowledgements

The Big Picture: War, Energy, Bonds and Gold

Two inter-connected themes likely to dominate the next few decades are War and Energy.

War may take the form of a geopolitical struggle between opposing ideologies, with conventional wars limited to proxies in most cases and nuclear exchanges avoided because the costs are prohibitive. But it is likely to involve fierce competition for energy and resources in an attempt to undermine opposing economies. The impact is likely to be felt throughout the global economy and across all asset classes, including bonds, stocks and precious metals.

War

War can take many forms: conventional war, nuclear war, proxy war, cold war,  economic war, or some combination of the above.

Nuclear war can hopefully be avoided, with sane leaders skirting mutually assured destruction (MAD). For that reason, even conventional war between great powers is unlikely — but there is a risk of it being triggered by escalation in a war between proxies.

Cold war, with limited trade between opposing powers — as in the days of Churchill’s Iron Curtain — is also unlikely. Global economic interdependence is far higher than sixty years ago.

Greg Hayes, chief executive of Raytheon, said the company had “several thousand suppliers in China and decoupling . . . is impossible”. “We can de-risk but not decouple,” Hayes told the Financial Times in an interview, adding that he believed this to be the case “for everybody”.

“Think about the $500bn of trade that goes from China to the US every year. More than 95 per cent of rare earth materials or metals come from, or are processed in, China. There is no alternative,” said Hayes. “If we had to pull out of China, it would take us many, many years to re-establish that capability either domestically or in other friendly countries.”

What is likely is a struggle for geopolitical advantage between opposing alliances, with economic war, proxy wars, and attempts to build spheres of influence. This includes enticing (or coercing) non-aligned nations such as India to join one of the sides.

Such a geopolitical arm-wrestle is likely to have ramifications in many different spheres, but most of all energy.

Energy

You can’t fight a war without energy. A key element of the geopolitical tussle will be to secure adequate supplies of energy — and to deprive the opposing side of the same.

The situation is further complicated by the attempted transition from fossil fuels to low-carbon energy sources.

Since the Industrial revolution, development of the global economy has been fueled by energy from fossil fuels, with GDP and fossil fuel consumption growing exponentially. Gradual transition to alternative energy sources would be a big ask. To attempt a rapid transition while in the midst of geopolitical conflict could end in disaster.

Global Energy Sources

The challenge is further complicated by attempts to replace fossil fuels with wind and solar which generate intermittent power. Base-load power — generated from fossil fuels or nuclear — is essential for many industries. Microsoft are investigating the use of nuclear to power data centers. The US Department of Defense (DoD) has commissioned Oklo Inc. to design and build a nuclear micro-reactor to power Eielson Air Force Base in Alaska. Renewables are a poor option for critical applications.

Russia’s 2022 invasion of Ukraine highlighted Germany’s energy vulnerability despite billions of Euros invested in renewables over recent decades. You cannot run a modern industrialized economy without reliable energy sources.

Low investment in fossil fuel resources — which fail to meet ESG standards — has further increased global vulnerability to energy shortages during the transition.

Inflation

War and pandemics cause high inflation. Governments run large deficits during times of crisis, funded by central bank purchases in the absence of other investors. This causes rapid expansion of the money supply, leading to high inflation.

Geopolitical conflict and the attempt to rapidly transition to carbon-free fuels — while neglecting existing resources — are both likely to cause a steep rise in energy costs.

Energy Prices

Bond Market

The bond market has the final say. The recent steep rise in long-term Treasury yields is the bond market’s assessment of fiscal management in the US. The deeply divided House of Representatives has effectively been awarded an “F” on its economic report card.

10-Year Treasury Yield

Failure of a divided government to address fiscal debt at precarious levels and rein in ballooning deficits raises a question mark over future stability, with the bond market demanding a premium on long-term issues.

The rating downgrade of the United States reflects the expected fiscal deterioration over the next three years, a high and growing general government debt burden, and the erosion of governance relative to ‘AA’ and ‘AAA’ rated peers over the last two decades that has manifested in repeated debt limit standoffs and last-minute resolutions. (Fitch Ratings)

CBO projections show federal debt held by the public rising from 98% of GDP today to 181% in thirty years time.

CBO Debt Projections

Rising long-term yields also add to deficits as servicing costs on existing debt increase over time. The actual curve is likely to be even steeper. CBO projections assume an average interest rate of 2.5%, while current rates are close to 5.0%.

Yield Curve

Continuing large fiscal deficits in the next few decades appear unavoidable. The result is likely to be massive central bank purchases of fiscal debt — as in previous wars/pandemics — with negative real interest rates (red circles below) driving higher inflation (blue) and rising inequality.

Moody's Aaa Corporate Bond Yield & CPI

Political instability

Interest rate suppression effectively subsidizes borrowers at the expense of savers. Only the wealthy are able to leverage their large balance sheets, buying real assets while borrowing at negative real interest rates. Those less fortunate have limited access to credit and suffer the worst consequences of inflation, further accentuating the division in society and fostering political instability as populism soars.

Commodities

Resources are likely to be in short supply, from under-investment during the pandemic, geopolitical competition, and the attempted rapid transition to new energy sources. Prices are still likely to fall if global demand shrinks during a recession. But growing demand, shrinking supply (from past under-investment) and inflation pushing up production costs are expected to lead to a long-term secular up-trend.

Copper

Gold

High inflation, negative real interest rates and geopolitical competition are likely to weaken the Dollar, strengthening demand for Gold as a safe haven and inflation hedge. Breakout above $2000 per ounce would offer a long-term target of $3000.

Spot Gold

Conclusion

We expect large government deficits and shortages of energy and critical materials — such as Lithium and Copper — the result of a geopolitical struggle and attempt to transition to low-carbon energy sources over several decades.

Rising government debt will necessitate central bank purchases as the bond market drives up yields in the absence of foreign buyers. The likely result will be high inflation and interest rate suppression as central banks and government attempt to manage soaring debt levels and servicing costs.

Our strategy is to be overweight commodities, especially critical materials required for the transition to low-carbon fuel sources; short-term bonds and term deposits; and defensive (value) stocks.

We are also overweight energy, including: heavy electrical; nuclear technology; uranium; and oil & gas resources.

Gold is more complicated. Rising long-term interest rates will weaken demand for Gold, while geopolitical turmoil will strengthen demand, causing a see-sawing market with high volatility. If long-term yields fall — due to central bank purchases of US Treasuries — expect high inflation. That would be a signal to load up on Gold.

We are underweight growth stocks and real estate. Rising long-term interest rates are expected to lower earnings multiples, causing falling prices. Collapsing long-term yields due to central bank purchases of USTs, however, would cause negative real interest rates. A signal to overweight real assets such as growth stocks and real estate.

Long-term bonds are plunging in value as long-term yields rise, with iShares 20+ Year Treasury ETF (TLT) having lost almost 50% since early 2020.

iShares 20+ Year Treasury ETF

The trend is expected to reverse when Treasury yields peak but timing the reversal is going to be difficult.

Acknowledgements

Copper breaks support while crude gets hammered

Copper broke support at $7900/tonne, signaling a primary decline with a target of its 2022 low at $7000. The primary down-trend warns of a global economic contraction.

Copper

The bear signal has yet to be confirmed by the broader-based Dow Jones Industrial Metals Index ($BIM) which is testing primary support at 155.

DJ Industrial Metals Index ($BIM)

Crude oil

Crude fell sharply this week, after a 3-month rally.

Nymex Light Crude

The fall was spurred by an early build of gasoline stocks ahead of winter, raising concerns of declining demand.

Gasoline inventories added a substantial 6.5 million barrels for the week to September 29, compared with a build of 1 million barrels for the previous week. Gasoline inventories are now 1% above the five-year average for this time of year….. production averaged 8.8 million barrels daily last week, which compared with 9.1 million barrels daily for the prior week. (oilprice.com)

Gasoline Stocks

Crude inventories have stabilized after a sharp decline during the release of strategic petroleum reserves (SPR).

EIA Crude Inventory

Releases from the SPR stopped in July — which coincides with the start of the recent crude rally. It will be interesting to see next week if a dip in this week’s SPR contributed to weak crude prices.

Strategic Petroleum Reserves (SPR)

Stocks & Bonds

The 10-year Treasury yield recovered to 4.78% on Friday.

10-Year Treasury Yield

Rising yields are driven by:

  • a large fiscal deficit of close to $2T;
  • commercial banks reducing Treasury holdings; and
  • the Bank of Japan allowing a limited rise in bond yields which could cause an outflow from USTs.

Bank of Japan - YCC

The S&P 500 rallied on the back of a strong labor report.

S&P 500

The S&P 500 Equal-Weighted Index test of primary support at 5600 is, however, likely to continue.

S&P 500 Equal-Weighted Index

Expect another Russell 2000 small caps ETF (IWM) test of primary support at 170 as well.

Russell 2000 Small Caps ETF (IWM)

Labor Market

The BLS report for September, with job gains of 336K, reflects a robust economy and strong labor market.

Job Gains

Average hourly earnings growth slowed to 0.207% in September, or 2.5% annualized. Manufacturing wages reflect higher growth — 4.0% annualized — but that is a small slice of the economy compared to services.

Average Hourly Earnings

Average weekly hours worked — a leading indicator — remains stable at 34.4 hours/week.

Average Weekly Hours

Unemployment remained steady at 6.36 million, while job openings jumped in August, maintaining a sizable shortage.

Job Openings & Unemployment

Real GDP (blue) is expected to slow in Q3 to 1.5%, matching declining growth in aggregate weekly hours worked (purple).

Real GDP & Hours Worked

Dollar & Gold

The Dollar Index retraced to test new support at 106 but is unlikely to reverse course while Treasury yields are rising.

Dollar Index

Gold is testing primary support at $1800 per ounce, while Trend Index troughs below zero warn of selling pressure. Rising long-term Treasury yields and a strong Dollar are likely to weaken demand for Gold.

Spot Gold

Conclusion

Long-term Treasury yields are expected to rise, fueled by strong supply (fiscal deficits) and weak demand (from foreign investors and commercial banks). The outlook for rate cuts from the Fed is also fading as labor market remains tight.

The sharp drop in crude oil seems an overreaction when the labor market is strong and demand is likely to be robust. Further releases from the strategic petroleum reserve (SPR), a sharp fall in Chinese purchases, or an increase in supply (from Iran or Venezuela) seem unlikely at present.

Falling copper prices warn of a global economic contraction led by China, with Europe likely to follow. Confirmation by Dow Jones Industrial Metals Index ($BIM) breach of primary support at 155 would strengthen the bear signal.

Strong Treasury yields and a strong Dollar are likely to weaken demand for Gold unless there is increased instability, either geopolitical or financial.

Nuclear or renewables?

Fossil fuels were the source of 83.7% of energy produced in the USA for the first half of 2023, compared to 7.8% for nuclear and 8.4% for renewables.

US Energy Sources

Take a closer look at renewables and 5.0% of the total comes from biomass — wood and biofuels like ethanol. Solar contributes 0.9% and wind 1.5%, for a total of only 2.4%.

US Energy Sources

The scale required to achieve a tenfold increase in wind and solar is hard to imagine. France, on the other hand, has already demonstrated what can be achieved with nuclear.

France: Nuclear

Uranium

Uranium prices are soaring, with the Sprott Physical Uranium Trust (SRUUF) climbing to a new high since its formation in 2021.

Sprott Physical Uranium Trust (SRUUF)

As John Quakes explained, on the social media site formerly known as Twitter, the shortage is caused by Rosatom buying uranium in Western markets due to sanctions restricting shipping insurance in Russia:

US Energy Sources: Renewables

Conclusion

Nuclear is the only viable option to replace fossil fuels for electricity generation. Renewables such as wind and solar may contribute but nuclear is the only option that can be implemented on such a scale.

Uranium prices are soaring and are likely to remain high for as long as Russia occupies part of Ukraine.

Acknowledgements

Investing in Real Estate

In Monday’s update, we compared investing in stocks to investing in financial securities and concluded that stocks offer better long-term performance. Today, we use long-term data series for US and Australian real estate to evaluate their comparative performance.

US real estate data was sourced from Prof Robert Shiller, who created the Case-Shiller Index series. The chart below shows that US home prices from 1933 to 2023, a period of ninety years, appreciated to 69.5 times their original value.

Home Price Index

Adjusting for inflation, we get real appreciation of 2.9 times.

Again, CPI seems to understate inflation. Comparing the home price index to Gold, rather than CPI, provides a more accurate measure of appreciation in real terms. Gold appreciated 94.5 times over the same period, so the home price index actually lost value.

Calculation: 69.5/94.5 = 0.735 (i.e. a 26.5% loss of value)

Comparing data sources

A second source of home price data compares median prices, based on sales of existing homes, from 1953 to 2023. That shows growth of 22 times over the past seventy years, which is close to the Home Price Index appreciation of 21.25 over the same period.

Median Home Prices, Existing Homes

Australia

Australian housing data is harder to come by but we found an excellent source of long-term median house price data in the 2007 UNSW thesis of Dr Nigel David Stapledon. Using data from within the thesis, we were able to adjust nominal house prices to reflect constant quality (house values with no improvements) below.

Median Home Prices, Existing Homes, Constant Quality

Australian house prices appreciated 191.4 times between 1933 and 2006.

Unfortunately the data ends there, so we had to calculate a weighted average of median houses for 2007 to the present.

CoreLogic kindly provided us with values for their hedonic Home Value Index (for 5 Capital Cities) which also adjusts for quality:

Property Type	31/01/2007	31/07/2023
Houses		$399,182	$891,747

The gain of 2.23 is slightly higher than the 2.14 calculated from weighted average data for the 8 capital cities provided by the ABS.

Median Home Prices, Weighted Average of 8 Capital Cities

We opted for the higher figure from CoreLogic as likely to be more in line with the earlier Stapledon data. That gives a total nominal gain, adjusted for quality, of 426.8 for the ninety years from 1933 to 2023.

The price of Gold fines was fixed at £6-3/9 per troy ounce fine according to the Sydney Morning Herald on 2 January 1933, that converts to 12.375 Australian Dollars. Total gain for Gold in Australian Dollars over the past ninety years is therefore 232.9 times (A$2881.90/12.375).

We calculate the real gain for Australian house prices as 1.83 times over the past ninety years (426.8/232.9).

Conclusion

The US Home Price Index lost 26.5% in real terms, over the past ninety years (1933 – 2023), when compared to Gold.

The S&P 500 appreciated 6.8 times over the past ninety years when measured against Gold, and 9.7 times compared to US real estate (Home Price Index).

Using Gold as the benchmark, we conclude that Australian real estate prices appreciated faster than US real estate over the past ninety years, growing 1.83 times in real terms, whereas the US depreciated to 0.735 of its original real value.

We suspect the difference is largely due to the substantial fall in US real estate values after the 2008 sub-prime crisis, whereas Australian home prices continued to grow. We expect that performance of the two will converge in the long-term.

Lastly, when measured against Gold, US stocks outperformed Australian real estate. The S&P 500 grew 3.7 times against Australian home prices, in real terms, over the past ninety years.

This does not mean that we should ignore real estate as an investment medium. But a portfolio concentrated in real estate, without diversification into stocks and precious metals, could underperform in the long-term.

Acknowledgements

A bi-polar world

There is much talk in the media of a multipolar world, with the split between the West and the BRICS, led by China & Russia. That may be relevant in the long-term but the immediate challenge for investors is a bi-polar world, where some markets are rallying strongly while others are collapsing. Even within the US market, we have some sectors rallying while others are collapsing.

The S&P 500 is still in a bear market but the index has rallied to test resistance between 4200 and 4300. Breakout would confirm the bull signal from 250-day Rate of Change crossing to above zero.

S&P 500

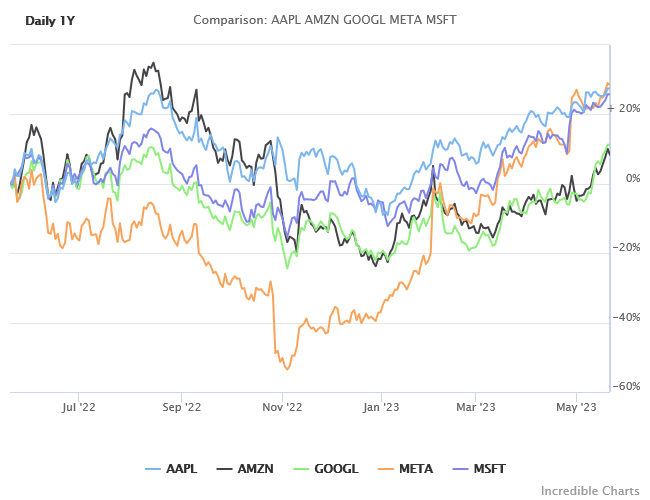
The big 5 technology stocks — Apple, Amazon, Alphabet (GOOGL), Meta Platforms, and Microsoft — have all rallied strongly since the start of 2023.

Big 5 Technology Companies

Volatility is elevated but declining peaks on Twiggs Volatility (21-day) suggest that this is easing.

S&P 500 & Twiggs Volatility

However, the rally is concentrated in big tech stocks, with small caps struggling to hold above support. The Russell 2000 iShares ETF (IWM) is testing the band of support between 164 and 170. Breach of support would signal a second downward leg in the bear market.

Russell 2000 ETF (IWM)

The Treasury yield curve is also inverted, with the ever-reliable 10-Year minus 3-Month spread at its lowest level (-1.49%) since 1981. Recessions tend to only occur after the spread recovers above zero — when the Fed starts cutting short term rates — which tells us that the recession is only likely to arrive in 2024.

Treasury Yield Spread: 10-Year minus 3-Month

The longer than usual lag may be the result of the “pig in the python” — a massive surge in liquidity injected into financial markets during the pandemic.

Commercial Bank Deposits/GDP

We are already seeing cracks in the dyke as liquidity starts to recede. Regional banks are in crisis, caused by the sharp hike in interest rates and the collapse in value of their “most secure” assets. Risk-weighted capital ratios are meaningless when bank investments in Treasury and Agency securities — which enjoy the lowest risk weighting — fall sharply in value. True levels of leverage are exposed and threaten bank solvency.

The S&P Composite 1500 Regional Banks Index ($XPBC) is testing support at 75 after a sharp decline. Not only do regional banks have solvency problems, caused by losses on Treasury and Agency investments, many are also over-exposed to commercial real estate (CRE) which faces a major fall in value, primarily in the office sector as demand for office space shrinks due to the shift to work-from-home after the pandemic.

S&P Composite 1500 Regional Banks Index ($XPBC)

There is always more than one cockroach — as Doug Kass would say — and regional banks are also threatened by a margin squeeze. Short-term rates have surged to higher than long-term rates, pressuring net interest margins. Banks are funded at the short-end and invest (and lend) at the long-end of the yield curve.

The Fed is unlikely to solve the regional bank problem easily, especially with the political impasse in Congress — needed to support any increase in deposit guarantees.

Commodities

Falling commodity prices warn that the global economy is contracting.

Brent crude is in a bear market, testing support at $70 per barrel. But US cude purchases — to re-stock their strategic petroleum reserve (SPR) — may strengthen support at this level.

Brent Crude

Copper broke support at $8500/tonne, signaling another test of $7000. Sometimes referred to as “Dr Copper” because of its “PhD in economics”, the metal has an uncanny ability to predict the direction of the global economy.

Copper

We use the broader Dow Jones Industrial Metals Index ($BIM) to confirm signals from Copper. The base metals index breached secondary support, at 167, warning of a test of primary support at 150.

Dow Jones Industrial Metals Index ($BIM)

Iron ore has also retraced, testing support at $100/tonne. Breach would warn of another test of $80.

Iron Ore

Dollar & Gold

The Dollar is also in a bear trend, testing support at 101. The recent rally in our view is simply a “dead cat bounce”, with another test of support likely. Breach would warn of another primary decline in the Dollar.

Dollar Index

Gold is in a bull market as the Dollar weakens. Dollar Index breach of 101 would likely cause a surge in demand for Gold, with breakout above $2050 signaling another primary advance — with a medium-term target of $2400 per ounce.

Spot Gold

Australia

The ASX 200 recent (medium-term) bull trend is losing steam, with the index ranging in a narrow band between 7200 and 7400 since April.

ASX 200

Breakout from that narrow band will provide a strong indication of future direction. Breach of 7200 is, in our view, far more likely — because of weakness in global commodity prices — and would warn of another test of primary support between 6900 and 7000.

ASX 200

The All Ordinaries Gold Index (XGD), however, is in a strong bull trend. Respect of support between 6900 and 7000 would strengthen the signal, while breakout above the band of resistance (7500 – 7700) would signal another primary advance, with a medium-term target of 8200.

All Ordinaries Gold Index

Conclusion

The US market is bi-polar, with large technology stocks leading a rally, while small caps and regional banks are struggling. The lag between an inverted yield curve and subsequent recession may be longer than usual because of the “pig in the python” — large injections of liquidity into financial markets during the pandemic.

Commodities are in a bear market, with falling crude and base metals warning of a global recession.

The Dollar is weakening and we expect a primary advance in Gold — with a medium-term target of $2400 per ounce — if the Dollar Index breaks support at 101.

The ASX medium-term rally is weakening and breach of 7200 would warn of another test of primary support. Two major influences are global commodity prices and major Wall Street indices.

Our outlook remains bearish despite the rally in the US technology sector. We are underweight in growth, cyclical and real estate sectors and overweight in gold, silver, defensive stocks, critical materials, cash, money market funds and short-term interest-bearing securities.

Our 2023 Outlook

This is our last newsletter for the year, where we take the opportunity to map out what we see as the major risks and opportunities facing investors in the year ahead.

US Economy

The Fed has been hiking interest rates since March this year, but real retail sales remain well above their pre-pandemic trend (dotted line below) and show no signs of slowing.

Real Retail Sales

Retail sales are even rising strongly against disposable personal income, with consumers running up credit and digging into savings.

Retail Sales/ Disposable Personal Income

The Fed wants to reduce demand in order to reduce inflationary pressure on consumer prices but consumers continue to spend. Household net worth has soared — from massive expansion of home and stock prices, fueled by cheap debt, and growing savings boosted by government stimulus during the pandemic. The ratio of household net worth to disposable personal income has climbed more than 40% since the global financial crisis — from 5.5 to 7.7.

Household Net Worth/ Disposable Personal Income

At the same time, unemployment (3.7%) has fallen close to record lows, increasing inflationary pressures as employers compete for scarce labor.

Unemployment

Real Growth

Hours worked contracted by an estimated 0.12% in November (-1.44% annualized).

Real GDP & Hours Worked

But annual growth rates for real GDP growth (1.9%) and hours worked (2.1%) remain positive.

Real GDP & Hours Worked

Heavy truck sales are also a solid 40,700 units per month (seasonally adjusted). Truck sales normally contract ahead of recessions, marked by light gray bars below, providing a reliable indicator of economic growth. Sales below 35,000 units per month would be bearish.

S&P 500

Inflation & Interest Rates

The underlying reason for the economy’s resilience is the massive expansion in the money supply (M2 excluding time deposits) relative to GDP, after the 2008 global financial crisis, doubling from earlier highs at 0.4 to the current ratio of 0.84. Excessive liquidity helped to suppress interest rates and balloon asset prices, with too much money chasing scarce investment opportunities. In the hunt for yield, investors became blind to risk.

S&P 500

Suppression of interest rates caused the yield on lowest investment grade corporate bonds (Baa) to decline below CPI. A dangerous precedent, last witnessed in the 1970s, negative real rates led to a massive spike in inflation. Former Fed Chairman, Paul Volcker, had to hike the Fed funds rate above 19.0%, crashing the economy, in order to tame inflation.

S&P 500

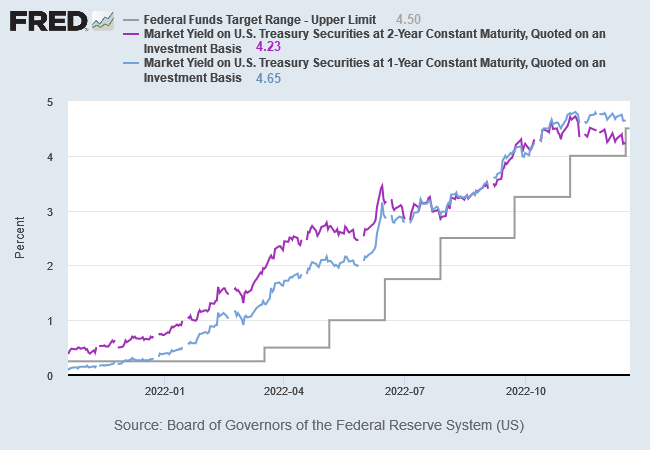
The current Fed chair, Jerome Powell, is doing his best to imitate Volcker, hiking rates steeply after a late start. Treasury yields have inverted, with the 1-year yield (4.65%) above the 2-year (4.23%), reflecting bond market expectations that the Fed will soon be forced to cut rates.
S&P 500

A negative yield curve, indicated by the 10-year/3-month spread below zero, warns that the US economy will go into recession in 2023. Our most reliable indicator, the yield spread has inverted (red rings below) before every recession declared by the NBER since 1960*.

S&P 500

Bear in mind that the yield curve normally inverts 6 to 18 months ahead of a recession and recovers shortly before the recession starts, when the Fed cuts interest rates.

Home Prices

Mortgage rates jumped steeply as the Fed hiked rates and started to withdraw liquidity from financial markets. The sharp rise signals the end of the 40-year bull market fueled by cheap debt. Rising inflation has put the Fed on notice that the honeymoon is over. Deflationary pressures from globalization can no longer be relied on to offset inflationary pressures from expansionary monetary policy.

S&P 500

Home prices have started to decline but have a long way to fall to their 2006 peak (of 184.6) that preceded the global financial crisis.

S&P 500

Stocks

The S&P 500 is edging lower, with negative 100-day Momentum signaling a bear market, but there is little sign of panic, with frequent rallies testing the descending trendline.

S&P 500

Bond market expectations of an early pivot has kept long-term yields low and supported stock prices. 10-Year Treasury yields at 3.44% are almost 100 basis points below the Fed funds target range of 4.25% to 4.50%. Gradual withdrawals of liquidity (QT)  by the Fed have so far failed to dent bond market optimism.

10-Year Treasury Yield & Fed Funds Rate

Treasuries & the Bond Market

Declining GDP is expected to shrink tax receipts, while interest servicing costs on existing fiscal debt are rising, causing the federal deficit to balloon to between $2.5 and $5.0 trillion according to macro/bond specialist Luke Gromen.

Federal Debt/GDP & Federal Deficit/GDP

With foreign demand for Treasuries shrinking, and the Fed running down its balance sheet, the only remaining market  for Treasuries is commercial banks and the private sector. Strong Treasury issuance is likely to increase upward pressure on yields, to attract investors. The inflow into bonds is likely to be funded by an outflow from stocks, accelerating their decline.

Energy

Brent crude prices fell below $80 per barrel, despite slowing releases from the US strategic petroleum reserve (SPR). Demand remains soft despite China’s relaxation of their zero-COVID policy — which some expected to accelerate their economic recovery.

S&P 500

European natural gas inventories are near full, causing a sharp fall in prices. But prices remain high compared to their long-term average, fueling inflation and an economic contraction.

S&P 500

Europe

European GDP growth is slowing, while inflation has soared, causing negative real GDP growth and a likely recession.

S&P 500

Australia, Base Metals & Iron Ore

Base metals rallied on optimism over China’s reopening from lockdowns. Normally a bullish sign for the global economy, breakout above resistance at 175 was short-lived, warning of a bull trap.

S&P 500

Iron ore posted a similar rally, from $80 to $110 per tonne, but is also likely to retreat.

S&P 500

The ASX benefited from the China rally, with the ASX 200 breaking resistance at 7100 to complete a double-bottom reversal. Now the index is retracing to test its new support level. Breach of 7000 would warn of another test of primary support at 6400.S&P 500

China

Optimism over China’s reopening may be premature. Residential property prices continue to fall.

S&P 500

The reopening also risks a massive COVID exit-wave, against an under-prepared population, when restrictions are relaxed.

“In my memory, I have never seen such a challenge to the Chinese health-care system,” Xi Chen, a Yale University global health researcher, told National Public Radio in America this week. With less than four intensive care beds for every 100,000 people and millions of unvaccinated or partially protected older adults, the risks are real.

With official data highly unreliable, it is hard to track exactly what impact China’s U-turn is having. Authorities on Friday reported the first Covid-19 deaths since most restrictions were lifted in early December, but there have been reports that funeral homes in Beijing are struggling to handle the number of bodies being brought in.

“The risk factors are there: eight million people are essentially not vaccinated,” said Huang Yanzhong, senior fellow for global health at the Council on Foreign Relations.

“Unless this variant has evolved in a way that makes it harmless, China can’t avoid what happened in Taiwan or in Hong Kong,” he added, referring to significant “exit waves” in both places.

The scale of the surge is unlikely to be apparent for months, but modelling suggests it could be grim. A report from the University of Hong Kong released on Thursday warned that a best case scenario is 700,000 fatalities – forecasts from a UK-based analytics firm put deaths at between 1.3 and 2.1 million.

“We’re still at a very early stage in this particular exit wave,” said Prof Ben Cowling, an epidemiologist at the University of Hong Kong. (The Telegraph)

China relied on infrastructure spending to get them out of past economic contractions but debt levels are now too high for stimulus on a similar scale to 2008. Expansion of credit to local government and real estate developers is likely to cause further stagnation, with the rise of zombie banking and real estate sectors — as Japan experienced for more than three decades — suffocating future growth.

S&P 500

Conclusion

Resilient consumer spending, high household net worth, and a tight labor market all make the Fed’s job difficult. If the current trend continues, the Fed will be forced to hike interest rates higher than the bond market expects, in order to curb demand and tame inflation.

Expected contraction of European and Chinese economies, combined with rate hikes in the US, are likely to cause a global recession.

There are two possible exits. First, if central banks stick to their guns and hold interest rates higher for longer, a major and extended economic contraction is almost inevitable. While inflation may be tamed, the global economy is likely to take years to recover.

The second option is for central banks to raise inflation targets and suppress long-term interest rates in order to create a soft landing. High inflation and negative real interest rates may prolong the period of low growth but negative real rates would rescue the G7 from precarious debt levels that have ensnared them over the past decade. A similar strategy was successfully employed after WWII to extricate governments from high debt levels relative to GDP.

As to which option will be chosen is a matter of political will. The easier second option is therefore more likely, as politicians tend to follow the line of least resistance.

We have refrained from weighing in on the likely outcome of the Russia-Ukraine conflict. Ukraine presently has the upper hand but the conflict is a wild card that could cause a spike in energy prices if it escalates or a positive boost to the European economy in the unlikely event that peace breaks out.

Our strategy is to remain overweight in gold, critical materials, defensive stocks and cash, while underweight bonds and high-multiple technology stocks. In the longer term, we will seek to invest cash in real assets when the opportunity presents itself.

Acknowledgements

  • Hat tip to Macrobusiness for the Pantheon Macroeconomics (China Residential) and Goldman Sachs (China Local Government Funding & Excavator Hours) charts.

Notes

* The yield curve inverted ahead of a 25% fall in the Dow in 1966. The NBER declared a recession but later changed their minds and airbrushed it out of their records.

ASX double-bottom breakout

The ASX 200 completed a double-bottom reversal with breakout above 7100, suggesting another test of resistance at 7600. The signal is strengthened by subsequent retracement that respected the new support level at 7100, as well as 100-day Momentum crossover above zero.

ASX 200

Australian Bond ETFs are forming a base, signaling that expectations of long-term interest rates have plateaued.

Australian Bond ETFs

A-REITs rallied off support at 1200, penetrating the descending trendline which suggests that a base is forming. However, the move has not been confirmed by 100-day Momentum which remains well below zero.

ASX 200 REITs

Financials have made a stronger recovery, breaking above their August high, with Momentum crossing above zero. We expect a test of 7000.

ASX 200 Financials

Housing price growth is slowing as the RBA hikes interest rates.

Housing

But low unemployment keeps bank loan impairments down.

Unemployment

Net interest margins remain under pressure, however, as liquidity tightens.

Net Interest Margins

Consumer Discretionary continues to test resistance at 3000 but respect remains likely, which would warn of further consolidation.

ASX 200 Discretionary

Staples rallied off long-term support at 12000 but Momentum remains below zero. Breakout above resistance at 13000 would signal another test of 14000.

ASX 200 Staples

A higher trough on Health Care and 100-day Momentum cross to above zero are bullish signs. Breakout above 44K would signal another advance, with a target of 49K (44K + 44K – 39K).

ASX 200 Health Care

Information Technology remains weak, with 100-day Momentum deep below zero. Expect another test of 1250.

ASX 200 Information Technology

Utilities broke resistance at 8400, signaling an advance. Momentum crossover to above zero strengthens the bull signal..

ASX 200 Utilities

Industrials are headed for another test of resistance at 6700. But further ranging between 6000 and 6750 remains likely.

ASX 200 Industrials

Telecommunications are slowly edging towards resistance at 1500 but Momentum below zero indicates weakness.

ASX 200 Telecommunications

Energy remains in a long-term up-trend, testing resistance at 12000. Retracement that respects support at 11000 would strengthen the bull signal.

ASX 200 Energy

The ASX 300 Metals & Mining index broke resistance at 5650, signaling an up-trend. Retracement that respected the new support level and 100-day Momentum cross to above zero both strengthen the bull signal.

ASX 300 Metals & Mining

But weakness in major metal groups makes us wary. Declining iron ore prices are testing support at 90. Breach would signal a test of $50/tonne

Iron Ore

Base metals are similarly testing support at 150. Breach would warn of another test of 100.

DJ Industrial Metals Index

The All Ordinaries Gold Index broke through resistance at 5500, with retracement respecting the new support level to confirm the breakout. But 100-day Momentum is a long way below zero, warning buyers to be wary. Expect further tests of the new support level.

All Ordinaries Gold Index

The Australian Dollar is ranging between A$2500 and A$2700 with no clear direction at present.

Gold in Australian Dollars

Conclusion

Growth in Australia is slowing but recession is unlikely unless there is a sharp rise in unemployment — and fall in the housing market — or a global recession.

ASX 200 completed a double-bottom reversal, offering a target of 7600, but we do not believe this to be the start of a bull market. A negative yield curve in the US, warning of a recession next year, makes a bull market unlikely. Respect of resistance at 7600 would confirm that we are still in a bear market.

Our weighting for ASX sectors (ST = short-term, LT = long-term):

  • A-REITs: ST underweight, LT overweight in industrial REITs
  • Financials: overweight
  • Staples: overweight
  • Discretionary: ST underweight, LT neutral
  • Utilities: overweight
  • Industrials: neutral
  • Telecommunications: neutral
  • Health Care: overweight
  • Information Technology: underweight
  • Energy: overweight
  • Iron ore & Base Metals: ST underweight, LT neutral
  • Critical Materials: heavily overweight
  • Gold: ST neutral, LT overweight