ASX double-bottom breakout

The ASX 200 completed a double-bottom reversal with breakout above 7100, suggesting another test of resistance at 7600. The signal is strengthened by subsequent retracement that respected the new support level at 7100, as well as 100-day Momentum crossover above zero.

ASX 200

Australian Bond ETFs are forming a base, signaling that expectations of long-term interest rates have plateaued.

Australian Bond ETFs

A-REITs rallied off support at 1200, penetrating the descending trendline which suggests that a base is forming. However, the move has not been confirmed by 100-day Momentum which remains well below zero.

ASX 200 REITs

Financials have made a stronger recovery, breaking above their August high, with Momentum crossing above zero. We expect a test of 7000.

ASX 200 Financials

Housing price growth is slowing as the RBA hikes interest rates.

Housing

But low unemployment keeps bank loan impairments down.

Unemployment

Net interest margins remain under pressure, however, as liquidity tightens.

Net Interest Margins

Consumer Discretionary continues to test resistance at 3000 but respect remains likely, which would warn of further consolidation.

ASX 200 Discretionary

Staples rallied off long-term support at 12000 but Momentum remains below zero. Breakout above resistance at 13000 would signal another test of 14000.

ASX 200 Staples

A higher trough on Health Care and 100-day Momentum cross to above zero are bullish signs. Breakout above 44K would signal another advance, with a target of 49K (44K + 44K – 39K).

ASX 200 Health Care

Information Technology remains weak, with 100-day Momentum deep below zero. Expect another test of 1250.

ASX 200 Information Technology

Utilities broke resistance at 8400, signaling an advance. Momentum crossover to above zero strengthens the bull signal..

ASX 200 Utilities

Industrials are headed for another test of resistance at 6700. But further ranging between 6000 and 6750 remains likely.

ASX 200 Industrials

Telecommunications are slowly edging towards resistance at 1500 but Momentum below zero indicates weakness.

ASX 200 Telecommunications

Energy remains in a long-term up-trend, testing resistance at 12000. Retracement that respects support at 11000 would strengthen the bull signal.

ASX 200 Energy

The ASX 300 Metals & Mining index broke resistance at 5650, signaling an up-trend. Retracement that respected the new support level and 100-day Momentum cross to above zero both strengthen the bull signal.

ASX 300 Metals & Mining

But weakness in major metal groups makes us wary. Declining iron ore prices are testing support at 90. Breach would signal a test of $50/tonne

Iron Ore

Base metals are similarly testing support at 150. Breach would warn of another test of 100.

DJ Industrial Metals Index

The All Ordinaries Gold Index broke through resistance at 5500, with retracement respecting the new support level to confirm the breakout. But 100-day Momentum is a long way below zero, warning buyers to be wary. Expect further tests of the new support level.

All Ordinaries Gold Index

The Australian Dollar is ranging between A$2500 and A$2700 with no clear direction at present.

Gold in Australian Dollars

Conclusion

Growth in Australia is slowing but recession is unlikely unless there is a sharp rise in unemployment — and fall in the housing market — or a global recession.

ASX 200 completed a double-bottom reversal, offering a target of 7600, but we do not believe this to be the start of a bull market. A negative yield curve in the US, warning of a recession next year, makes a bull market unlikely. Respect of resistance at 7600 would confirm that we are still in a bear market.

Our weighting for ASX sectors (ST = short-term, LT = long-term):

  • A-REITs: ST underweight, LT overweight in industrial REITs
  • Financials: overweight
  • Staples: overweight
  • Discretionary: ST underweight, LT neutral
  • Utilities: overweight
  • Industrials: neutral
  • Telecommunications: neutral
  • Health Care: overweight
  • Information Technology: underweight
  • Energy: overweight
  • Iron ore & Base Metals: ST underweight, LT neutral
  • Critical Materials: heavily overweight
  • Gold: ST neutral, LT overweight

Bond market: No place to hide

Advance retail sales were flat in September, reflecting slowing growth, but remain well above their pre-pandemic trend. So far, Fed rate hikes have failed to make a dent in consumer spending.

Advance Retail Sales

Even adjusted for inflation, real retail sales are well above the pre-pandemic trend.

Advance Real Retail Sales

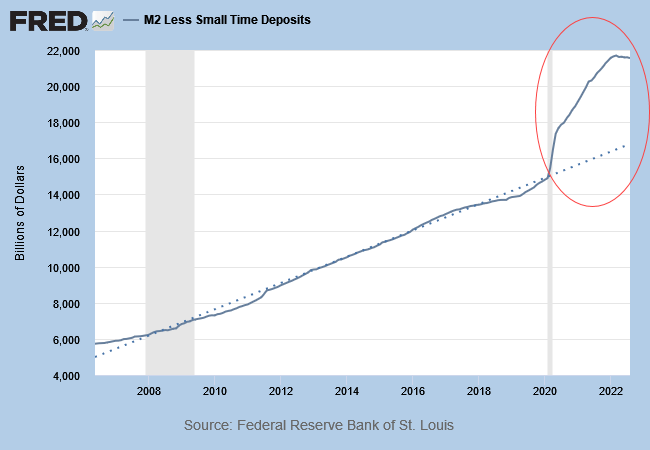
The culprit is M2 money supply. While M2 has stopped growing, there has been no real contraction to bring money supply in line with the long-term trend. A fall of that magnitude would have a devastating effect on inflated asset prices.

M2 excluding Time Deposits

Inflation is proving persistent, with CPI hardly budging in September. Hourly earnings growth is slowing but remains a long way above the Fed’s 2.0% inflation target.

CPI & Hourly Earnings Growth

Treasury yields have broken their forty year down-trend, with the 10-year testing resistance at 4.0%. Stubborn inflation is expected to lift yields even higher.

10-Year Treasury Yield

Inflation is forcing the Fed to raise interest rates, ending the forty-year expansion in debt levels (relative to GDP). Cheap debt supports elevated asset prices, so a decline in debt levels would cause a similar decline in asset prices.

Non-Financial Debt/GDP

A decline of that magnitude is likely to involve more pain than the political establishment can bear, leaving yield curve control (YCC) as the only viable alternative. The Fed would act as buyer of last resort for federal debt, while suppressing long-term yields. The same playbook was used in the 1950s and ’60s to drive down the debt to GDP ratio, allowing rapid growth in GDP while inflation eroded the real value of public debt.

Federal Debt/GDP

Conclusion

We are fast approaching a turning point, where the Fed cannot hike rates further without collapsing the bond market. In the short-term, while asset prices fall, cash is king. But in the long-term investors should beware of financial securities because inflation is expected to eat your lunch. Our strategy is to invest in real assets, including gold, critical materials and defensive stocks.

CPI shock upsets markets

The consumer price index (CPI) dipped to 8.25% (seasonally adjusted) for the 12 months to August but disappointed stock and bond markets who were anticipating a sharp fall.

CPI

The S&P 500 fell 4.3% to test support at 3900. Follow-through below 3650 would confirm earlier bear market signals.

S&P 500

Services CPI — which has minimal exposure to producer prices and supply chains — climbed to 6.08%. Rising services costs indicate that inflation is growing embedded in the economy.

CPI Services

Fueled by strong growth in average hourly earnings.

CPI & Wage Rates

But it is not only services that present a problem.

Food prices are growing above 10% p.a. — signaling hardship for low income-earners.

CPI Food

The heavily-weighted shelter component — almost one-third of total CPI — climbed to 6.25%. We expect further increases as CPI shelter lags actual home prices — represented by the Case-Shiller 20-City Composite Home Price Index (pink) on the chart below — by 6 to 12 months.

CPI Shelter

CPI energy is still high, at 23.91% for the 12 months to August, but the index has fallen steeply over the past two months (July-August).

CPI Energy

The decline is likely to continue until the mid-term elections in November, as the US government releases crude from its strategic reserves (SPR) in order to suppress fuel prices.

SPR Levels

The reduction in strategic reserves is unsustainable in the longer-term and reversal could deliver a nasty surprise for consumers in the new year.

SPR Lowest since 1984

Conclusion

Strong CPI growth for the 12-months to August warns that inflation will be difficult to contain. Services CPI at 6.08% also confirms that inflation is growing embedded in the economy.

Energy costs are falling but this may be unsustainable. Releases from the strategic petroleum reserve (SPR) are likely to end after the mid-term elections in November.

The Fed is way behind the curve, with the real Fed funds rate (FFR-CPI) at -5.92%, below the previous record low of -4.97% from 1975.

Real Fed Funds Rate (FFR-CPI)

We expect interest rates to rise “higher for longer.” A 75 basis-point hike is almost certain at next weeks’ FOMC meeting (September 20-21).

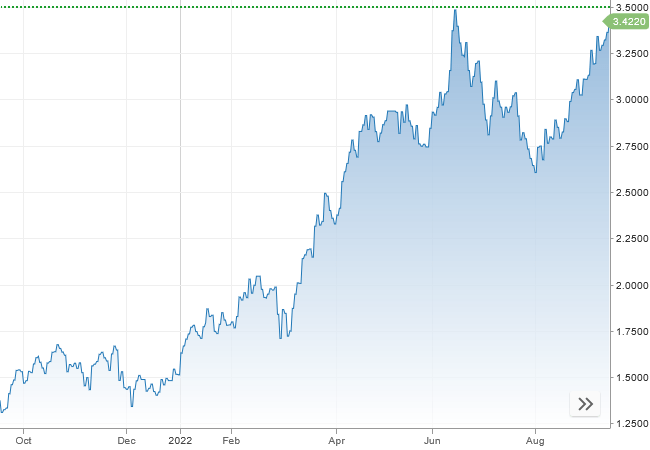
Long-term Treasury yields are rising, with the 10-year at 3.42%. Breakout above resistance at 3.50% is likely, signaling the end of a four decade-long secular bull trend in bonds.

10-Year Treasury Yields

Stocks and bonds are both falling, with the S&P 500 down 18.0% year-to-date compared to -25.4% for TLT.

S&P 500 and iShares 20+ Year Treasury ETF (TLT)

The best short-term haven is cash.

Base case: global recession

The Treasury yield curve is flattening, with the 10-year/3-month yield differential plunging sharply, to a current 0.24%. Another 75 basis point rate hike at the next FOMC meeting is expected to drive the 3-month T-Bill discount rate above the 10-year yield, the negative spread warning of a deep recession in the next 6 to 18 months (subsequent reversal to a positive spread would signal that recession is imminent).

10-Year & minus 3-Month Treasury Yield

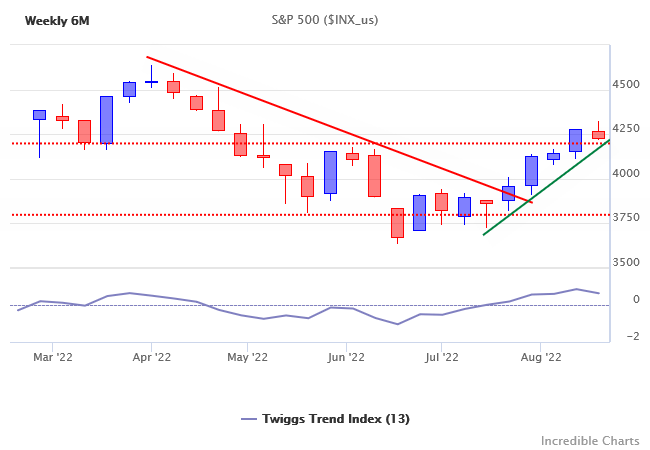
The S&P 500 is retracing to test short-term support at 4200. Breach would warn of another decline, while follow-through below 3650 would signal the second downward leg of a bear market.

S&P 500


21-Day Volatility troughs above 1% (red arrows) continue to warn of elevated risk.

S&P 500

Dow Jones Industrial Metals Index is in a primary down-trend, warning of a global recession.

DJ Industrial Metals Index

Supported by a similar primary down-trend on Copper, the most prescient of base metals.

Copper

Brent crude below $100 also warns of an economic contraction. Goldman Sachs project that crude oil will reach $135 per barrel this Winter, while Ed Morse at Citi says that WTI Light Crude will likely remain below $90 per barrel. Obviously, the former foresees an economic recovery, while the latter sees an extended contraction. Of the two, Morse has the best track in the industry.

Brent Crude

Natural gas prices are climbing.

Natural Gas

Especially in Europe, where Russia is attempting to choke the European economy.

Russia: EU Gas

Causing Germany’s producer price index to spike to 37.2% (year-on-year growth).

EU: PPI

Conclusion

Our base case is a global recession. A soft landing is unlikely unless the Fed does a sharp pivot, Russia stops trying to throttle European gas, and China goes all-in on its beleaguered property sector. That won’t address any of the underlying problems but would kick the can down the road for another year or two.

Global recession warning

Copper broke primary support at $9,000 per metric ton, signaling a bear market. Known as “Dr Copper” because of its prescient ability to predict the direction of the global economy, copper’s sharp fall warns of a global recession dead ahead.

Copper (S1)

The Dow Jones Industrial Metals Index broke support at 175, confirming the above bear signal. A Trend Index peak at zero warns of strong selling pressure across base metals.

DJ Industrial Metals Index (BIM)

Iron ore retreated below $125 per metric ton, warning of another test of $90. Further sign of a slowing global economy.

Iron Ore (TR)

The Australian Dollar is another strong indicator of the commodity cycle. After breaking primary support at 70 US cents, follow-through below support at 68.5 confirms a bear market. A Trend Index peak at zero warns of selling pressure.

Australian Dollar (AUDUSD)

Brent crude remains high, however, propped up by shortages due to sanctions on Russian oil. Penetration of the secondary trendline (lime green) is likely, as signs of a slowing economy accumulate. Breach of support at $100 per barrel is less likely, but would confirm a global recession.

Brent Crude (CB)

Long-term interest rates are falling, with the 10-year Treasury yield reversing below 3.0%, as signs of a US contraction accumulate.

10-Year Treasury Yield

ISM new orders fell to their lowest level since May 2020, in the midst of the pandemic.

ISM New Orders

The Atlanta Fed’s GDPNow forecast for Q2 dropped sharply, to an annualized real GDP growth rate of -2.08%.

Atlanta Fed GDPNow

Conclusion

We would assign probability of a global recession this year as high as 70%.

ASX confirms a bear market

The ASX 200 broke primary support level at 7000, confirming a bear market.

ASX 200

Long-term interest rates are rising, with bond ETFs falling.

Australia: Bond ETFs

A-REITs respected resistance at the former primary support level of 1500, confirming the primary down-trend. Trend Index peaks below zero warn of strong selling pressure.

ASX 200 REITs

Financials fell dramatically last week, testing primary support at 6000, as the prospect of falling residential property prices and rising defaults looms. Higher interest rates and wider net interest margins should offset this to some extent. Expect retracement to test resistance at 6000. Follow-through below this level would confirm a primary down-trend and strengthen the overall bear market (Financials have been one of the stronger sectors).

ASX 200 Financials

Consumer Discretionary respected resistance at 3000, signaling another decline with a target of 2600 [3000-400]. Trend Index peaks below zero warn of strong selling pressure.

ASX 200 Consumer Discretionary

Consumer Staples broke support at 13K, with respect of the new resistance level warning of another test of 12K.

ASX 200 Consumer Staples


Utilities continue their primary up-trend, rising Trend Index troughs indicating strong buying pressure.

ASX 200 Utilities

Industrials are headed for another test of support at 6350. Breach would warn of another test of primary support at 6000.

ASX 200 Industrials

Telecommunications broke support at 1400, signaling a primary down-trend. Trend Index peaks below zero warn of strong selling pressure. Breach of support offers a target of 1200 [1400-200].

ASX 200 Telecommunications

Health Care is consolidating below 42.5K. Reversal below 40K would warn of another test of primary support at 37.5K. A Trend Index peak close to zero would warn of fading buyer interest.

ASX 200 Health Care

Information Technology continues in a primary down-trend, with Trend Index peaks below zero warning of selling pressure. Follow-through below 1400 would offer a target of 1100 [1500-400].

ASX 200 IT

The Energy sector is advancing strongly, while Trend Index troughs above zero signal buying pressure. The prospect of Chinese lockdowns easing is likely to boost demand for oil and gas, sending prices soaring.

ASX 200 Energy

Metals & Mining respected resistance at 6250, warning of another test of 5500. Declining Trend Index peaks suggest buyer interest is fading. Respect of support at 5500 would signal that the up-trend is intact but breach seems more likely and would offer a target of the November ’21 low at 4750.

ASX 300 Metals & Mining

The broad DJ Industrial Metals Index respected resistance at 200, while Trend Index peaks below zero warn of strong selling pressure. Easing of lockdowns in China may increase demand but a bear market remains likely.

DJ Industrial Metals Index

Iron ore is also undergoing a correction. Breach of support at 125 would warn of another test of primary support at 90.

Iron Ore

The All Ordinaries Gold Index is again testing support at 6000, while Trend Index below zero warns of selling pressure.

All Ordinaries Gold Index

The price of Gold in Australian Dollars, however, is trending upwards, with rising Trend Index troughs indicating increased interest from buyers. Expect a test of A$2800 per ounce. Breakout would offer a target of A$3400 [2800 + 600].

Gold in Australian Dollars

Conclusion

ASX 200 broke support at 7200, confirming a bear market. Rising long-term interest rates and a poor global economic outlook are expected to weaken most sectors, while easing of China’s lockdown restrictions should provide some relief to energy and metals.

Our weighting for ASX sectors is:

  • A-REITs: heavily underweight
  • Financials: neutral
  • Staples: neutral
  • Discretionary: heavily underweight
  • Utilities: overweight
  • Industrials: neutral
  • Telecommunications: underweight
  • Health Care: neutral
  • Information Technology: heavily underweight
  • Energy: heavily overweight
  • Iron ore & Base Metals: underweight
  • Critical Materials (e.g. Lithium and Rare Earth Elements): heavily overweight
  • Gold: overweight