Fed Chairman Jerome Powell announced a 75 basis point increase in the Fed funds target rate at his post-FOMC press conference today:
“Today, the FOMC raised our policy interest rate by 75 basis points, and we continue to anticipate that ongoing increases will be appropriate. We are moving our policy stance purposefully to a level that will be sufficiently restrictive to return inflation to 2 percent. In addition, we are continuing the process of significantly reducing the size of our balance sheet. Restoring price stability will likely require maintaining a restrictive stance of policy for some time.”
The target range is now 3.75% to 4.0%.
Commenting on today’s announcement, Michael Contopoulos from Richard Bernstein says little has changed:
“Nothing really changed today, the Fed has been hawkish since Jackson Hole. It doesn’t matter how high rates go, what matters is that the Fed is going to be restrictive and they’re going to bring down long-term growth…..The end game is not cutting rates, at least any time soon, the end game is to slow growth and slow the economy.” (CNBC)
Chris Brightman from Research Affiliates, co-manager several PIMCO funds, offers a useful rule-of-thumb as to how far the Fed will need to hike. The unemployment rate has to rise by 1.0% for every 1.0% intended drop in core inflation.
Core inflation is close to 6.0% at present, if we take the average of core CPI (purple), growth in average hourly earnings (pink), and core PCE index (gray). To achieve the Fed’s 2.0% inflation target, using the above rule-of-thumb, would require a 4.0% increase in the unemployment rate.
That means an unemployment rate of 7.5% (red line below), making a recession almost certain.
The recent 10-year/3-month Treasury yield inversion also warns of a recession in 2023.
Conclusion
We expect the Fed to hike the funds rate to between 5.0% and 6.0% — the futures market reflects a peak of 5.1% in May ’23 — then a pause to assess the impact on the labor market. Employment tends to lag monetary policy by 6 to 12 months, so the results of recent rate hikes are only likely to show in 2023. The recent inversion of 10-year and 3-month Treasury yields also warns of a recession next year.
The unemployment rate will most likely need to rise to 7.5% to bring inflation back within the Fed’s target range. That would cause a deep recession, especially if the Fed holds rates high for an extended period as they have indicated.
Uncertainty still surrounds whether the Fed will be able to execute its stated plan. A sharp rise in unemployment or bond market collapse could cause an early Fed pivot as the Treasury yield curve and Fed fund futures still expect.
Colin Twiggs is a former investment banker with almost 40 years of experience in financial markets. He founded PVT Capital (AFSL number 546090), which provides income and growth strategies to wholesale clients.
Using a top-down approach, Colin identifies macro trends in the global economy and then combines fundamental and technical analysis to evaluate opportunities in sectors that stand to benefit.
Focusing on interest rates and financial market liquidity as primary drivers of the economic cycle, he warned of the 2008/2009 and 2020 bear markets well ahead of actual events.
We have had a number of major indicators warning of a bear market over the year, with the S&P 500 falling by more than 20%, completing a Dow Theory reversal, and 100-day Momentum holding below zero.
On the recession front, GDP recorded two quarters of negative growth — a useful rule of thumb recession measure. The middle of the Treasury yield curve also inverted — with the 10-year yield falling below the 2-year — warning of a recession ahead.
But unemployment (3.5%) is the lowest since the 1960s and the NBER has not moved to confirm a recession.
The front-end of the yield curve also remained positive, failing to confirm the signal from the 10-year/2-year negative spread.
Until now, that is.
On Tuesday, the 10-year/3-month Treasury spread turned negative, confirming the earlier 10Y/2Y recession warning.
Why is that important?
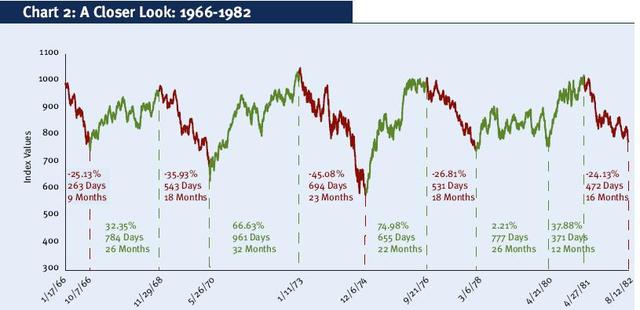
Because a negative 10-year/3-month spread has preceded every recession since 1960. One possible exception is 1966 (orange circle below). The 10Y/3M inverted, the Dow fell by 25%, and the NBER confirmed a recession but later changed their mind and airbrushed the recession out of the record. All-in-all, the 10Y/3M is our most reliable recession indicator, with a 100% track record in our view, over the past sixty years.
Conclusion
Our most reliable recession indicator, a negative 10-year/3-month Treasury yield differential, now confirms the recession warning from other indicators. But the signal is often early and it could take 6 to 12 months for the actual recession to arrive.
After their recent track record, expectations that the Fed will manufacture a soft landing are the triumph of hope over experience.
Employment is a lagging indicator and often only falls during the recession. Inflation likewise lags monetary policy by up to 6 months, before the full impact is clear. We expect the Fed to continue hiking, waiting for employment and inflation to fall, until the lagged impact of past rate hikes comes into view. Instead of cutting interest rates to soften the impact, the Fed has indicated they will hold rates high for longer. If so, we are likely to experience a severe recession.
Our strategy is to invest in cash in the short-term and limit exposure to equities, other than precious metals, critical materials, and defensive stocks.
Colin Twiggs is a former investment banker with almost 40 years of experience in financial markets. He founded PVT Capital (AFSL number 546090), which provides income and growth strategies to wholesale clients.
Using a top-down approach, Colin identifies macro trends in the global economy and then combines fundamental and technical analysis to evaluate opportunities in sectors that stand to benefit.
Focusing on interest rates and financial market liquidity as primary drivers of the economic cycle, he warned of the 2008/2009 and 2020 bear markets well ahead of actual events.
There is plenty of evidence to suggest that recessions cause a sharp fall in the consumer price index. Alfonso Peccatiello recently analyzed US recessions over the past century and concluded that they caused an average drop in CPI of 6.8%.
A recession no doubt reduces inflation but it does not necessarily kill underlying inflationary pressures. It took massive pain inflicted by the Volcker Fed in the early ’80s to reverse the long-term up-trend in inflation. Average hourly earnings (gray) is a better gauge of underlying inflation as can be seen on the graph below.
Recessions cause a fall in earnings growth but do not interrupt the underlying trend unless the economy is administered a severe shock. In the early 1980s, it took four recessions in just over a decade, a Fed funds rate (gray below) peaking at 22% in December 1980, and unemployment (blue) spiking to 10.8%.
In the current scenario, we have had one recession, but cushioned by massive fiscal stimulus and Fed QE. Another recession would be unlikely to break the up-trend in underlying inflation unless there is a sharp rise in unemployment.
A study by Larry Summers and Olivier Blanchard maintains that unemployment will have to rise above 5% in order to tame inflation. The chart below suggests that unemployment may need to rise closer to 10% — as in 1982 and 2009 — in order to kill underlying inflationary pressures.
Conclusion
We are not suggesting that the Fed hike rates sufficiently for unemployment to reach 10%. That would cause widespread destruction of productive capacity in the economy and take years, even decades, to recover. Instead, we believe that the Fed should tolerate higher levels of inflation while Treasury focuses expenditure on building infrastructure and key supply chains, to create a more robust economy. Largely in line with Zoltan Pozsar’s four R’s:
(1) re-arm (to defend the world order);
(2) re-shore (to get around blockades);
(3) re-stock and invest (commodities); and
(4) re-wire the grid (to speed up energy transition).
An early Fed pause, before inflation is contained, would drive up long-term yields and weaken the Dollar. The former would cause a crash in stocks and bonds and the latter would increase demand for Gold and other inflation hedges.
A weaker Dollar would make US manufacturing more competitive in global markets and reduce the harm being caused to emerging markets. Unfortunately, one of the consequences would be higher prices for imported goods, including crude oil, and increased inflationary pressures.
The US Fed and Treasury are faced with an array of poor choices and in the end will have to settle for a strategy that minimizes long-term damage. In an economic war as at present, higher inflation will have to be tolerated until the war is won. An added benefit is that rapid growth in nominal GDP, through high inflation, would reduce the government’s precarious debt burden.
Colin Twiggs is a former investment banker with almost 40 years of experience in financial markets. He founded PVT Capital (AFSL number 546090), which provides income and growth strategies to wholesale clients.
Using a top-down approach, Colin identifies macro trends in the global economy and then combines fundamental and technical analysis to evaluate opportunities in sectors that stand to benefit.
Focusing on interest rates and financial market liquidity as primary drivers of the economic cycle, he warned of the 2008/2009 and 2020 bear markets well ahead of actual events.
The consumer price index (CPI) dipped to 8.25% (seasonally adjusted) for the 12 months to August but disappointed stock and bond markets who were anticipating a sharp fall.
The S&P 500 fell 4.3% to test support at 3900. Follow-through below 3650 would confirm earlier bear market signals.
Services CPI — which has minimal exposure to producer prices and supply chains — climbed to 6.08%. Rising services costs indicate that inflation is growing embedded in the economy.
Fueled by strong growth in average hourly earnings.
But it is not only services that present a problem.
Food prices are growing above 10% p.a. — signaling hardship for low income-earners.
The heavily-weighted shelter component — almost one-third of total CPI — climbed to 6.25%. We expect further increases as CPI shelter lags actual home prices — represented by the Case-Shiller 20-City Composite Home Price Index (pink) on the chart below — by 6 to 12 months.
CPI energy is still high, at 23.91% for the 12 months to August, but the index has fallen steeply over the past two months (July-August).
The decline is likely to continue until the mid-term elections in November, as the US government releases crude from its strategic reserves (SPR) in order to suppress fuel prices.
The reduction in strategic reserves is unsustainable in the longer-term and reversal could deliver a nasty surprise for consumers in the new year.
Conclusion
Strong CPI growth for the 12-months to August warns that inflation will be difficult to contain. Services CPI at 6.08% also confirms that inflation is growing embedded in the economy.
Energy costs are falling but this may be unsustainable. Releases from the strategic petroleum reserve (SPR) are likely to end after the mid-term elections in November.
The Fed is way behind the curve, with the real Fed funds rate (FFR-CPI) at -5.92%, below the previous record low of -4.97% from 1975.
We expect interest rates to rise “higher for longer.” A 75 basis-point hike is almost certain at next weeks’ FOMC meeting (September 20-21).
Long-term Treasury yields are rising, with the 10-year at 3.42%. Breakout above resistance at 3.50% is likely, signaling the end of a four decade-long secular bull trend in bonds.
Stocks and bonds are both falling, with the S&P 500 down 18.0% year-to-date compared to -25.4% for TLT.
Colin Twiggs is a former investment banker with almost 40 years of experience in financial markets. He founded PVT Capital (AFSL number 546090), which provides income and growth strategies to wholesale clients.
Using a top-down approach, Colin identifies macro trends in the global economy and then combines fundamental and technical analysis to evaluate opportunities in sectors that stand to benefit.
Focusing on interest rates and financial market liquidity as primary drivers of the economic cycle, he warned of the 2008/2009 and 2020 bear markets well ahead of actual events.
CPI dipped to 8.5% for the 12 months to July. But this still leaves the Fed way behind the curve, with a real Fed funds rate of -6.0% (8.5%-2.5%).
Monthly CPI figures, however, show a sharp slowdown, with CPI falling 0.01% in July (-0.14% annualized rate).
The primary cause is energy prices, which fell 4.53% in July (-54.7% annualized rate).
Food CPI continues to climb, up 1.06%for July (12.75% annualized rate).
CPI Shelter, heavily weighted at 32.1% of the total CPI basket, remains a major source of upward pressure on CPI. The Shelter index tends to lag home prices by up to 12 months and the Case-Shiller 20-City Composite Home Price Index grew at 20.8% for the 12 months to May.
The Rents component of CPI shelter shows a similar lag, a long way behind the Zillow rent index which is up 14.8% over the 12 months to June.
Wages & consumer expectations
Consumer expectations for inflation were unchanged, at 5.3% in June.
While average hourly wage rates moderated slightly, growing 6.2% in the 12 months to July.
Upward pressure on wages is likely to continue for as long as job openings exceed unemployment, with a current shortfall of 5 million workers.
The Fed
The real Fed funds rate (FFR adjusted for CPI) rose to a weak -6.0% after the latest rate hike, still lower than any previous trough in the past sixty years. Real FFR (red below) should be positive when unemployment (blue) is below 5%. Past lows, circled on the chart below, were in response to high unemployment — when the economy had spare capacity. We now have the opposite, with a tight labor market, and negative real rates are likely to give rise to high inflation.
Conclusion
Some are calling this “peak inflation” but the decline in CPI growth is due to a large monthly drop in energy prices. Food and shelter costs are still rising.
The energy crisis is not over, with Winter approaching in Europe while gas storage levels are at record lows and Russia is restricting pipeline flows in an attempt to create division within the European Union. Energy prices are likely to remain volatile.
The Fed is way behind the curve, with a real Fed funds rate of -6.0%. We expect them to continue hiking interest rates despite the recent fall in energy prices.
According to Larry Summers and Olivier Blanchard, the Fed will only be able to bring inflation down when unemployment is well above 5%. The danger is if the Fed is forced to halt rate hikes before it has tamed underlying inflation. We are then likely to end up with both low growth and high inflation.
Our strategy remains defensive: overweight Gold, critical materials, defensive stocks which enjoy strong pricing power, and cash.
Acknowledgements
Hat tip to Wolf Richter for the CPI Rent/Zillow chart.
Colin Twiggs is a former investment banker with almost 40 years of experience in financial markets. He founded PVT Capital (AFSL number 546090), which provides income and growth strategies to wholesale clients.
Using a top-down approach, Colin identifies macro trends in the global economy and then combines fundamental and technical analysis to evaluate opportunities in sectors that stand to benefit.
Focusing on interest rates and financial market liquidity as primary drivers of the economic cycle, he warned of the 2008/2009 and 2020 bear markets well ahead of actual events.
On March 8, 2000, President Bill Clinton made a persuasive pitch to Washington’s foreign policy elite, Congress and the international community, on the merits of China’s accession to the World Trade Organization:
“Membership in the WTO, of course, will not create a free society in China overnight or guarantee that China will play by global rules. But over time, I believe it will move China faster and further in the right direction……..We have a far greater chance of having a positive influence on China’s actions if we welcome China into the world community instead of shutting it out.”
That was little more than a decade after the Beijing government massacred thousands of students participating in pro-democracy demonstrations in Tiananmen Square, June 1989. Twenty years have passed since China’s 2002 accession to the World Trade Organization. Let’s review how that is working out.
Zero progress toward a free society
Xi Jinping reversed any progress, towards a more open society, made under Hu Jintao. Xi revoked the term limit on his leadership as General Secretary of the Chinese Communist Party; increased censorship and mass surveillance; imprisoned minorities; suppressed news of the COVID outbreak in early 2020, causing a global pandemic; he shredded the one-country-two-systems agreement with the UK and cracked down on the pro-democracy movement in Hong Kong; while threatening democratic Taiwan with invasion.
Malign influence on democratic institutions
Rather than opening up China to Western influence, an open Western society proved highly susceptible to Chinese influence operations. Efforts to suppress free speech include infiltration of universities through establishment of Confucius Institutes and research grants; the Belt-and-Road initiative to increase control over fledgling democracies in the Asia-Pacific and Africa; and growing control over appointments in UN bodies. North Korea, for example, has been appointed as the current Chair of the UN Conference on Nuclear Disarmament.
Growing geopolitical challenge
Trade with the West has empowered China’s development of a powerful nuclear ICBM force, including hypersonic weapons; seizure and militarization of disputed shoals in the South China Sea, flouting international conventions; and development of a blue-water navy to expand its influence far beyond its shores.
Negative economic impact on the US.
Ignore the flowery speeches about democracy and freedom from the former President, the primary purpose of China’s admission was to enrich US corporations. When President Clinton described China’s admission as a “win-win”, you can be sure that US multinationals understood this to mean increased profit margins and new markets. China was also meant to benefit economically, to the extent that workers’ standard of living would need to rise so that they could consume more mass-produced Western goods.
It didn’t work out as planned.
Corporate profit margins rose to new highs, post-2002, as employee compensation fell.
The price was destruction of millions of manufacturing jobs as US companies shifted factories to Asia, where labor costs were a fraction of those in the US. Initially the erosion started with low-skill, menial jobs but soon expanded to high technology sectors as China’s industrial base grew.
Industrial production in the US stalled after the 2008 crash, losing an entire decade of growth.
Current account deficits ballooned as Chinese exports flowed into the US, supported by massive capital outflows from China to maintain their currency peg against the US Dollar. Capital outflows prevented the Yuan from appreciating against the Dollar — which would have eroded China’s pricing advantage in international markets.
The US slipped from being a net creditor in the 1980s to the world’s biggest debtor, with a negative net international investment position (NIIP) of more than $18 trillion.
Federal debt climbed to a precarious 128% of GDP in 2021 as the government ran ever-larger deficits to support the economy and offset the massive current account hemorrhage.
The traditional relationship between government deficits and unemployment started to break down in the late 1980s. Unemployment (RHS) is on an inverted scale below, so high unemployment is near the bottom and low figures are near the top of the chart. Before the late 1980s, deficits were relatively small , increasing to between 4% and 6% of GDP when unemployment spiked during a recession. But deficits were kept close to 3% of GDP in the Reagan-Bush (HW) era, even when employment had recovered (blue circle). The hoped-for boost to GDP failed to materialize but the experiment was nevertheless repeated, even more aggressively, by Trump in 2016-2020, cutting corporate taxes in the hope that this would boost growth. But GDP growth again remained low.
The Fed started expanding its balance sheet after the 2008 global financial crisis, in order to support a massive fiscal deficit of 10% of GDP, and an even larger 15% deficit in 2020. The effect was self-reinforcing as QE discouraged foreign investors from purchasing Treasuries — out of fear that the Dollar was being debased — forcing the Fed to inject ever-larger amounts of QE to make up for the absence of foreign funding. Money supply (M2) spiked upwards as a percentage of GDP, adding to debasement fears.
There was one win, however, from globalization that the Fed was quick to claim. Low inflation is mistakenly attributed to Fed skill in managing the economy rather than the real reason: erosion of the US industrial base which undermined wages growth, particularly in the manufacturing sector.
Conclusion
Admission of China to the World Trade Organization in 2002 was an unmitigated disaster, unleashing a massive deflationary shock that destabilized the global financial system. Despite being a developing economy, China become a major exporter of capital, as well as goods, upsetting the level playing field of international exchange rates. This helped to suppress the Yuan, giving Chinese manufacturers an advantage over Western competitors, and caused the loss of millions of manufacturing jobs in the West. The Western response was to run larger deficits, causing public debt to balloon to precarious levels, while central banks efforts to support growing fiscal debt destabilized the global financial system.
The recent surge in inflation exposed central banks inability to protect their currencies, without causing a global recession, undermined by precarious public debt levels and bloated central bank balance sheets.
Sir James Goldsmith — interviewed here in 1994 by Charlie Rose — was on the money when he referred to breach of the social contract between capital and labor, that ensured political stability in the West, and the betrayal of trust between political leaders and their electorate.
The present course is unsustainable in the long run and we anticipate an era of de-globalization as nations on-shore critical supply chains. There is no other currency that can compete with the Dollar’s status as global reserve currency but the system is likely to evolve towards a multi-polar world, with several separate trading/currency systems backed by commodities such as Gold, Silver and Base Metals. Oil would be ideal, as energy is central to the global economy, but storage is cumbersome; so a fixed exchange rate between oil and gold/base metals is more likely.
Colin Twiggs is a former investment banker with almost 40 years of experience in financial markets. He founded PVT Capital (AFSL number 546090), which provides income and growth strategies to wholesale clients.
Using a top-down approach, Colin identifies macro trends in the global economy and then combines fundamental and technical analysis to evaluate opportunities in sectors that stand to benefit.
Focusing on interest rates and financial market liquidity as primary drivers of the economic cycle, he warned of the 2008/2009 and 2020 bear markets well ahead of actual events.
Job openings came in at a seasonally-adjusted 11.27 million for February, compared to unemployment of 6.27 million. A shortfall of 5 million workers.
Conclusion
An excess of 5 million job openings, above the unemployment level, is expected to maintain upward pressure on wage rates as employers compete for scarce workers. Inflationary pressure is likely to continue.
Colin Twiggs is a former investment banker with almost 40 years of experience in financial markets. He founded PVT Capital (AFSL number 546090), which provides income and growth strategies to wholesale clients.
Using a top-down approach, Colin identifies macro trends in the global economy and then combines fundamental and technical analysis to evaluate opportunities in sectors that stand to benefit.
Focusing on interest rates and financial market liquidity as primary drivers of the economic cycle, he warned of the 2008/2009 and 2020 bear markets well ahead of actual events.
The Fed is able to increase money supply growth but the ongoing decline in velocity (V) means that the new liquidity is trapped in the financial markets rather than advancing the standard of living by moving into the real economy…..
Money and debt are created simultaneously. If the debt produces a sustaining income stream to repay principal and interest, then velocity will rise since GDP will eventually increase beyond the initial borrowing. If advancing debt produces increasingly smaller gains in GDP, then V falls. Debt financed private and governmental projects may temporarily boost GDP and velocity over short timespans, but if the projects do not generate new funds to meet longer term debt servicing obligations, then velocity falls as the historical statistics confirm.
The increase in M2 is not channeled into productive investment — that fuels GDP growth — but rather into unproductive investment in financial assets. The wealthy invest in real assets, as a hedge against inflation, but these are mainly speculative assets — such as gold, precious metals, jewellery, artworks and other collectibles, high-end real estate, or cryptocurrencies — which seldom produce much in the way of real income, with the speculator relying on asset price inflation and low interest rates to make a profit. Many so-called “growth stocks” — with negative earnings — fall in the same category. Debt used to fund stock buybacks also falls in this category as their purpose is financial engineering, with no increase in real earnings.
In 2008 and 2009 Carmen Reinhart and Ken Rogoff (R&R) published research that indicated from an extensive quantitative analysis of highly indebted economies that their economic growth was significantly diminished once they become highly over-indebted.
…..Cristina Checherita and Philip Rother, in research for the European Central Bank (ECB) published in 2014, investigated the average effect of government debt on per capita GDP growth in twelve Euro Area countries over a period of about four decades beginning in 1970. Dr. Checherita, now head of the fiscal affairs division of the ECB and Dr. Rother, chief economist of the European Economic Community, found that a government debt to GDP ratio above the turning point of 90-100% has a “deleterious” impact on long-term growth. In addition, they find that there is a non-linear impact of debt on growth beyond this turning point. A non-linear relationship means that as the government debt rises to higher and higher levels, the adverse growth consequences accelerate……Moreover, confidence intervals for the debt turning point suggest that the negative growth rate effect of high debt may start from levels of around 70-80% of GDP.
…..Unfortunately, early-stage economic expansions do not fare well when inflation and interest rates are not declining at this stage of the business cycle, which is not the normal historical role, or the path indicated by economic theory. As this year has once again confirmed, in early expansion inflationary episodes, prices rise faster than real wages, thereby stunting consumer spending. The faster inflation also thwarts the needed continuing cyclical decline in money and bond yields, which are necessary to gain economic momentum.
…..The U.S. economy has clearly experienced an unprecedented set of supply side disruptions, which serve to shift the upward sloping aggregate supply curve inward. In a graph, with aggregate prices on the vertical axis and real GDP on the horizontal axis, this causes the aggregate supply and demand curves to intersect at a higher price level and lower level of real GDP. This drop in real GDP, often referred to as a supply side recession, increases what is known as the deflationary gap, which means that the level of real GDP falls further from the level of potential GDP. This deflationary gap in turn leads to demand destruction setting in motion a process that will eventually reverse the rise in inflation.
Currently, however, the decline in money growth and velocity indicate that the inflation induced supply side shocks will eventually be reversed. In this environment, Treasury bond yields could temporarily be pushed higher in response to inflation. These sporadic moves will not be maintained. The trend in longer yields remains downward.
Negative real yields
A negative real yield points to the fact that investors or entrepreneurs cannot earn a real return sufficient to cover risks. Accordingly, the funds for physical investment will fall and productivity gains will erode which undermines growth. Attempting to counter this fact, central banks expand liquidity but the inability of firms to profitably invest causes the velocity of money to fall but the additional liquidity boosts financial assets. Financial investment, however, does not raise the standard of living. While the timing is uncertain, real forward financial asset returns must eventually move into alignment with the already present negative long-term real Treasury interest rates. This implied reduction in future investment will impair economic growth.
….research has documented that extremely high levels of governmental indebtedness suppress real per capita GDP. In the distant past, debt financed government spending may have been preceded by stronger sustained economic performance, but that is no longer the case. When governments accelerate debt over a certain level to improve faltering economic conditions, it actually slows economic activity. While governmental action may be required for political reasons, governments would be better off to admit that traditional tools would only serve to compound existing problems.
Carmen Reinhart, Vincent Reinhart and Kenneth Rogoff (which will be referred to as RR&R), in the Summer 2012 issue of the Journal of Economic Perspectives linked extreme sustained over indebtedness with the level of interest rates…… “Contrary to popular perception, we find that in 11 of the 16 debt overhang cases, real interest rates were either lower or about the same as during the lower debt/GDP years. Those waiting for financial markets to send the warning signal through higher (real) interest rates that governmental policy will be detrimental to economic performance may be waiting a long time.”
Growth Obstacles
In 2022, several headwinds will weigh on the U.S. economy. These include negative real interest rates combined with a massive debt overhang, poor domestic and global demographics, and a foreign sector that will drain growth from the domestic economy. The EM and AD (Advanced) economies will both serve to be a restraint on U.S. growth this year and perhaps significantly longer. The negative real interest rates signal that capital is being destroyed and with it the incentive to plough funds into physical investment.
Demographics continue to stagnate in the United States and throughout the world……..Poor demographics retard economic growth by lowering household, business and state and local investment. This keeps intact the observable trend in numerous countries – extreme over-indebtedness reduces economic growth which, in turn, worsens demographics, which reinforces the weakness emanating from the debt overhang. William Stull, Professor of Economics at Temple University, makes the case that for nations’, “demographics is destiny” (a phrase coined by Ben Wattenberg and Richard M. Scammon), highlighting the importance of its critical secular growth in determining economic fortune.
Although fourth quarter numbers are not yet available, the global debt to GDP average for 2020-21 is almost certainly the highest on record for any two-year period. Transitory growth spurts, like the one Q4 2021, are unlikely to be sustained. The sporadic but weakening growth trend evident before the pandemic hit in 2019 will return, reinforcing the debt trap.
Inflation
The University of Michigan indicates consumer sentiment in the fourth quarter was worse than during the height of the 2020 pandemic and at the levels of the beginning of the very deep 2008-09 recession. Consumers cut back significantly on their buying plans as expectations for increases in future income slumped. To fund the sharply higher cost of necessities, households have been forced to reduce the personal saving rate in November to 6.9%, or 0.4% less than in December 2019. Needing to tap credit card lines undoubtedly contributed to the erosion in consumer confidence measures. Without the sizable cut in personal saving, real consumer expenditures were barely positive in the fourth quarter. With money growth likely to slow even more sharply in response to tapering by the FOMC, the velocity of money in a major downward trend, coupled with increased global over-indebtedness, poor demographics and other headwinds at work, the faster observed inflation of last year should unwind noticeably in 2022.
Colin Twiggs is a former investment banker with almost 40 years of experience in financial markets. He founded PVT Capital (AFSL number 546090), which provides income and growth strategies to wholesale clients.
Using a top-down approach, Colin identifies macro trends in the global economy and then combines fundamental and technical analysis to evaluate opportunities in sectors that stand to benefit.
Focusing on interest rates and financial market liquidity as primary drivers of the economic cycle, he warned of the 2008/2009 and 2020 bear markets well ahead of actual events.
A friend asked a question: “Our advanced economies are 70 – 80 % Services based these days; so will this make CPI inflation difficult to sustain if wages growth is not sustained.”
The answer is YES. Inflation is unlikely to be sustained if wages growth declines.
BUT wages growth is accelerating, not declining, both in the services sector and in the broader economy.
Wages growth is also not likely to decline while we have record job openings; 5.4 million in the services sector alone.
Employers are having to offer higher wages and sign-on bonuses to attract workers — the result of record high savings levels fueled by government stimulus.
Colin Twiggs is a former investment banker with almost 40 years of experience in financial markets. He founded PVT Capital (AFSL number 546090), which provides income and growth strategies to wholesale clients.
Using a top-down approach, Colin identifies macro trends in the global economy and then combines fundamental and technical analysis to evaluate opportunities in sectors that stand to benefit.
Focusing on interest rates and financial market liquidity as primary drivers of the economic cycle, he warned of the 2008/2009 and 2020 bear markets well ahead of actual events.
The October labor report shows hours worked were roughly unchanged from September and still 100K below the pre-pandemic high (5.25m). But GDP of 19.5 trillion is up slightly when compared to 19.2T in Q3 2019, indicating that productivity has improved.
Monthly retail sales for September, on the other hand, were way above trend.
People are spending Dollars they didn’t earn, courtesy of record government stimulus.
That is one of the primary causes of rising consumer prices (red below): when demand outstrips supply.
A rising CPI in turn causes second run inflation through higher wage demands (green and gray above) if central banks fail to act quickly. They become embedded and difficult to dislodge.
The combined effect of the pandemic and government stimulus has had a profound impact on the US labor market. The economy added 5.8 million jobs in the 10 months to October, at an average of 580K per month. That rate is likely to slow as the economy reopens and enhanced unemployment benefits end.
We are missing 4.2 million employees, compared to the pre-pandemic peak of 152.5m jobs, and seem unlikely to find them, judging by the 10.4 million job openings in September. High levels of job openings are likely to exert continuing upward pressure on wages.
The missing workers — aided by government handouts — have either retired, quit their jobs to day-trade Tesla and crypto-currencies, or have re-assessed their work-life priorities. No doubt there will be a trickle back to the workforce — as day-traders encounter reversion to the mean and/or savings run low — but the Fed needs to reassess its full employment target. Failure to do so would leave interest rates too low for too long and allow second run inflation to become entrenched. The only way to then dislodge it is with the kind of drastic measures that Paul Volcker used in the early eighties, with the fed funds rate peaking at 20%.
Colin Twiggs is a former investment banker with almost 40 years of experience in financial markets. He founded PVT Capital (AFSL number 546090), which provides income and growth strategies to wholesale clients.
Using a top-down approach, Colin identifies macro trends in the global economy and then combines fundamental and technical analysis to evaluate opportunities in sectors that stand to benefit.
Focusing on interest rates and financial market liquidity as primary drivers of the economic cycle, he warned of the 2008/2009 and 2020 bear markets well ahead of actual events.


