This might seem more like a wish list than a forecast — there are always risks that can derail predictions — but we believe these are high probability events over the long-term.
Our timeline is flexible, some events may take longer than a decade while others could occur a lot sooner.
Also, some of the reasons for optimism present both a problem and an opportunity. It depends on which side of the trade you are on.
#1 US Politics
The political divide in the United States is expected to heal after neither President Biden nor his predecessor, and current GOP front-runner Donald Trump, make the ballot in 2024. The first due to concerns over his age and the latter due to legal woes and inability to garner support from the center. A younger, more moderate candidate from the right (Nikki Haley) or left (Gavin Newsom?) is likely to be elected in 2024 and lead the reconciliation process, allowing Congress to focus on long-term challenges rather than political grandstanding.
Nikki Haley & Gavin Newsom – Wikipedia
#2 The Rise of Europe

Prime Minister of Estonia, Kaja Kallas – Wikipedia
Europe is expected to rediscover its backbone, led by the example of Eastern European leaders who have long understood the existential threat posed by Russian encroachment. Increased funding and supply of arms to Ukraine will sustain their beleaguered ally. NATO will re-arm, securing its Eastern border but is unlikely to be drawn into a war with Russia.
#3 Decline of the Autocrats
We are past peak-autocrat — when Vladimir Putin announced Russia’s full-scale invasion of Ukraine on February 23, 2022.

Vladimir Putin announces invasion of Ukraine – CNN
Russia
The Russian economy is likely to be drained by the on-going war in Ukraine, with drone attacks on energy infrastructure bleeding Russia’s economy. Demands on the civilian population are expected to rise as oil and gas revenues dwindle.

Fire at an oil storage depot in Klintsy, southern Russia after it was hit by a Ukrainian drone – BBC
China
The CCP’s tenuous hold on power faces three critical challenges. First, an ageing population fueled by the CPP’s disastrous one-child policy (1979-2015) and declining birth rates after the 2020 COVID pandemic — a reaction to totalitarian shutdowns for political ends.

Second, is the middle-income trap. Failure to overcome the political challenges of redistributing income away from local governments, state-owned enterprises and existing elites will prevent the rise of a consumer economy driven by strong levels of consumption and lower savings by the broad population.
Third, the inevitable demise of autocratic regimes because of their rigidity and inability to adapt to a changing world. Autocratic leaders grow increasingly isolated in an information silo, where subordinates are afraid to convey bad news and instead tell leaders what they want to hear. Poor feedback and doubling down on past failures destroy morale and trust in leadership, leading to a dysfunctional economy.
Iran

Iranian Ayatollah Ali Khamenei – Wikipedia
Demographics are likely to triumph in Iran, with the ageing religious conservatives losing power as their numbers dwindle. The rise of a more moderate, Westernized younger generation is expected to lead to the decline of Iranian-backed extremism and greater stability in the Middle East.
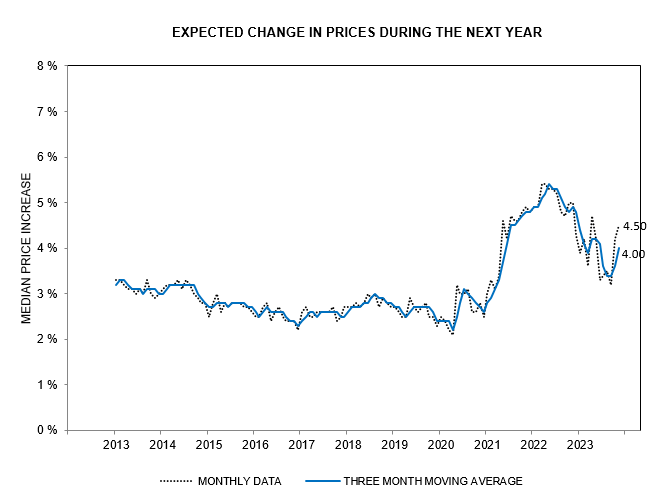
#4 High Inflation
The US federal government is likely to avoid default on its $34 trillion debt, using high inflation to shrink the debt in real terms and boost GDP at the same time.

#5 Negative real interest rates
High inflation and rising nominal Treasury yields would threaten the ability of Treasury to service interest costs on outstanding debt without deficits spiraling out of control. The Fed will be forced to suppress interest rates to save the Treasury market, further fueling high inflation. Negative real interest rates will drive up prices of real assets.
#6 US Dollar
The US Dollar will decline as the US on-shores critical industries and the current account deficit shrinks. Manufacturing jobs are expected to rise as a result — through import substitution and increased exports.

#7 US Treasury Market
USTs are expected to decline as the global reserve asset, motivated by long-term negative real interest rates and shrinking current account deficits.

Central bank holdings of Gold and commodities are likely to increase as distrust of fiat currencies grows, with no obvious successor to US hegemony.
#7 Nuclear Power
Investment in nuclear power is expected to skyrocket as it is recognized as the only viable long-term alternative to base-load power generated by fossil fuels. Reactors will be primarily fueled by coated uranium fuels (TRISO) that remove the risk of a critical meltdown.

TRISO particles consist of a uranium, carbon and oxygen fuel kernel encapsulated by three layers of carbon- and ceramic-based materials that prevent the release of radioactive fission products – Energy.gov
Thorium salts are an alternative but the technology lags a long way behind uranium reactors. Nuclear fusion is a wild card, with accelerated development likely as AI is used to solve some of the remaining technological challenges.
#8 Artificial Intelligence (AI)
Scientific advances achieved with the use of AI are expected to be at the forefront in engineering and medicine, while broad productivity gains are likely as implementation of AI applications grows.
#9 Semiconductors
Demand for semiconductors and micro-processor is likely to grow as intelligent devices become the norm across everything from electric vehicles to houses, appliances and devices.

#10 Industrial Commodities
Demand for industrial commodities — lithium, copper, cobalt, graphite, battery-grade nickel, and rare earth elements like neodymium (used in high-power magnets) — are expected to skyrocket as the critical materials content of EVs and other sophisticated devices grows.
Expected supply shortfall by 2030:

Prices will boom as demand grows, increases in supply necessitate higher marginal costs, and inflation soars.
#11 Stock Market Boom
Stocks are expected to boom, fueled by negative real interest rates, high inflation and productivity gains from AI and nuclear.
#12 Save 50% on a New Subscription
Conclusion
There is no cause for complacency — many challenges and pitfalls face developed economies. But we so often focus on the threats that it is easy to lose sight of the fact that the glass is more than half full.
Our long-term strategy is overweight on real assets — stocks, Gold, commodities and industrial real estate — and underweight long duration financial assets like USTs.
Acknowledgements


 Treasury debt held by the public is projected to rise to a precarious 160% of GDP by 2050.