Australia: Major banks

Summary

Our review of APRA’s June 2019 quarterly report on the four major banks — Commonwealth, Westpac, ANZ and NAB — concludes that they are collectively priced at a 16.5% premium over fair value.

Technically, the ASX 300 Banks Index ($XBAK) is experiencing secondary selling pressure and a correction is likely.

A correction would reduce the premium over fair value and may present buy opportunities.

Valuation

We project:

  • long-term asset growth at 3.0% p.a. (down from 4.0%);
  • net interest margins at 1.65% of average total assets (down from 1.70%);
  • non-interest operating income of 0.5%;
  • operating expenses at 1.05% (previously 1.10%);
  • provisions for bad/doubtful debts averaging 0.2%;
  • additional equity capital required of $12 billion; and
  • a 30% tax rate.

That delivers a forward PE of 16.9 based on a market cap of $399 billion.

We estimate that the major banks are priced at a 16.5% premium over fair value, based on a 12-year payback period*.

*Note to readers: we have simplified our model by removing the margin of safety and use a lower payback period instead.

Technical Analysis

The ASX 300 Banks index retreated below its rising trendline, warning of a correction. Follow-through below support at 7600 would strengthen the signal, with a target of primary support at 6750.

ASX 300 Banks Index

Book Growth

Total assets are the primary engine of bank revenue. Heady growth of the last two decades ended in 2015, when the ratio of total assets to nominal GDP (right-hand scale) started to decline. Nominal GDP also slowed (5.4% p.a. in June 2019) and is likely to restrict future book growth.

Majors: Total Assets Annual Growth and compared to Nominal GDP

Household debt near saturation level, at close to 200% of disposable income, is another headwind to future book growth.

Australia: Household Debt to Disposable Income

Total asset growth of the major four banks slowed to 1.4% for the twelve months ended June 2019 and we have reduced our long-term projection to 3.0% per year.

Margins

RBA rate cuts are squeezing net interest margins, currently 1.73%, and we expect a long-term average of 1.65% of total assets.

Majors: Income & Expenses

Expenses declined to 1.09% of total assets but non-interest income, at 0.56%, is falling even faster.

Non-Interest Income

Fees and commissions — the major component of non-interest income — have suffered the largest falls. Transaction-based fees are the worst performer, while declining credit growth has reduced lending-based fees. The sharp drop in other fees, to 0.19%, is likely to be permanent as banks shed their wealth management operations.

Majors: Fees

We project non-interest income to average 0.50% of total assets in the long-term.

Expenses

Operating expenses declined to 1.09% of total assets, as the majors attempt to cut costs in line with income, but personnel costs have proven sticky and are falling at a slower rate.

Majors: Operating Expenses

Non-Performing & Past Due Assets

Charges for bad and doubtful debts remain low at 0.09% of total assets but we expect a long-term average of 0.20%.

Majors: Charges for Bad & Doubtful Debts

Impaired loans are falling as a percentage of total loans and advances but past due loans have climbed to 0.6%, reflecting mortgage stress.

Majors: Impaired Assets

Provisions for impaired loans, however, are reasonable at 95.8% of impaired facilities including security held.

Majors: Provisions for Impaired Assets

Capital

Common equity Tier 1 capital (CET1) remains low, with a CET1 capital ratio of 10.8% in June 2019, based on risk-weighted assets. CET1 as a percentage of total assets is a low 4.96%.

The Reserve Bank of New Zealand has called for “more skin in the game“, asking the big four Australian banks to increase their capital holdings in New Zealand subsidiaries by $12 billion:

The RBNZ proposal calls for systemically important banks to hold a minimum of 16% Tier 1 capital against risk-weighted assets, of which 6% would be a regulatory minimum and 10% would act as a counter-cyclical buffer to absorb losses without triggering “resolution or failure options”.

A similar move by APRA is unlikely but RBNZ presents a problem for the big four banks as they will have to raise additional equity to capitalize their NZ subsidiaries. One alternative is to raise equity through a separate listing of their NZ subsidiaries but this is still likely to dilute returns on equity.

Return on Equity

Declining return on assets and increased capital requirements are both exerting downward pressure on return on equity (ROE), from a peak of 20.5% in 2007 to 9.7% in March 2019.

Majors: Return on Total Assets & Return on Equity

Management & Culture

Australian regulator APRA is suffering from regulatory capture. A 146-page capability review, stemming from David Murray’s Financial System Inquiry found APRA “slow, opaque, inefficient, and in urgent need of a culture and leadership overhaul.”

Disclosure

Staff of The Patient Investor may directly or indirectly own shares in the above companies.

ASX hesitates in its downward slide

There is a hint of optimism in the air, with the year-on-year decline in housing prices slowing, to around -5% nationally, on the back of lower interest rates.

Housing

The ASX 200 hesitated in its downward slide but is still likely to test support at 6400. Breach would offer a target of 5400.

ASX 200

Iron ore continues to trade in a narrow range above short-term support at $90, suggesting continuation of the down-trend. Breach would offer a medium-term target of $80 per ton.

Iron Ore

The ASX 300 Metals & Mining index is testing long-term support at 4100. Breach would complete a head and shoulders reversal, with a target of 3400.

ASX 300 Metals & Mining

The Financial sector hesitated slightly, after a sharp fall last week. The rebound was undermined by an ANZ profit downgrade:

ANZ today announced its second half 2019 Cash Profit will be impacted by a charge of $559m (after-tax) as a result of increased provisions for customer related remediation.

Major banks’ net interest margins are also under increasing pressure as the RBA lowers interest rates.

Net Interest Margins

Expect ASX 200 Financials to test primary support at 6000. Breach would signal a primary decline, with a target of 5200.

ASX 200 Financials

REITs are surprisingly soft in a financial market desperate for yield. But there is wide disparity in the sector, with BWP for example surging, while office and industrial fund Dexus (DXS) is undergoing a sell-off.

ASX 200 REITs

We maintain exposure to Australian equities at 25% of portfolio value, with a focus on defensive and contra-cyclical stocks, because of our bearish long-term outlook.

Australia: The elephant in the room

June quarter real GDP growth slowed to an annual 1.4%, the lowest since the 2008 global financial crisis (GFC). Major contributors to growth are household consumption, public demand and exports; while the biggest handbrake is investment.

Australia: GDP

A quick look at the RBA chart shows that consumption is slowing but at a slower rate than disposable income. Households are dipping into savings to support consumption, with the savings ratio (savings/disposable income) declining to near GFC lows.

Australia: Disposable Income, Consumption and Savings

Gerard Minack warned of the danger that households will dramatically increase savings, and cut consumption, if employment prospects grow cloudy.

That brings us back to investment. Low investment is a drag on employment growth.

Australia: Job Ads

Low interest rates, on the other hand, are a tailwind at present. They seem to have shored up housing prices,

Australia: Housing

And states are taking advantage of ultra-low interest rates to boost infrastructure spending.

But low interest rates are a double-edged sword. Bank net interest margins are under pressure.

Australia: Bank Net Interest Margins

And credit growth is plunging.

Australia: Credit Growth

The housing recovery will be short-lived if there is not a dramatic increase in loan approvals.

Australia: Housing Loans

AMP chief economist Shane Oliver believes that:

“growth will remain soft and that the RBA will have to provide more stimulus – by taking the cash rate to around 0.5% and possibly consider unconventional monetary policy like quantitative easing. Ideally the latter should be combined with fiscal stimulus which would be fairer and more effective. While Australian growth is going through a rough patch with likely further to go, recession remains unlikely barring a significant global downturn.”

But that ignores two factors:

  1. increased pressure on bank net interest margins from lower interest rates; and
  2. the elephant in the room: China.

China: Activity Levels

China’s economic model is built on a shaky foundation and trade war with the US is likely to expose the flaws.

Chinese leaders are growing increasingly worried about the economy. Premier Li Keqiang said at this week’s State Council meeting:

“The current external environment is increasingly complex and grim.
….Downward pressure on the domestic economy has increased.”
(Trivium)

Twitter: Simon Ting

BEIJING, Sept. 5 (Xinhua) — Chinese and U.S. chief trade negotiators agreed on Thursday to jointly take concrete actions to create favorable conditions for further consultations in October.

The agreement was reached in a phone conversation Chinese Vice Premier Liu He, also a member of the Political Bureau of the Communist Party of China Central Committee and chief of the Chinese side of the China-U.S. comprehensive economic dialogue, held upon invitation with U.S. Trade Representative Robert Lighthizer and Treasury Secretary Steven Mnuchin. (Xinhua)

…Extend and pretend. Neither side wants a full-blown trade war. But they are miles away from an agreement.

Interest spreads hold sway over the global economy

An inverted yield curve is a reliable predictor of recessions but it also warns of falling bank profits. When the spread between long-term Treasury yields and short-term rates is  below zero, net interest margins are squeezed.

Yield Differential (10y - 3m)

In a normal market, with a steep yield curve, net interest margins are wide as bank’s funding maturity is a lot shorter than their loan book. In other words, they borrow short and lend long. Few bank deposits have maturities longer than 3 to 6 months, while loans and leases have much longer maturities and command higher interest rates.

When the yield curve inverts, however, the spread between long and short-term rates disappears and interest margins are squeezed. Not only is that bad for banks, it’s bad for the entire economy.

When their interest margins are squeezed, banks become risk averse and lending growth slows. That is understandable. When interest margins are barely covering operating expenses, banks cannot afford credit write-downs and become highly selective in their lending.

Slowing credit growth has a domino-effect on business investment and consumer spending on durables (mainly housing and automobiles). If there is a sharp fall in credit growth, a recession is normally not far behind1.

Bank Loans & Leases

Right now, the Fed is under pressure to cut interest rates to support the US economy. While this would lower short-term rates and and may flatten the yield curve, cutting interest rates off a low base opens a whole new world of pain.

Quartz this week published a revealing commentary on the damage that negative interest rates in developed economies are doing to bank net interest margins :

The problem for commercial banks is that government bond and mortgage interest rates keep going lower, but it isn’t as easy to cut deposit rates — the rate at which banks themselves borrow from customers — at the same pace. After all, it’s tough to convince people to keep deposits in an account that returns less than they put in (even though this already happens, invisibly, through inflation).

Bank Net Interest Margins in Developed Countries

Ultra-low interest rates are likely to squeeze bank margins in a similar way to the inverted yield curve. And with a similar impact on credit growth and the economy.

If I was Trump I would be pleading with the Fed not to cut interest rates.

Footnote:
1. The NBER declared a recession in 1966 when the S&P 500 fell 22% but later changed their mind and airbrushed it out of history.

ASX 200 and the Banks

The ASX 200 retreat below support level at 6350 has been gentle, with a long tail indicating that buying support remains. The Trend Index likewise shows only a moderate decline. Respect of support at 6000 would be a bullish sign.

ASX 200

Financials are the largest sector, comprising 32.1% of the ASX 200 according to S&P Indices. Retracement has so far been gentle and respect of the new support level at 6000 would be a bullish sign.

ASX 200 Financials

Apart from a declining housing market and the RBNZ call for more than $8 billion in additional equity capital (estimated by S&P Global Ratings), the four major banks face declining margins.

Net Interest Income (as % of Total Assets) has rallied since 2015 but remains in a long-term down-trend, with a projected average of 1.7%. Fee income (right-hand scale) has declined to below 0.50% of total assets, while other income (RHS) fluctuates around 0.20%.

Banks Income as % of Total Assets

Source: APRA – Major Banks

If we compare income to operating expenses, the gap between non-interest income (fees, commissions & other income) and operating expenses is widening. Combined with declining net interest margins and increasing capital requirements, the heady days of strong profit growth may be nearing an end.

Banks Income & Expenses as % of Total Assets

Source: APRA – Major Banks

I am cautious of Australian banks, more because of the headwinds they face over the next two years than the long-term outlook, but declining margins do not help. We hold more than 40% in cash and fixed interest in the Australian Growth portfolio.

Materials (the second largest sector at 18.1%) are undergoing a modest correction. Respect of support at 12500 would be a bullish sign. Declining Money Flow peaks, however, warn of strong selling pressure and a test of 12000 remains likely.

ASX 200 Materials

Australian banks under selling pressure

The ASX 300 Banks index are a major drag on the broad market index. Having respected resistance at 8500, a test of primary support at 8000 is likely. Twiggs Trend Index peaks below zero warn of strong selling pressure.

ASX 300 Banks

Return on equity is falling.

Australian Banks Return on Equity

A combination of narrow interest margins.

Bank Net Interest Margins

Soaring household debt.

Bank Net Interest Margins

And rising capital requirements as APRA desperately tries to protect their glass jaw.

Bank Capital Ratios

Don’t let the ratios fool you. They are based on risk-weighted assets. Common Equity Tier 1 (CET1) leverage ratio for at least one of the majors is as low as 4.0 percent.

Flattening yield curve & low bank interest margins

The Yield Differential, calculated by subtracting 3-month from 10-year Treasury Yields, is trending lower. This warns that the yield curve is flattening but we are still above the danger area below 1.0 percent.

Yield Differential: 10-Year minus 3-Month Yields

A flat yield curve squeezes bank interest margins and often precedes a credit contraction.

Large US Banks: Net Interest Margins

But there is little sign of slowing credit growth so far.

US Bank Loans & Leases: Annual Growth

The St Louis Fed Financial Stress Index (STLFSI) continues to indicate low market stress.

St Louis Fed Financial Stress Index

The STLFSI measures the degree of financial stress in the markets and is constructed from 18 weekly data series: seven interest rate series, six yield spreads and five other indicators. Each of these variables captures some aspect of financial stress. Accordingly, as the level of financial stress in the economy changes, the data series are likely to move together.

JP Morgan earnings dip but stock rallies

First of the financial heavyweights to report first-quarter (Q1) earnings this week, JP Morgan (JPM) reported a 7 percent fall in earnings per share ($1.36) compared to the first quarter of last year ($1.46). The fall was largely attributable to a 90 percent increase in provision for credit losses for the quarter, to $1.8 billion, primarily from a sharp increase in net charge-offs in the Consumer division but also exposure to Oil & Gas and Metals & Mining in Investment Banking.

Tier 1 Capital (CET1) improved to 11.8% (Q1 2015: 10.7%) of risk-weighted assets, while Leverage (SLR) improved to 6.6% (Q1 2015: 5.7%).

The dividend was held at 44 cents (Q1 2015: 40 cents), increasing the payout ratio to a modest 32% from 27% in Q1 2015.

The monthly chart shows long-term Momentum is slowing, with JPM forming a broad top above $54. Declining peaks since August 2015 warn of a primary down-trend and breach of $54 would confirm, offering a target of $40*.

JP Morgan Chase

* Target calculation: 55 – ( 70 – 55 ) = 40

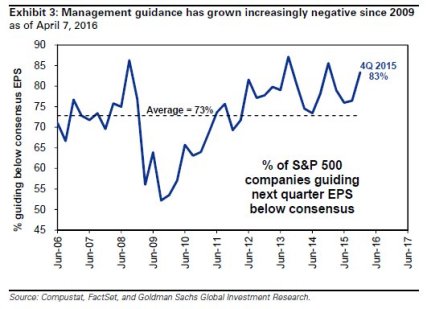
The market responded well to ‘positive’ news that JPM beat its earnings estimate, boosting the stock by 4.6%. This is a game we will see a lot more of this year: give really low guidance if you expect a bad quarter. When the result comes out, the gullible will focus on the fact that you beat your estimate rather than that your earnings are falling. This chart from Zero Hedge shows the rising percentage of companies guiding next quarter earnings below consensus:
Earnings Guidance

Don’t be mis-led by the latest ‘froth’. The reality for the banking sector is net interest margins are near record lows and credit losses are rising.

Major US Banks Net Interest Margins