Fed shock – really?

Stocks plunged on indications that the Fed would slow further rate cuts after announcing a 25-basis-point cut at the FOMC press conference on Wednesday.

Really? That could be seen coming for months. The economy has proven resilient, unemployment is low, and retail sales are growing. The obvious question is: “Why cut rates at all?”

FOMC Decision

As expected, Chairman Jerome Powell announced a 25-basis-point rate cut, lowering the fed funds rate target to 4.25% to 4.5%.

Financial markets were spooked by the sharp jump in FOMC projections for rate cuts next year. The Dot Plot now centers on a further 50 basis points of rate cuts in 2025, a target range of 3.75% to 4.0%.

FOMC Dot Plot

Compare that to the September projection below, which was equally divided between 100 and 125 basis points of cuts next year, a range of 3.0% to 3.5%.

FOMC Dot Plot - September

Powell explained that:

  • The economy is “strong” and has made good progress towards the Fed’s goals.
  • The job market has cooled but remains “solid.”
  • Inflation continues to move towards the Fed’s 2% target.

The Fed Chair provided further background in answers to reporters’ questions:

  • “We feel that slowing the pace of future adjustments seems prudent now, especially as we expect inflation to be stickier than we initially thought.”
  • “Some FOMC members did cite future inflationary fiscal policy as a concern.”
  • “Most forecasters keep calling for a slowdown in economic growth, but we haven’t seen it yet and don’t see one happening soon. The US economy is doing great.”
  • “We’re not too worried (about loose financial conditions). Both inflation and labor have cooled, so our policy is working. Financial conditions aren’t impeding us.”

Fed Balance Sheet

Powell announced that QT would continue at the same rate, but the rate offered on reverse repo (RRP) would be lowered, which may encourage further money market outflows into the T-Bill market. Total Fed holdings of Treasuries and mortgage-backed securities (MBS) have fallen by $1.9 trillion since their peak of $8.5 trillion in 2022.

Fed Balance Sheet: Treasuries and Mortgage-Backed Securities (MBS)

Only another $6.0 trillion to go. 😟

Treasury Markets

Ten-year Treasury yields jumped. Breakout above resistance at 4.5% would offer a target of 5.0%, which would be bearish for stocks and precious metals.

10-Year Treasury Yield

Stocks

The S&P 500 plunged to support at 5860. Breach would signal a test of 5700.

S&P 500

Tesla (TSLA) dipped sharply after a spectacular two months, peaking at +117%, compared to Nvidia (NVDA) at -6.6%.

Top 7 Technology Stocks

The weekly chart of the equal-weighted S&P 500 index ($IQX) shows a breach of support at 7150, likely headed for a test of 6900. The lower Trend Index peak identifies selling pressure but is still above zero, indicating that the primary trend remains intact.

S&P 500 Equal-Weighted Index - Weekly

Financial Markets

The Chicago Fed National Financial Conditions Index dipped to -0.66% on December 13, indicating “loose” monetary conditions. Moody’s Baa corporate bond spreads are also at a thirty-year low, reflecting easy credit conditions.

Chicago Fed National Financial Conditions Index & Moody's Baa Corporate Bond Spreads

Bitcoin retraced to test support at $100K, but the strong uptrend still signals abundant financial market liquidity.

Bitcoin (BTC)

Dollar & Gold

The Dollar has strengthened in response to rising Treasury yields, with the Dollar Index breaking resistance at 108.

Dollar Index

The Bank of Japan may be forced to raise interest rates again to support the Yen, which could cause an outflow from US financial markets as carry trades unwind.

Japanese Yen - Weekly

Gold broke support at $2,625 per ounce, signaling a test of primary support at $2,550.

Spot Gold

The long-term uptrend, shown on the weekly chart below, remains intact.

Spot Gold - Weekly

Silver similarly broke support at $30 per ounce, but a breach of primary support at $26.50 remains unlikely.

Spot Silver - Weekly

Conclusion

The Fed is riding a wave of deflationary pressure from the global economy, led by China. The bear market in crude oil and copper signals that global demand is contracting. Low inflation should enable further rate cuts next year, but the pace will likely slow as the Fed is wary of a resurgence in domestic demand.

The prospect of inflationary economic policies from the new administration could set off a public feud between Donald Trump and the Fed chairman. Stimulating an economy that is already close to full employment would force the Fed to hike rates to ease inflationary pressures, attracting the ire of the new president.

US financial markets, with rising long-term Treasury yields, are sucking up global liquidity and more than offsetting Fed tightening (QT). The strong Dollar increases pressure on international borrowers in the Eurodollar market as domestic exchange rates weaken. The Bank of Japan may also be forced to hike interest rates again to support the Yen, causing further unwinding of the carry trade and outflows from US financial markets.

The S&P 500 is overdue for a correction, but the primary uptrend is unlikely to reverse unless there is a sharp contraction in financial market liquidity.

Gold and silver are undergoing a sharp correction, but the primary uptrend remains intact. Two long-term fundamental trends support precious metals. First, central banks are increasing their gold reserves and reducing currency reserves as the global sovereign debt bubble expands. Second, in response to a collapsing domestic real estate market, Chinese investors are switching focus to gold and silver as a store of wealth.

Acknowledgments

S&P 500 makes new high

Bond markets were closed Monday for Columbus Day, but financial market conditions show further signs of easing. Equities powered ahead, with the S&P 500 making a new high at 5859.

Stocks

The S&P 500 broke resistance at 5800, strengthening commitment to our target of 6000 by year-end. Rising Trend Index troughs signal long-term buying pressure.

S&P 500

The advance is broad, with the equal-weighted index ($IQX) breaking resistance at its previous high of 7300. This offers a target of 7500.

S&P 500 Equal-Weighted Index

Financial Markets

Moody’s Baa corporate bonds spread narrowed to 1.54%, signaling ready availability in credit markets.

Moody's Baa Corporate Bond Spreads
<id=”#clickthrough”>
Bitcoin also broke above its six-month trend channel, signaling strong liquidity in financial markets.

Bitcoin (BTC)

Dollar & Gold

The Dollar Index continues to strengthen as Treasury yields rise. This may seem counterintuitive, given the prospect of further rate cuts ahead, but the strong September jobs report has increased bond market concerns about an inflation recovery.

Dollar Index

Gold found support at $2,600 per ounce but has hesitated at $2,650. A lower Trend Index peak would warn of another test of support at $2,600. The Shanghai Gold Exchange no longer trades at a premium, with the iAu99.99 contract quoted at 605.04 RMB/gram, equivalent to $2,643 per ounce at the current exchange rate of 7.12 CNY to the Dollar.

Spot Gold

Silver is also hesitant, testing short-term support at $31 per ounce.

Spot Silver

Crude Oil

Brent crude is retracing to test support at $76 per barrel after Israel confirmed they would not strike Iranian oil targets and OPEC cut their oil demand forecast for 2024 and 2025.

Brent Crude

Brent [crude] fell 5%, or more than $4, in after-hours trading following a media report that Israeli Prime Minister Benjamin Netanyahu told the U.S. that Israel is willing to strike Iranian military targets and not nuclear or oil ones…..

OPEC on Monday cut its forecast for global oil demand growth in 2024 and also lowered its projection for next year, marking the producer group’s third consecutive downward revision. China, the world’s largest crude oil importer, accounted for the bulk of the 2024 downgrade as OPEC trimmed its growth forecast for the country to 580,000 barrels per day (bpd) from 650,000 bpd. China’s crude imports for the first nine months of the year fell nearly 3% from last year to 10.99 million bpd, data showed. Declining Chinese oil demand caused by the growing adoption of electric vehicles (EV), as well as slowing economic growth following the COVID-19 pandemic, has been a drag on global oil consumption and prices. (Reuters)

Base Metals

Copper is testing short-term support at $9,500 per tonne after it respected resistance at $9,900. Breach of support would offer a target of $9,250.

Copper

Aluminum similarly retreated from resistance at $2,650 per tonne and will likely test support at $2,500.

Aluminum

China’s deflationary pressures also worsened in September, according to official data released on Saturday. A press conference the same day left investors guessing about the overall size of a stimulus package to revive the fortunes of the world’s second-largest economy.

“The lack of a clear timeline and the absence of measures to address structural issues, such as weak consumption and reliance on infrastructure investments, have only increased ambiguity amongst market participants,” noted Mukesh Sahdev, the global head of commodity markets-oil at Rystad Energy. (Reuters)

Iron Ore

Iron ore is expected to retrace to test support at $100 per tonne following a sharp rise after China’s stimulus announcement.

Iron Ore

Conclusion

Financial markets show signs of a promising rise in liquidity, with falling corporate bond spreads and Bitcoin breakout above its six-month trend channel. The S&P 500 responded with breakout above 5800, strengthening our commitment to a target of 6000.

Gold and silver display strong uptrends but hesitate in response to a rising Dollar. Increased fears of an inflation rebound are behind the recent rally in long-term Treasury yields and the Dollar. We expect the uptrend in gold and silver to continue, with low real interest rates, whether or not inflation fears fade.

We expect that China will struggle to recover from its current economic slump. The announced stimulus program remains vague and does not address the underlying issue of weak domestic consumption. Deflationary pressures will likely keep a lid on crude oil and industrial metal prices for several years.

Low crude oil prices are also likely to keep inflation in check, leading to low long-term interest rates in the West.

Acknowledgments

Nvidia leads the plunge

Stocks plunged after Nvidia (NVDA) fell by 9.5% on reports that the US Department of Justice subpoenaed the chipmaker over complaints that it is violating antitrust laws. (Quartz)

Weak US and China manufacturing activity has also been cited as a cause for market bearishness, but that seems unlikely.

Stocks

Selling in Nvidia [cerise] soon spread to other big-name stocks, with all seven mega-caps closing lower on Tuesday.

Top 7 Technology Stocks

The fall breached short-term support on the S&P 500 at 5550, signaling a correction to test 5400.

S&P 500

The equal-weighted index ($IQX) retraced to test support at 7000. Trend Index troughs above zero indicate longer-term buying pressure. Breach of support would offer a target of 6800, but respect is as likely to confirm our target of 7400.

S&P 500 Equal-Weighted Index

Small caps also weakened, with the Russell 2000 iShares ETF (IWM) breaching support at 215 to indicate another test of long-term support at 200. A Trend Index peak at zero warns of selling pressure.

Russell 2000 Small Cap ETF (IWM)

ISM Manufacturing

The ISM Manufacturing PMI edged up to 47.2% in August. Although the cyclical sector is a relatively small percentage of the overall economy, it has a disproportionate impact during recessions as it sheds a large number of jobs. This is the sixth consecutive month of contraction (below 50), but the uptick indicates the contraction is slowing.

ISM Manufacturing PMI

New Orders are also contracting, indicating further headwinds ahead.

ISM Manufacturing New Orders

Also, the Prices sub-index continues to expand, warning of persistent inflationary pressure.

ISM Manufacturing Prices

However, the bearish outlook for manufacturing is offset by solid growth in other cyclical sectors, with combined employment in manufacturing, construction, and transport & warehousing reaching 27.85 million.

Manufacturing, Construction, and Transport & Warehousing

Non-residential construction spending continues to strengthen even when adjusted for inflation, benefiting from government programs to re-shore critical supply chains.

Non-Residential Construction Spending adjusted for inflation

China Manufacturing Activity

The official National Bureau of Statistics manufacturing PMI for China fell to 49.1 in August, indicating contraction. However, the downturn is contradicted by a rise in the private sector Caixin PMI to 50.4%:

Caixin China Manufacturing PMI & NBS China Manufacturing PMI

Financial Markets

Credit markets still reflect easy financial conditions, with Moody’s Baa corporate bond spread at a low 1.69%. Spreads above 2.5% indicate tight credit.

Moody's Baa Corporate Bond Spreads

However, Bitcoin has respected resistance at $60K [red line], warning of shrinking liquidity.

Bitcoin (BTC)

Treasury Markets

Ten-year Treasury yields are again testing support at 3.8%. Trend Index peaks below zero warn of long-term selling pressure. Breach of support would indicate another attempt at 3.7%.
10-Year Treasury Yield

Low LT yields are bearish for the Dollar and bullish for gold.

Dollar & Gold

The recent rally in the Dollar Index is losing steam. Tuesday’s weak close suggests another test of support between 100 and 101.

Dollar Index

Gold is retracing to test support at $2,475 per ounce. Trend Index troughs high above zero indicate long-term buying pressure. Respect would indicate another advance to test $2,600. Breach is less likely but would warn of a correction.

Spot Gold

Silver is more bearish, and a breach of support at $27.50 per ounce would test the August low at $26.50.

Spot Silver

Energy

Brent crude broke support at $76 per barrel and is headed for a test of long-term support at $73.

Brent Crude

Nymex WTI crude similarly broke support at $72 per barrel, offering a target of $68. We expect the DOE to increase purchases to re-stock the Strategic Petroleum Reserve below $70, providing support for shale drillers whose margins are squeezed at these levels.

Nymex WTI Crude

Uranium

Uranium continues its downtrend, with the Sprott Physical Uranium Trust (SRUUF) headed for another test of support at 17.

Sprott Physical Uranium Trust (SRUUF)
However, we are bullish on the long-term prospects as resistance to the expansion of nuclear energy fades.

EU's New Pro-Nuclear Energy Chief

Base Metals

After its recent rally, copper is testing short-term support at $9,000 per tonne. Breach is likely and would warn of another decline as China’s economy slows.

Copper

Aluminum leads the way, breaking short-term support to warn of another test of the band of long-term support between $2,100 and $2,150 per tonne.

Aluminum

Iron & Steel

Iron ore recovered above $100 per tonne, but respect of the descending trend line would warn of another decline. Reversal below $100 would confirm our target of $80.


Iron Ore

Conclusion

Investors are jumpy as mega-cap stocks trade at inflated prices, boosted by passive investment inflows from index ETFs. We expect the S&P 500 to find support at 5400 and maintain our target of 6000 before the end of the year.

One factor that could upset the apple cart is tightening liquidity. However, the Fed and Treasury will likely support liquidity in financial markets, at least until after the November elections. If they withdraw support, then all bets are off.

Falling crude oil prices will likely ease inflationary pressure, while a slowing Chinese economy is expected to add deflationary pressure. Long-term interest rates are expected to remain low, weakening the Dollar. Gold will likely benefit, with another attempt at our target of $2,600 per ounce.

Acknowledgments

The Fed, Treasury and liquidity

A reader asked me to please explain why liquidity is rising despite the Fed hiking rates and shrinking its balance sheet (QT) by more than $1.7 trillion.

We will try to avoid the technical jargon and stick to the basics. But it’s not always an easy concept to explain or grasp.

What is liquidity?

Liquidity is not the same as money. It is more closely related to other side of the balance sheet and is best described as the “ease of financing” or availability of credit in financial markets. It includes access to credit from the domestic banking system and bond markets, as well as international financial markets.

In Reminiscences of a Stock Operator Jesse Livermore describes the operation of the Money Post on the floor of the exchange, where brokers borrowed money overnight to finance their stock operations. We have included an excerpt where he describes the impact of tight liquidity leading up to the crash of 1907. It is worth reading: The Money Tree | Jesse Livermore

How do we measure liquidity?

We use several indicators to measure liquidity in financial markets. These include:

Commercial Bank Reserves at the Fed

Commercial bank reserves spiked up in March 2023 after the Silicon Valley Bank (SVB) debacle, when the Fed introduced the Bank Term Funding Program (BTFP). Reserves continued to climb steeply until February 2024, when inflation reared its head, before falling sharply in March and April during the tax payment season.

Commercial Bank Reserves at the Fed

Chicago Fed Financial Conditions Index

The Chicago Fed Financial Conditions Index is an excellent measure of financial market liquidity, though data is normally a week behind that of bank reserves.

Chicago Fed Financial Conditions Index

Moody’s Baa Corporate Bond Spread

Moody’s Baa corporate bond spreads are a good indicator of credit availability in bond markets. The spread measures the premium that low investment grade corporate borrowers have to pay over the risk-free Treasury rate.

Moody's Baa Corporate Bond Spreads

Bitcoin

We even use Bitcoin as the “canary in the coal mine”. Cryptocurrencies are the most liquidity-sensitive assets in financial markets and normally the first to show signs of stress.

Bitcoin climbed steeply from November ’23 until early March ’24 before stalling in March-April. Its rise in May heralded a recovery in financial market liquidity.

Bitcoin

How the Fed and Treasury influence liquidity

The most obvious way that the Fed influences liquidity is by purchasing or selling Treasury and Agency securities in financial markets.

In April 2020, the Fed purchased almost $3 trillion in securities, expanding its balance sheet (blue below). We can also see that Treasury took advantage of these Fed purchases, issuing $1.4 trillion more in securities than it needed to fund current expenditure. The surplus shows in the TGA account at the Fed (red below) and had the effect of partially offsetting the Fed’s injection of liquidity.

Chicago Fed Financial Conditions Index

In 2021, Treasury slowed their issuance of securities, as they neared the debt ceiling, and started to draw down on their TGA account at the Fed (red above). This amplified Fed QE (blue) as it also injected liquidity into financial markets. The Fed did their best to offset this by borrowing in financial markets through overnight reverse repo operations (green above) mainly from money market funds which normally invest in T-Bills and other short-dated securities.

In late 2022, the Fed announced it was going to gradually reduce its balance sheet as securities matured. The blue area below zero is referred to as quantitative tightening, or “QT”. Since then, total assets at the Fed have shrunk by roughly $1.7 trillion. Treasury also increased net issuance and started to rebuild their TGA account balance (red) above. But the Fed was again able to offset this by lowering rates offered on reverse repo and running its RRP liabilities (green) down from almost $2.4 trillion to just $371 billion at present.

The net impact of the combined operations is shown by the blue line below. The massive combined monetary easing lasted until early 2022, when tightening commenced. But tightening ended after the March ’23 banking (SVB) crisis, with the Fed injecting liquidity to prop up financial markets until March ’24. By March, inflation was starting to rebound and the Fed may have realized that they had over-egged the pudding.

Chicago Fed Financial Conditions Index

The abrupt fall in liquidity in March-April was evident not only in bank reserves but in Bitcoin and in the stock market.

Conclusion

Liquidity is again rising — as shown by the the rise in Bitcoin and the fall in Chicago Fed Financial Conditions Index. Stocks and bonds are likely to rise as a result.

Notes

There are further factors that affect financial market liquidity in the US. This can include monetary easing by foreign central banks. The PBOC may inject liquidity into financial markets in Beijing or Hong Kong but the net result may ease financial conditions in New York if US T-Bills offer higher rates of return than the equivalent security in China.

We have also seen Treasury Secretary Janet Yellen change the mix of Treasury issuance in order to reduce the impact on financial market liquidity. Reducing the amount of longer maturity Treasury notes and bonds and increasing issuance of shorter-term T-Bills also helped to boost liquidity. T-Bills are the most liquid asset on the planet, with almost infinite demand. Holding a 3-month T-Bill is like holding Dollars — they have no default or rate risk — but you get a 5.0% return on top. So issuing more T-Bills has limited impact on short-term rates, while issuing less 10-year Notes , for example, will lower long-term yields when demand exceeds supply.

Acknowledgements

Moody’s negative outlook and falling consumer sentiment

Ten-year Treasury yields continue to respect support at 4.50%. We expect another test of resistance at 5.0%.

10-Year Treasury Yield

Moody’s kept their AAA rating for the US government but changed their outlook from stable to negative. The reasons cited  — large deficits and a polarized ineffective Congress — are strong arguments for higher Treasury yields:

Moody's Rating

Japan has also broken above 150 yen to the Dollar, increasing pressure on the BoJ to relax their cap on long-term JGB yields. Any move to relax yield curve control would be likely to cause an outflow from US Treasuries and the Dollar, driving down prices.

USDJPY

Inflation

Inflation expectations are rising, with University of Michigan 1-year expectations jumping to 4.4% — and the 3-month moving average to 3.9%.

University of Michigan Inflation expectations 1-Year

Five-year expectations are also rising, reaching 3.2% in October, with the 3-month moving average at 3.0%.

University of Michigan Inflation expectations 5-Year

Higher inflation expectations add to upward pressure on long-term yields.

Financial Conditions

Financial conditions remain loose — despite the strong rise in long-term yields — with the spread between Baa corporate bonds and the equivalent Treasury yield at a low 1.84%.
Moody's Baa Corporate Bond Spreads

Economic Outlook

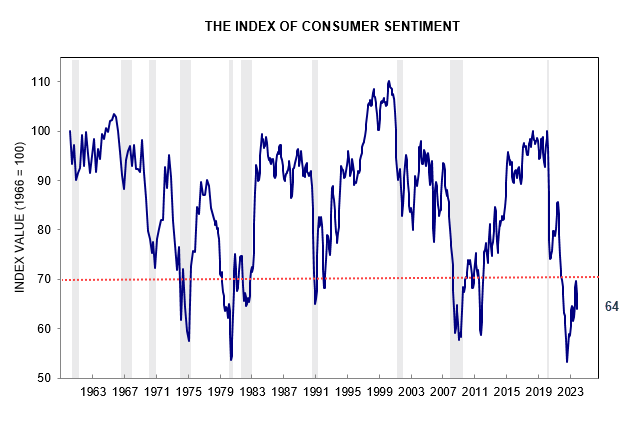
Low consumer sentiment, with the University of Michigan Index at 64, continues to warn of a recession.
University of Michigan Consumer Sentiment

Heavy truck sales — a reliable leading indicator — are falling steeply. A fall below 35,000 units would be cause for concern.

Heavy Truck Sales

Stocks

The S&P 500 ended the week stronger, with a bullish candle testing resistance at 4400.

S&P 500

Small caps continue to warn of weakness, however, with the Russell 2000 iShares ETF (IWM) likely to test primary support at 162. Trend Index peaks below zero warn of strong selling pressure. Small caps tend to outperform large caps by a wide margin in the first phase of a bull market — clearly not the case here.

Russell 2000 Small Caps iShares ETF (IWM)

Global Economy

Copper is retracing for another test of primary support at $7800 per metric ton. Breach would warn of a global recession.

Copper

Gold

Gold broke support at $1900 per ounce, indicating a test of $1900. Rising long-term interest rates are undermining investor demand for Gold.

Spot Gold

But Gold is supported by strong central bank purchases, led by China.

Central Bank Gold Purchases & Sales

Australia

The ASX 200 retreated below 7000 on Friday but a bullish close on the S&P 500 should see retracement to test resistance. Declining Trend index peaks, however, warn of rising selling pressure.

ASX 200

Conclusion

We expect upward pressure on long-term Treasury yields to continue, boosted by Moody’s negative outlook for the US, a weakening Japanese Yen and rising inflation expectations.

Declining heavy truck sales and weak consumer sentiment are bearish for the economy. The S&P 500 remains bullish but small caps are more bearish, warning that this is not a broad-based recovery.

Copper breach of $7800 per metric ton would warn of a global recession.

We remain overweight cash, money market funds, short-duration term deposits and financial securities (up to 12 months), defensive stocks, critical materials and gold.

Acknowledgements

Rising long-term rates could spoil the party

Real GDP for the September quarter reflects an annual growth rate of 2.9% for the US, well below the Atlanta Fed GDPNow estimate of 5.4%. Growth in weekly hours worked declined to 1.5% for the 12 months ended September, indicating that GDP is likely to slow further in the fourth quarter.

Real GDP & Estimated Total Weekly Hours

New Orders

Manufacturers’ new orders for durable goods, adjusted for inflation, shows signs of strengthening.

Manufacturers' New Orders: Durable Goods

Transport

Transport indicators show a long-term down-trend but truck tonnage has grown since May 2023.

Truck Tonnage

Container (intermodal) rail freight likewise grew for several months but then turned down in August..

Rail Freight

Growth in weekly payrolls of transport and warehousing employees slowed to an annual rate of 3.6% in September but remains positive.

Transport & Warehousing Weekly Payrolls

Consumer Cyclical

Light vehicle sales continue to trend higher, suggesting consumer confidence.

Light Vehicle Sales

Housing

New housing starts (purple) have been trending lower since their peak in 2022 but new permits (green) are now strengthening.

Housing Starts & Permits

New single family houses sold are trending higher.

New Home Sales

Despite a steep rise in mortgage rates. In a strange twist, higher rates have reduced the turnover of existing homes on the market, with owners reluctant to give up their low fixed rate mortgages. Low supply of existing homes has boosted sales of new homes, lifting employment in residential construction.

30-Year Mortgage Rate

The National Association of Home Builders Housing Market Index (HMI), however, reflects falling sentiment — likely to be followed by declining new home sales and housing starts.

NAHB/Wells Fargo Housing Market Index

HMI is a weighted average of three separate component indices. A monthly survey of NAHB members asks respondents to rate market conditions for the sale of new homes at the present time; sales in the next six months; and the traffic of prospective buyers. (NAHB)

Financial Markets

The ratio of bank loans and leases to GDP declined to 0.44 in the third quarter but remains elevated compared to levels prior to 2000.

Bank Loans & Leases

The cause of ballooning debt is not hard to find, with negative real interest rates for large parts of the past two decades.

Real Fed Funds Rate

Now real rates are again positive and money supply is contracting relative to GDP, the days of easy credit are at an end. A significant contraction of credit is likely unless the Fed intervenes, either by cutting rates or expanding its balance sheet to inject more liquidity into the system.

M2 Money Supply/GDP

Commercial banks continued to raise lending standards in Q3, making credit less accessible.

Bank Lending Standards

Conclusion

This is not a normal market cycle and investors need to be prepared for sudden shifts in financial markets.

The US economy is slowing but cyclical elements like light vehicle sales and new home sales are holding up well.

The rise in long-term Treasury yields, however, is likely to cause a sharp credit contraction if the Fed does not intervene by cutting rates or expanding its balance sheet (QE).

10-Year Treasury Yields

The Fed is reluctant to intervene because this would undermine their efforts to curb inflation. But they may be forced to if there is a credit event that unsettles financial markets.

Moody's Baa Corporate Bond Yield minus 10-Year Treasury Yield

Fed intervention is unlikely without a steep rise in credit spreads. But would be especially bullish for Gold.