Low inflation risk keeps yield curve safe
The Fed is advancing interest rates at a measured pace, with the objective of restoring balance in financial markets rather than to curbing inflationary pressures. Only if inflation spikes is the Fed likely to adopt a restrictive stance.
Elliot Clarke from Westpac sums up the FOMC (Fed Open Market Committee) view from their latest minutes:
Beginning with inflation, whereas the market has recently been concerned that inflation may be getting away from the FOMC (given annual CPI inflation at 2.5%yr and persistent strength in the oil price), the Committee is unperturbed.
Instead of the CPI, the FOMC’s benchmark remains PCE inflation, which is currently 2.0%yr on a headline basis and 1.9%yr for core…..
To see upside inflation risks build, a stronger wage inflation pulse is necessary. At present the employment cost index is only reporting “a gradual pickup in wage increases”, and the signal from other wage measures is “less clear”. Two other important considerations for the pass through of wages to activity and thus inflation is that real hourly earnings growth is currently flat and the savings rate near historic lows. The capacity of households to boost consumption and thus inflation is therefore very limited.
Hourly wage rates are growing at a gradual pace.
Personal savings are low.
And credit growth is modest.
So not much sign of inflationary pressure.
….Turning to financial conditions, as yet there is no concern of them becoming an impediment to growth or policy. The 10yr yield has moved back to the highs of 2013, but the US dollar has only partly retraced its 2017 depreciation. Further, asset markets remain near recent highs.
Equally significant however is the reference to being nearer neutral and a clear desire to keep the yield curve’s positive slope…..
We do not believe that the yield curve will invert in this instance, in part because higher deficits should see the term premium rise. However, the curve will remain comparatively flat versus history, restricting both the timing and the scale of further rate hikes. This is a key justification for both the market’s and our own view of only two further hikes in 2018 and two more in 2019 – a stark contrast to the FOMC’s seven hikes to end-2020.
A negative yield curve — when 10-year minus 3-month Treasury yields falls below zero — would give a strong recession warning. But the yield curve is only likely to invert if the Fed steps up interest rate increases. With little sign of rising inflationary pressure at present, the prospect seems remote.
Stephen Roberts: China and US/Australian Interest Rates
The Fed and Alice in Wonderland
In Lewis Carroll’s Alice in Wonderland a young Alice experiences a series of bizarre adventures after falling down a rabbit hole. The new Fed Chairman Jerome Powell will similarly have to lead global financial markets through a series of bizarre, unprecedented experiences.
Down the Rabbit Hole
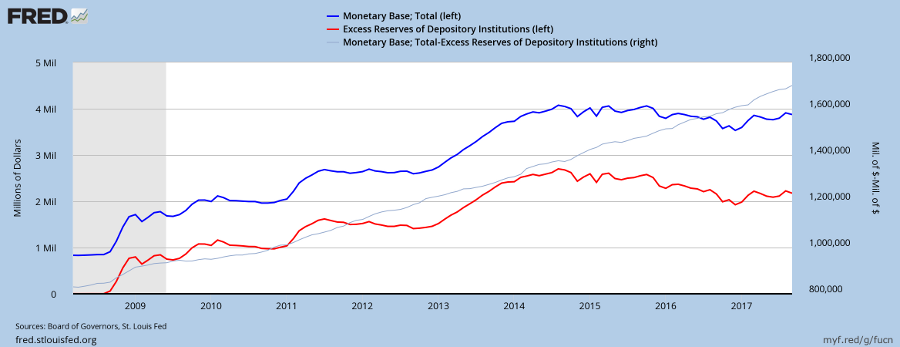
In 2008, after the collapse of Lehman Bros, financial markets were in complete disarray and in danger of imploding. The Fed, under chairman Ben Bernanke, embarked on an unprecedented (and unproven) rescue attempt — now known as quantitative easing or QE for short — injecting more than $3.5 trillion into the financial system through purchase of long-term Treasuries and mortgage-backed securities (MBS).
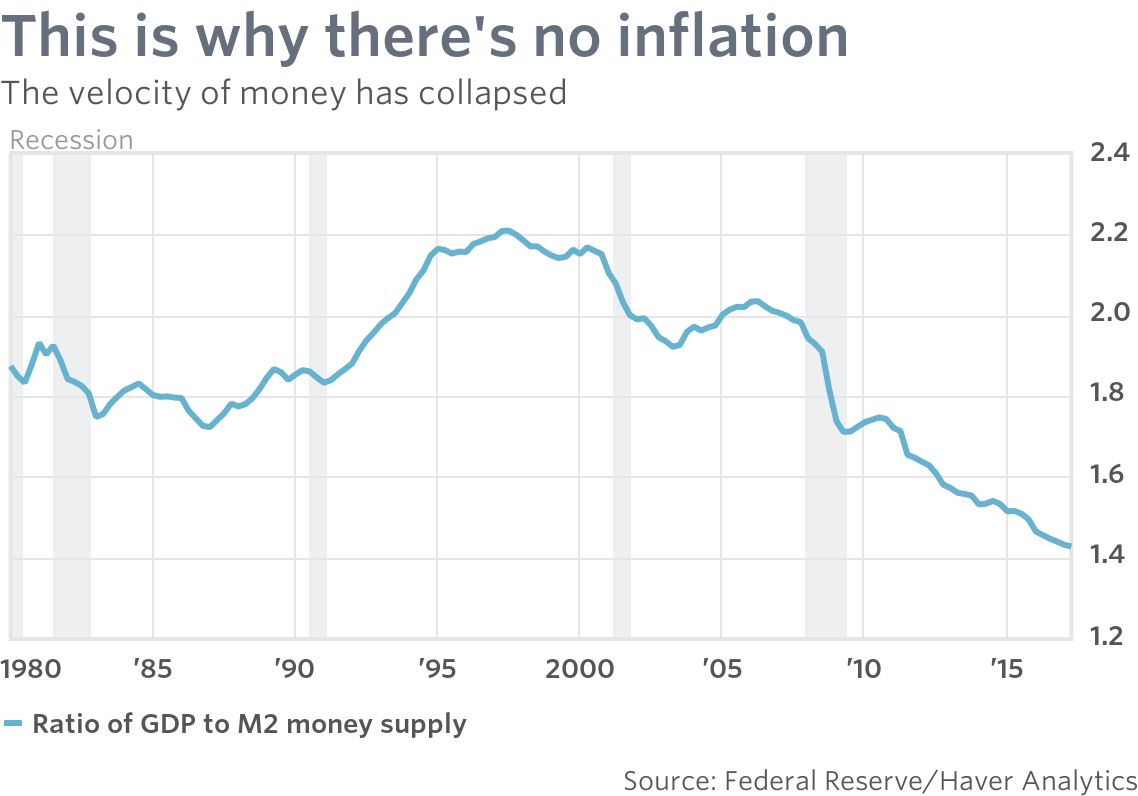
The Fed aimed to drive long-term interest rates down in the belief that this would encourage private sector borrowing and investment and revive the economy. Their efforts failed. Private sector borrowing did not revive. Most of the money injected ended up, unused by the private sector, as $2.5 trillion of excess commercial bank reserves on deposit at the Fed.
Richard Koo pointed out that the private sector will under normal cirumstances respond to lower interest rates with increased borrowing but during a financial crisis, when their balance sheets have been destroyed and their liabilities exceed their assets, their sole focus is to restore their balance sheet, using surplus cash flow to pay down debt. The only way to prevent a collapse is for the government to step in and plug the gap, borrowing surplus capital and investing this in infrastructure.
One Pill Makes you Larger
Fortunately Bernanke got the message.
… and spread the word.
And One Pill Makes you Small
Unfortunately, other central banks also followed the Fed’s earlier lead, injecting vast sums into the financial system through quantitative easing (QE).
Driving long-term yields to levels even Lewis Carroll would have struggled to imagine.
The Pool of Tears
Then in 2014, another twist in the tale. Long-term yields continued to fall in Europe and Japan, while US rates stabilised as Fed eased off on QE. A large differential appeared between US and European/Japanese rates (observable since 2014 on the above chart), causing a flood of money into the US, in pursuit of higher yields.
….. with an unwanted side-effect. The Dollar strengthened. Capital inflows caused the trade-weighted value of the US Dollar to spike upwards beween 2014 and 2016, damaging US export industries and local manufacturers facing competition from foreign imports.
The Mad Hatter’s Tea Party
A jobless recovery in manufacturing and low wage growth in turn led to the election of Donald Trump in 2016 promising increased protectionism against global competition.
Then in 2017, to the consternation of many, despite rising interest rates the US Dollar began to fall.
Learned analysis followed, ascribing the weakening Dollar to rising commodity prices and a recovery in emerging markets. But something doesn’t quite add up.
International bond investors are a pretty smart bunch. When they look at US bond markets, what do they see? The new Fed Chairman has inherited a massive headache.
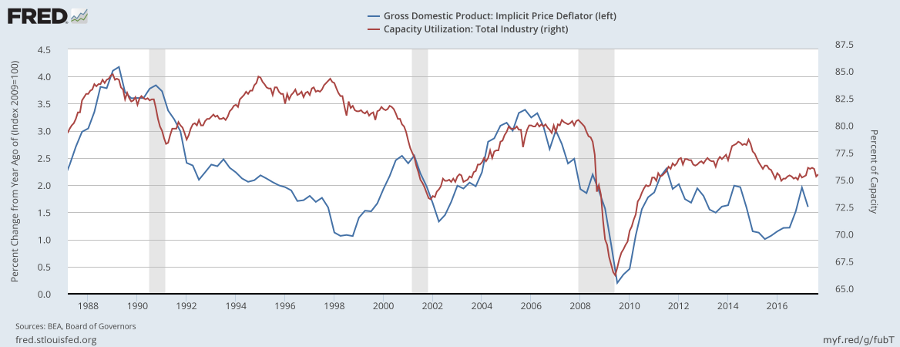
Donald Trump is determined to stimulate job growth through tax cuts and infrastructure spending. This will certainly create jobs. But when you stimulate an economy that is already at full employment you get inflation.
Who Stole the Tarts?
Jerome Powell is sitting on a powder keg. More than $2 trillion of excess reserves that commercial banks can withdraw without notice. Demand for bank credit is expected to rise as result of the Trump stimulus. Commercial banks, not known for their restraint, can make like Donkey Kong with their excess reserves provided by the Bernanke Fed.
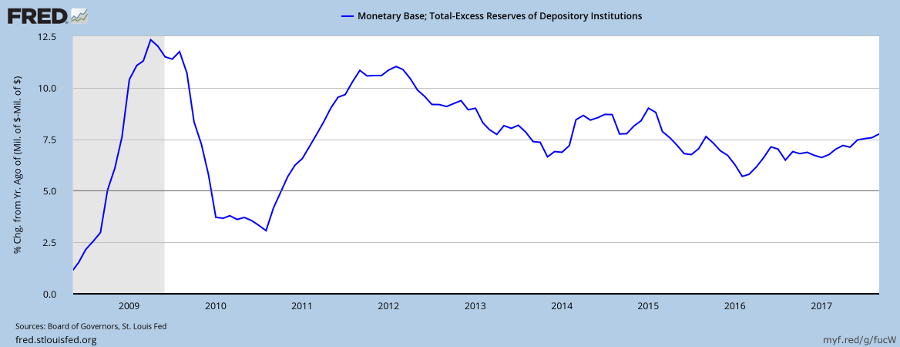
Under Janet Yellen the Fed mapped out a program to withdraw excess reserves from the market by selling down Treasuries and MBS at the rate of $100 billion in 2018 and $200 billion each year thereafter. But at that rate it will take 10 years to remove the excess.
Bond markets are worried about what will happen to inflation in the mean time.
Off With His Head
The new Fed Chair has made all the right noises about being hawkish on inflation. But can he walk the talk? Especially with his $2 trillion headache.
….and the Red Queen, easily recognizable from Lewis Carroll’s tale, tweeting “off with his head” if a hawkish Fed threatens to spoil the party.
One pill makes you larger
And one pill makes you small
And the ones that mother gives you
Don’t do anything at all
Go ask Alice
When she’s ten feet tall….When the men on the chessboard
Get up and tell you where to go
And you’ve just had some kind of mushroom
And your mind is moving low….When logic and proportion
Have fallen sloppy dead
And the White Knight is talking backwards
And the Red Queen’s off with her head
Remember what the dormouse said
Feed your head
Feed your head~ White Rabbit by Grace Slick from Jefferson Airplane (1967)
Why is the Dollar falling?
The broad, trade-weighted US Dollar index has been declining since early 2017.
This is the best explanation I have found for current US Dollar weakness. From Bank of Montreal, BMO Nesbitt Burns:
The relationship isn’t perfect, but as a general rule of thumb, the USD declines in years when global growth is above potential. In such years, strong global growth causes commodity prices to rise, which lifts commodity currencies. In addition, strong global growth normally triggers a flood of investment out of developed economies and into emerging economies. As emerging central banks intervene to slow the appreciation of their currencies from these two factors, they sell the USD against EUR and other alternative reserve currencies, thereby causing the USD to decline against both developed and emerging currencies. That dynamic helps explains the USD depreciation in 2017 as well as the 2004-2007 period. The 10Y average of the IMF’s World GDP growth rate is 3.4% and we think that is roughly potential growth. The IMF estimates that global growth will come in at about 3.6% for 2017 and accelerate to 3.7% in 2018.
In addition, the US’s twin deficit fundamental (sum of the current account deficit and fiscal or federal budget deficit as shares of GDP) is another factor that is negative for the USD. Turns in the twin deficit normally precede turns in the USD by 1-2 years and then trends match thereafter. The US’s twin deficit fundamental has been deteriorating for the past two years and is likely to deteriorate further in 2018 and beyond due in part to the tax cuts. When looking at all these factors together with the fact that USD phases tend to last 5-7 years, we feel that we have to forecast a continuation of broad USD weakness—albeit at a slower pace. We project that the broad USD index will fall 1.5% in Q1 and then 1.0% per quarter in each of the remaining three quarters of 2018.
Hat tip to David Llewellyn-Smith at Macrobusiness.
The fall in the Dollar may also be self-reinforcing, as Enda Curran at Bloomberg highlights:
…..On top of the boost already coming from robust global GDP growth, the dollar’s fall over the past year may add over 3 percent to the level of world trade, according to Gabriel Sterne, global head of macro research at Oxford Economics Ltd. Tipping further dollar weakness, the risks are skewed to the upside for Oxford’s baseline forecast for 5 percent growth in world trade in 2018.
“Falls in the value of the dollar oil the wheels of the global financial system, boosting global liquidity by strengthening balance sheets and alleviating currency mismatches,” Sterne wrote in a note. “One important channel is variation in the differential between the cost of raising dollars onshore and offshore. Dollar weakness reduces the cross-currency basis, increases cross-border lending and boosts bank equities.”
The biggest winners will likely be emerging economies given the weaker dollar will lower the value of their dollar-denominated debt, taking pressure off their balance sheets and from credit conditions more generally…..
Finally, from Deutsche Bank (again hat tip to David):
How can it be that US yields are rising sharply, yet the dollar is so weak at the same time? The answer is simple: the dollar is not going down despite higher yields but because of them. Higher yields mean lower bond prices and US bonds are lower because investors don’t want to buy them. This is an entirely different regime to previous years.
Dollar weakness ultimately goes back to two major problems for the greenback this year. First, US asset valuations are extremely stretched. As we argued in our 2018 FX outlook a combined measure of P/E ratios for equities and term premia for bonds is at its highest levels since the 1960s. Simply put, US bond and equity prices cannot continue going up at the same time. This correlation breakdown is structurally bearish for the dollar because it inhibits sustained inflows into US bond and equity markets.
The second dollar problem is that irrespective of asset valuations the US twin deficit (the sum of the current account and fiscal balance) is set to deteriorate dramatically in coming years. Not only does the additional fiscal stimulus recently agreed by Congress push the fair value of bonds even lower via higher issuance and inflation risk premia effects, but the current account that also needs to be financed will widen via import multiplier effects. When an economy is stimulated at full employment the only way to absorb domestic demand is higher imports. Under conservative assumptions the US twin deficit is set to deteriorate by well over 3% of GDP over the next two years.
In summary:
- Rising global growth boosts commodity prices and emerging markets
- Central banks in emerging markets then sell Dollars to slow appreciation of their local currency
- Fiscal stimulus, such as US tax cuts and infrastructure spending, lifts inflation
- Higher inflation causes a bond bear market
- Fiscal stimulus also widens the current account deficit
- Central bank selling, higher inflation, a bond bear market and wider current account deficits all cause a weaker Dollar
Outlook for 2018
At this time of year we are usually inundated with projections for the year ahead, from predictions of imminent collapse to expectations of a record year.
We live in a world of uncertainty, where both extremes are possible, but neither is likely.
We are clearly in stage 3 (the final stage) of a bull market. Risk premiums are close to record lows. The yield spread between lowest investment-grade (Baa) bonds and equivalent risk-free Treasuries has crossed to below 2.0 percent, levels last seen prior to the 2008 global financial crisis. The VIX is also close to its record low, suggesting high levels of investor confidence.
Money supply continues to grow at close to 5.0 percent, reflecting an accommodative stance from the Fed. MZM, or Zero Maturity Money, is basically M1 plus travelers checks and money market funds.
Inflationary forces remain subdued, with average hourly wage rates growing at below 2.5 percent per year. A rise above 3.0 percent, which would pressure the Fed to adopt a more restrictive monetary policy, does not appear imminent.
Tax relief and higher commodity prices are likely to exert upward pressure on inflation in the year ahead. But the Fed’s stated intention of shrinking its balance sheet, with a reduction of $100 billion in the first 12 months, is likely to have an opposite, contractionary effect.
The Leading Index from the Philadelphia Fed gave a bit of a scare, dipping below 1.0 percent towards the end of last year. But data has since been revised and the index now reflects a far healthier outlook.
A flattening yield curve has also been mooted as a potential threat, with a negative yield curve preceding every recession over the last 50 years.
A yield differential, between 10-year and either 2-year or 3-month Treasuries, below zero would warn of a recession. When long-term yields fall below short-term yields financial markets stop working efficiently and bank lending tends to contract. Banks, who generally borrow at short-term rates and lend at long-term rates, find their margins are squeezed and become strongly risk-averse. Contracting lending slows the economy and normally leads to recession.
But we are some way from there. If we take the last cycle as an example, the yield curve started flattening in 2005 (when yield differentials fell below 1 percent) but a recession only occurred in 2008. The market could continue to thrive for several years before the impact of a negative yield curve is felt. To exit now would seem premature.
Fed flunks econ 101?
Caroline Baum’s opinion on the Fed’s approach to inflation:
For all the sturm und drang about the Fed debasing the dollar and sowing the seeds of the next great inflation, the public’s demand for money has increased. The increased desire to hold cash and checkable deposits has risen to meet the increased supply. Velocity, or the rate at which money turns over, has plummeted.
The Fed has two choices. It can adopt the Dr. Strangelove approach and learn to stop worrying and live with low inflation and low unemployment. Or it can do something about it, which runs counter to its stated intention to raise the funds rate and reduce the size of its balance sheet.
Option #1 involves learning to live with a low, stable inflation rate about 0.5 percentage point below the Fed’s explicit 2% target.
Not only has the Fed has achieved price stability in objective terms, but it has also fulfilled former Fed Chairman Alan Greenspan’s subjective definition of price stability: a rate of inflation low enough that it is not a factor in business or household decision-making.
Option #2 means taking some additional actions to increase the money supply by lowering interest rates or resuming bond purchases. The Fed is taking the opposite approach. It began its balance sheet normalization this month, allowing $10 billion of securities to mature each month and gradually increasing the amount every quarter. And it has guided markets to expect another 25-basis-point rate increase in December….
The Fed faces a delicate balancing act. Unemployment is low but capacity utilization is also low, indicating an absence of inflationary pressure.
Janet Yellen understandably wants to normalize interest rates ahead of the next recession but she can afford to take her time. The economy is unlikely to tip into recession unless the Fed hikes rates too quickly, causing a monetary contraction.
I believe the Fed chair is relying on the outflow from more than $2 trillion of excess reserves held by banks on deposit with the Fed to offset the contractionary effect of any rate hikes.
If pushed, the Fed could lower the interest rate paid on excess reserves in order to encourage banks to withdraw excess deposits. But so far this hasn’t been necessary. The attraction of higher interest rates in financial markets has been sufficient to encourage a steady outflow from excess reserves, keeping the monetary base (net of reserves) growing at a steady clip of close to 7.5% p.a. despite rate hikes so far.
Makes you wonder why Donald Trump would even consider replacing the Fed chair when she is doing a great job of managing the recovery.
Source: Fed flunks econ 101: understanding inflation – MarketWatch
How long will the bull market last?
US markets are clearly in a bull phase, with the Dow, S&P 500 and Nasdaq making strong gains. A rising Freight Transport Index highlights the broad up-turn in economic activity.
Low corporate bond spreads — lowest investment grade (Baa) minus 10-year Treasury yield — and VIX below 15 both reflect bull market conditions.
Real GDP is growing around a modest 2 percent a year. Low figures are likely to continue, with annual change in hours worked (total payroll * average weekly hours) falling to 1.2 percent in September.
Money supply (M1) growth recovered to a balmy 7 percent (p.a.) after a worrying dip below 5 in early 2016.
The Fed may be reluctant to tighten monetary conditions but will be forced to act if inflation starts to accelerate. Annual growth in hourly wage rates turned above 2.5 percent in September, signaling underlying inflationary pressure.
Another dip in M1 below 5 percent growth would warn that monetary conditions are tightening. From there, it normally takes 12 months to impact on the broad market indices.
At this stage it looks like another 2 years of sunshine before the storm. But one false tweet and we could face an early winter.
Australia faces headwinds
Australian wage rate growth, on the other hand, is declining. is in a worse position, with a dramatic fall in investment following the mining boom.
Source: RBA & ABS
As is inflation.
Source: RBA & ABS
Growth in Household Disposable Income and Consumption.
Source: RBA & ABS
And Banks return on shareholders equity.
Source: RBA & APRA
But not Housing.
Source: RBA, ABS, APM, CoreLogic & Residex
At least not yet.
Falling house prices would complete the feedback loop, shrinking household incomes, consumption and banks ROE.
Gold finds support at $1250
The Dollar Index continues to test support at 96.50. The primary trend is down and breach of support is likely, signaling a decline to test the 2016 low at 92/93.
Spot Gold found support at $1250. A weaker Dollar and rising political uncertainty both favor an up-trend but rising interest rates are expected to weaken demand. Respect of support at $1250 would confirm the up-trend, while breach of $1200 would warn of another decline.