Rate cuts and buybacks – the emperor’s new clothes

The interest rate outlook is softening, with Fed chairman Jerome Powell hinting at rate cuts in his Wednesday testimony to Congress:

“Our baseline outlook is for economic growth to remain solid, labor markets to remain strong and inflation to move back over time.”
but…. “Uncertainties about the outlook have increased in recent months. In particular, economic momentum appears to have slowed in some major foreign economies and that weakness could affect the US economy.”

Stephen Bartholomeusz at The Sydney Morning Herald comments:

“Perhaps the most disturbing aspect of the Fed shifting into an easing cycle before there is strong evidence to warrant it, is economies already stuck in high debt and low growth environments will be forced even deeper into the kind of policies that in Japan have produced more than 30 years of economic winter with no apparent escape route.”

If the Fed moves too early they could further damage global growth, with long-term consequences for US stocks. But markets are salivating at the anticipated sugar hit from lower rates. Stocks surged in response to Powell’s speech, with the S&P 500 breaking resistance at 3000. A rising Trend Index indicates buying pressure.

S&P 500

The argument for higher stock prices is that lower interest rates may stave off a recession. The chart below shows how recessions (gray bars) are normally preceded by rising interest rates (green) followed by sharp cuts when employment growth (blue) starts to fall.

Fed Funds Rate & Payroll Growth

Rate cuts themselves are not a recession warning, unless accompanied by declining employment growth. Otherwise, as in 1998 when there was minimal impact on employment, the economy may recover. Falling employment growth is, I believe, the most reliable recession warning. So far, the decline in growth has been modest but should be monitored closely.

Falling employment is why recessions tend to lag an inverted yield curve (negative 10-year minus 3-month Treasury yield spread) by up to 18 months. The negative yield curve is a reliable warning of recessions only because it reflects the Fed response to rising inflation and then falling employment.

Yield Spread

Valuations

A forward Price-Earnings ratio of 19.08 at the end of June 2019 warned that stocks are highly priced relative to forecast earnings. The forward PE  jumped to 19.55 by Friday — an even stronger warning.

S&P 500 Forward Price-Earnings Ratio

June 2019 trailing Price-Earnings ratio at 21.52 warned that stock prices are dangerously high when compared to the 1929 and 1987 peaks preceding major crashes. That has now jumped to 22.04.

S&P 500 Price-Earnings (based on highest trailing earnings)

The only factor that could support such a high earnings multiple is unusually strong earnings growth.

But real corporate earnings are declining. Corporate profits, before tax and adjusted for inflation, are below 2006 levels and falling. There are still exceptional stocks that show real growth but they are counter-balanced by negative real growth in other stocks.

Corporate Profits before tax adjusted for Inflation

Impossible, you may argue, given rising earnings for the S&P 500.

S&P 500 Earnings

There are three key differences that contribute to earnings per share growth for the S&P 500:

  1. Inflation;
  2. Taxes; and
  3. Stock Buybacks.

Inflation is fairly steady at 2.0%.

GDP Implicit Price Deflator & Core CPI

Quarterly tax rates declined from 25% in Q3 2017 to 13.22% in Q4 2018 (source: S&P Dow Jones Indices).

S&P 500 Quarterly Tax Rates

Stock buybacks are climbing. The buyback yield for the S&P 500 rose to 3.83% in Q4 2018 (source: S&P Dow Jones Indices).

S&P 500 Buyback Yield

The 2017 Tax Cuts and Jobs Act caused a surge in repatriation of offshore cash holdings — estimated at almost $3 trillion — by multinationals. And a corresponding increase in stock buybacks.

S&P 500 Buybacks, Dividends & Earnings

In summary, the 2018 surge in S&P 500 earnings is largely attributable to tax cuts and Q1 2019 is boosted by a surge in stock buybacks in the preceding quarter.

Buybacks plus dividends exceed current earnings and are unsustainable in the long run. When the buyback rate falls, and without further tax cuts, earnings growth is going to be hard to find. Like the emperor’s new clothes.

It’s a good time to be cautious.

“Only when the tide goes out do you discover who’s been swimming naked”.

~ Warren Buffett

“Stocks rebound but sentiment soft”

From Bob Doll at Nuveen Investments. His weekly top themes:

1. We think the odds of a U.S. recession are low, but we also believe growth will remain soft for a couple of quarters. U.S. growth may bottom in the first half of 2019 following a relatively disappointing fourth quarter and the recent government shutdown. We expect growth will improve in the second half of the year.

Agreed, though growth is likely to remain soft for an extended period. The Philadelphia Fed Leading Index is easing but remains healthy at above 1.0% (December 2018).

Leading Index

2. Inflation remains low, but upward pressure is mounting. With unemployment under 4% and average hourly earnings rising to an annual 3.6% level, we may start to see prices rise. So far, better productivity growth has kept the lid on prices, but this trend bears watching.

Agreed. Average hourly earnings are rising and inflation may follow.

Hourly Earnings Growth

3. Trade issues remain a wildcard. The U.S./China trade dispute appears to be making progress, but the timeline is slipping and significant disagreement remains over tariff levels and intellectual property protections.

This is the dominant issue facing global markets. Call me skeptical but I don’t see a happy resolution. There is too much at stake for both parties. Expect a drawn out conflict over the next two decades.

4. We do not expect Brexit to cause widespread market issues. We think the risk of a hard Brexit is low, since no one wants to see that outcome. Some sort of soft separation or even a Brexit vote redo appears more likely.

Agreed. Hard Brexit is unlikely. Soft separation is likely, while no Brexit is most unlikely.

5. The health care sector may remain under pressure due to political rhetoric. Health care stocks in general, and managed care companies in particular, have struggled in light of talk about ending private health care coverage. We think Congress lacks the votes to enact such legislation. But this issue, as well as drug pricing policies, are likely to remain at the center of the political dialogue through the 2020 elections.

Health care is a political football and may take longer to resolve than the trade war with China.

6. Downward earnings revisions may present the largest risk for stocks. As recently as September 30, expectations for first quarter earnings growth were +7%. That slipped to +4% by January 1 and has since fallen to -3%.

A sharp fall in earnings would most likely spring from a steep rise in interest rates if the Fed had to combat rising inflation. That doesn’t seem imminent despite rising average hourly earnings. The Fed is maintaining money supply growth at close to 5.0%, around the same level as nominal GDP, keeping a lid on inflationary pressures.

Money Supply & Nominal GDP growth

7. Equity returns may be modest over the next decade compared to the last. Since the bull market began 10 years ago, U.S. stocks have appreciated over 400%. It’s nearly impossible to imagine that pace will be met again, but we feel confident that stocks will outperform Treasuries and cash over the next 10 years.

Expect modest returns on stocks, low interest rates, and low returns on bonds and cash.

President Trump should look in the mirror

President Trump has repeatedly attacked the Fed and his recent appointee Jerome Powell for raising interest rates. In an interview with the Wall Street Journal, the President made clear his displeasure, stating that he sees the FOMC as the biggest risk to the US economy “because I think interest rates are being raised too quickly”.

What the President fails to grasp is that his actions, increasing the budget deficit when the economy is thriving, are the real threat. Alan Kohler recently displayed a chart that sums up the Fed’s predicament.

Unemployment and the Budget Deficit

The budget deficit is normally raised when unemployment is high (the scale of the deficit  is inverted on the above chart to make it easier to compare) in order to stimulate the economy. When unemployment falls then the deficit is lowered to prevent the economy from over-heating and to curb inflation.

At present unemployment is at record lows but Trump’s tax cuts have increased the deficit. The Fed is left with no choice but to steadily increase interest rates in order to prevent inflation from getting out of hand.

Real GDP growth came in at a robust 3.0% for the third quarter, while weekly hours worked are rising.

Real GDP and estimated Weekly Hours Worked

It’s the Fed’s job to remove the punch-bowl before the party gets out of hand.

How will a bond bear market affect stocks?

10-Year Treasury yields broke out of their triangular consolidation at 3.00%, while the Trend Index recovered above zero signaling a fresh advance.

10-year Treasury Yield

Importance of resistance at 3.00% is best illustrated on a long-term monthly chart. Yields declined for more than three decades (since 1981) in a bond bull market but the rise above 3.00% completes a double-bottom reversal, warning of rising yields and a bond bear market. Target for the advance is 4.50%.

10-year Treasury Yield

The yield differential between 10-year and 3-month Treasuries has declined since 2010, prompting discussion as to whether a flat yield curve will cause a recession.  Interesting that the yield differential recovered almost 20 basis points in September, with long-term yields rising faster than short-term. Penetration of the descending trendline would suggest that an imminent negative yield curve is unlikely.

10-year Treasury Yield

How would a bond bear market affect stocks?

Capital losses from rising yields on long-maturity bonds would increase demand for shorter maturities, driving down short-term yields and causing a steeper yield curve. A bullish sign for stocks.

Inflation is low and the rise in long-term yields is likely to be gradual. Another bullish sign.

The last bond bear market lasted from the early 1950s to a peak in September 1981. Higher interest rates were driven by rising inflation ( indicated below by percentage change in the GDP implicit price deflator). The 1975 spike in inflation was caused by the OPEC oil embargo in retaliation for US support of Israel during the 1973 Yom Kippur war.

1950 to 1981: 10-Year Treasury Yields and GDP Implicit Price Deflator

Stock prices continued to climb during the bond bear market, apart from a 1973 – 1974 setback, but the Price-Earnings ratio fell sharply in ’73-’74 and only recovered 10 years later, in the mid-1980s.

1950 to 1981: S&P 500 and PE Ratio

Alarmists may jump to the conclusion that a bond bear market would lead to a similar massive fall in earnings multiples but there were other factors in play in 1975 to 1985.

First, crude prices spiked after the OPEC oil embargo and only retreated in the mid-1980s.

1960 to 1985: West Texas Intermediate Crude prices

The rise of Japan also threatened US dominance in global markets.

1960 to 1985: Nikkei 225 Index

We should rather examine the period prior to 1973 as indicative of a typical bond bear market. The S&P 500 Price-Earnings ratio was largely unaffected by rising yields. Real interest rates actually decreased during the period, with the gap between 10-year yields and the inflation rate only widening near the 1981 peak.

At present, real interest rates are near record lows.

1981 to 2018: 10-Year Treasury Yields and GDP Implicit Price Deflator

We can expect real interest rates to rise over time but that is unlikely to have a significant impact on earnings multiples — unless there is a strong surge in long-term yields ahead of inflation.


Capital spending on the rise

Just released July 2018 manufacturers’ new orders for capital goods, excluding defense and aircraft, show that the recovery is gathering speed.

Manufacturers New Orders: Capital Goods excluding Defense & Aircraft

Any fears that easy money has undermined capital budgeting restraints — and that the economy is entering the final heady stages of a boom before the bust — can be dispelled by adjusting the above graph for inflation.

Manufacturers New Orders: Capital Goods excluding Defense & Aircraft adjusted for Inflation

Adjusting manufacturers orders by the GDP implicit price deflator shows that the recovery in capital spending has barely started and is a long way from the excesses preceding the Dotcom crash and the GFC.

Australia: Good news and bad news

First, the good news from the RBA chart pack.

Exports continue to climb, especially in the Resources sector. Manufacturing is the only flat spot.

Australia: Exports

Business investment remains weak and is likely to impact on long-term growth in both profits and wages.

Australia: Business Investment

The decline is particularly steep in the Manufacturing sector and not just in Mining.

Australia: Business Investment by Sector

But government investment in infrastructure has cushioned the blow.

Australia: Public Sector Investment

Profits in the non-financial sector remain low, apart from mining which has benefited from strong export demand.

Australia: Non-Financial Sector Profits

Job vacancies are rising which should be good news for wage rates. But this also means higher inflation and, down the line, higher interest rates.

Australia: Job Vacancies

The housing and financial sector is our Achilles heel, with household debt climbing a wall of worry.

Australia: Housing Prices and Household Debt

House prices are shrinking despite record low interest rates.

Australia: Housing Prices

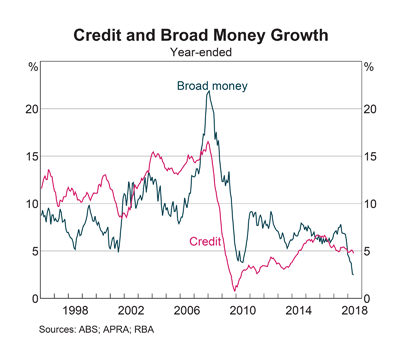
Broad money and credit growth are slowing, warning of a contraction.

Australia: Broad Money and Credit Growth

Bank profits remain strong.

Australia: Bank Profits

But capital ratios are low, with the bulk of profits distributed to shareholders as dividends. The ratios below are calculated on risk-weighted assets. Raw leverage ratios are a lot weaker.

Australia: Bank Capital Ratios

One of the primary accelerants of the housing bubble and household debt has been $900 billion of offshore borrowings by domestic banks. The chickens are coming home to roost, with bank funding costs rising as the Fed hikes interest rates. In the last four months the 90-day bank bill swap rate (BBSW) jumped 34.5 basis points.

The banks face a tough choice: pass on higher interest rates to mortgage borrowers or accept narrower margins and a profit squeeze. With an estimated 30 percent of households already suffering from mortgage stress, any interest rate hikes will impact on both housing prices and delinquency rates.

I continue to avoid exposure to banks, particularly hybrids where many investors do not understand the risks.

I also remain cautious on mining because of a potential slow-down in China, with declining growth in investment and in retail sales.

China: Activity

Low inflation risk keeps yield curve safe

The Fed is advancing interest rates at a measured pace, with the objective of restoring balance in financial markets rather than to curbing inflationary pressures. Only if inflation spikes is the Fed likely to adopt a restrictive stance.

Elliot Clarke from Westpac sums up the FOMC (Fed Open Market Committee) view from their latest minutes:

Beginning with inflation, whereas the market has recently been concerned that inflation may be getting away from the FOMC (given annual CPI inflation at 2.5%yr and persistent strength in the oil price), the Committee is unperturbed.

Instead of the CPI, the FOMC’s benchmark remains PCE inflation, which is currently 2.0%yr on a headline basis and 1.9%yr for core…..

To see upside inflation risks build, a stronger wage inflation pulse is necessary. At present the employment cost index is only reporting “a gradual pickup in wage increases”, and the signal from other wage measures is “less clear”. Two other important considerations for the pass through of wages to activity and thus inflation is that real hourly earnings growth is currently flat and the savings rate near historic lows. The capacity of households to boost consumption and thus inflation is therefore very limited.

Hourly wage rates are growing at a gradual pace.

Hourly Wage Rate Growth

Personal savings are low.

Personal Savings

And credit growth is modest.

Credit Growth

So not much sign of inflationary pressure.

….Turning to financial conditions, as yet there is no concern of them becoming an impediment to growth or policy. The 10yr yield has moved back to the highs of 2013, but the US dollar has only partly retraced its 2017 depreciation. Further, asset markets remain near recent highs.

Equally significant however is the reference to being nearer neutral and a clear desire to keep the yield curve’s positive slope…..

We do not believe that the yield curve will invert in this instance, in part because higher deficits should see the term premium rise. However, the curve will remain comparatively flat versus history, restricting both the timing and the scale of further rate hikes. This is a key justification for both the market’s and our own view of only two further hikes in 2018 and two more in 2019 – a stark contrast to the FOMC’s seven hikes to end-2020.

Yield Differential

A negative yield curve — when 10-year minus 3-month Treasury yields falls below zero — would give a strong recession warning. But the yield curve is only likely to invert if the Fed steps up interest rate increases. With little sign of rising inflationary pressure at present, the prospect seems remote.

The Fed and Alice in Wonderland

In Lewis Carroll’s Alice in Wonderland a young Alice experiences a series of bizarre adventures after falling down a rabbit hole. The new Fed Chairman Jerome Powell will similarly have to lead global financial markets through a series of bizarre, unprecedented experiences.

Down the Rabbit Hole

In 2008, after the collapse of Lehman Bros, financial markets were in complete disarray and in danger of imploding. The Fed, under chairman Ben Bernanke, embarked on an unprecedented (and unproven) rescue attempt — now known as quantitative easing or QE for short — injecting more than $3.5 trillion into the financial system through purchase of long-term Treasuries and mortgage-backed securities (MBS).

Fed Total Assets

The Fed aimed to drive long-term interest rates down in the belief that this would encourage private sector borrowing and investment and revive the economy. Their efforts failed. Private sector borrowing did not revive. Most of the money injected ended up, unused by the private sector, as $2.5 trillion of excess commercial bank reserves on deposit at the Fed.

Fed Excess Reserves

Richard Koo pointed out that the private sector will under normal cirumstances respond to lower interest rates with increased borrowing but during a financial crisis, when their balance sheets have been destroyed and their liabilities exceed their assets, their sole focus is to restore their balance sheet, using surplus cash flow to pay down debt. The only way to prevent a collapse is for the government to step in and plug the gap, borrowing surplus capital and investing this in infrastructure.

One Pill Makes you Larger

Fortunately Bernanke got the message.

US and Euro Area Public Debt to GDP

… and spread the word.

Japan Public Debt to GDP

And One Pill Makes you Small

Unfortunately, other central banks also followed the Fed’s earlier lead, injecting vast sums into the financial system through quantitative easing (QE).

ECB and BOJ Total Assets

Driving long-term yields to levels even Lewis Carroll would have struggled to imagine.

10-Year Treasury Yields

The Pool of Tears

Then in 2014, another twist in the tale. Long-term yields continued to fall in Europe and Japan, while US rates stabilised as Fed eased off on QE. A large differential appeared between US and European/Japanese rates (observable since 2014 on the above chart), causing a flood of money into the US, in pursuit of higher yields.

….. with an unwanted side-effect. The Dollar strengthened. Capital inflows caused the trade-weighted value of the US Dollar to spike upwards beween 2014 and 2016, damaging US export industries and local manufacturers facing competition from foreign imports.

US Trade-Weighted Dollar Index

The Mad Hatter’s Tea Party

A jobless recovery in manufacturing and low wage growth in turn led to the election of Donald Trump in 2016 promising increased protectionism against global competition.

US Manufacturing Jobs

Then in 2017, to the consternation of many, despite rising interest rates the US Dollar began to fall.

US TW Dollar Index in 2017

Learned analysis followed, ascribing the weakening Dollar to rising commodity prices and a recovery in emerging markets. But something doesn’t quite add up.

International bond investors are a pretty smart bunch. When they look at US bond markets, what do they see? The new Fed Chairman has inherited a massive headache.

Donald Trump is determined to stimulate job growth through tax cuts and infrastructure spending. This will certainly create jobs. But when you stimulate an economy that is already at full employment you get inflation.

Who Stole the Tarts?

Jerome Powell is sitting on a powder keg. More than $2 trillion of excess reserves that commercial banks can withdraw without notice. Demand for bank credit is expected to rise as result of the Trump stimulus. Commercial banks, not known for their restraint, can make like Donkey Kong with their excess reserves provided by the Bernanke Fed.

Under Janet Yellen the Fed mapped out a program to withdraw excess reserves from the market by selling down Treasuries and MBS at the rate of $100 billion in 2018 and $200 billion each year thereafter. But at that rate it will take 10 years to remove the excess.

Bond markets are worried about what will happen to inflation in the mean time.

Off With His Head

The new Fed Chair has made all the right noises about being hawkish on inflation. But can he walk the talk? Especially with his $2 trillion headache.

….and the Red Queen, easily recognizable from Lewis Carroll’s tale, tweeting “off with his head” if a hawkish Fed threatens to spoil the party.

One pill makes you larger
And one pill makes you small
And the ones that mother gives you
Don’t do anything at all
Go ask Alice
When she’s ten feet tall

….When the men on the chessboard
Get up and tell you where to go
And you’ve just had some kind of mushroom
And your mind is moving low….

When logic and proportion
Have fallen sloppy dead
And the White Knight is talking backwards
And the Red Queen’s off with her head
Remember what the dormouse said
Feed your head
Feed your head

~ White Rabbit by Grace Slick from Jefferson Airplane (1967)