International Growth: Performance Feb-2023

International Growth portfolio performance since inception on July 1, 2018 is set out below. We expect to hold most growth stocks for 5 to 10 years.

International Growth Annualized Performance 1-Jul-2018 to 28-Feb-2023: Portfolio 8.54%, S&P 500 Total Return Index 10.49%

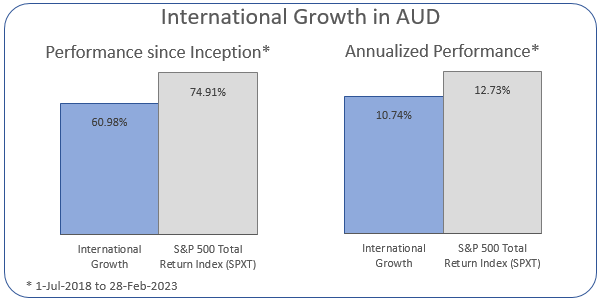
And in Australian Dollars:

International Growth in AUD Annualized Performance 1-Jul-2018 to 28-Feb-2023: Portfolio 10.74%, S&P 500 Total Return Index 12.73%

Performance of Individual Stocks

[Content protected for Premium, International Growth members only]

Past Performance

Hypothetical $1 million invested in the International Growth portfolio on July 1, 2018, calculated in US Dollars:

Hypothetical USD 1 million invested on July 1, 2018 would have grown to 1.47 million by February 28, 2023, compared to the S&P 500 Total Return Index (SPXT) which would have grown to 1.59 million.

Converted to Australian Dollars (on a month-end basis):

Hypothetical AUD 1.35 million (equivalent of USD 1 million) invested on July 1, 2018 would have grown to 2.18 million by February 28, 2023, compared to the S&P 500 Total Return Index (SPXT) which would have grown to 2.37 million.

Performance Notes:

  • Performance is calculated in US Dollars except where otherwise stated.
  • Annualized performance is calculated using the CAGR formula.
  • Returns are calculated after brokerage costs but exclude all other fees and charges.
  • Not all stocks have equal weighting nor held for the full period.
  • Past performance is not a guarantee of future performance.

Portfolio Allocation

Current portfolio allocation differs considerably from our target allocation, set as a long-term aspirational goal, due to elevated market risk, over-priced sectors, and opportunities in cyclicals (including gold and precious metals).

Current Allocation

The graph below reflects current portfolio allocation:

International Growth Current Allocation

Past Allocations

Allocations have evolved over time to deal with elevated market risk, over-priced sectors, and opportunities in cyclicals:

International Growth Past Allocations

[Content protected for Premium, International Growth members only]

Australian Growth: Performance Feb-2023

Australian Growth portfolio performance since inception on July 1, 2018 is set out below. We expect to hold most growth stocks for 5 to 10 years.

Australian Growth Annualized Performance 1-Jul-2018 to 28-Feb-2023: Portfolio 3.28%, ASX 200 Accumulation Index 7.55%

Individual Stocks

[Content protected for Premium, Australian Growth members only]

Past Performance

Hypothetical $1 million invested in the Australian Growth portfolio on July 1, 2018:

Hypothetical AUD 1 million invested on July 1, 2018 would have grown to 1.16 million by February 28, 2023, compared to the ASX 200 Accumulation Index (XJOA) which would have grown to 1.4 million.

Performance Notes:

  • Performance is calculated in Australian Dollars.
  • Annualized performance is calculated using the CAGR formula.
  • Returns are calculated after brokerage costs but excludes all other fees and charges.
  • Franking credits are excluded from return calculations.
  • Not all stocks have equal weighting nor held for the full period.
  • Past performance is not a guarantee of future performance.

Portfolio Allocation

Current portfolio allocation differs considerably from our target allocation, set as a long-term aspirational goal, due to elevated market risk, over-priced sectors, and opportunities in cyclicals (including gold and precious metals).

Current Allocation

The graph below reflects current portfolio allocation:

Australian Growth Current Allocation

Past Allocations

Allocations have evolved over time to deal with elevated market risk, over-priced sectors, and opportunities in cyclicals:

Australian Growth Past Allocations

[Content protected for Premium, Australian Growth members only]

Australian Growth: Performance Jan-2023

Australian Growth portfolio performance since inception on July 1, 2018 is set out below. We expect to hold most growth stocks for 5 to 10 years.

Australian Growth Annualized Performance 1-Jul-2018 to 31-Jan-2023: Portfolio 4.08%, ASX 200 Accumulation Index 8.28%

Individual Stocks

[Content protected for Premium, Australian Growth members only]

Notes:

  • Performance is calculated in Australian Dollars.
  • Annualized performance is calculated using the CAGR formula.
  • Returns are calculated after brokerage costs but excludes all other fees and charges.
  • Franking credits are excluded from return calculations.
  • Not all stocks have equal weighting nor held for the full period.
  • Past performance is not a guarantee of future performance.

International Growth: Performance Jan-2023

International Growth portfolio performance since inception on July 1, 2018 is set out below. We expect to hold most growth stocks for 5 to 10 years.

International Growth Annualized Performance 1-Jul-2018 to 31-Jan-2023: Portfolio 10%, S&P 500 Total Return Index 11.28%

And in Australian Dollars:

International Growth in AUD Annualized Performance 1-Jul-2018 to 31-Jan-2023: Portfolio 11.12%, S&P 500 Total Return Index 12.42%

Performance of Individual Stocks

[Content protected for Premium, International Growth members only]

Notes:

  • Performance is calculated in US Dollars except where otherwise stated.
  • Annualized performance is calculated using the CAGR formula.
  • Returns are calculated after brokerage costs but exclude all other fees and charges.
  • Not all stocks have equal weighting nor held for the full period.
  • Past performance is not a guarantee of future performance.

International Growth: Performance Dec-2022

International Growth portfolio performance since inception on July 1, 2018 is set out below. We expect to hold most growth stocks for 5 to 10 years.

International Growth Annualized Performance 1-Jul-2018 to 31-Dec-2022: Portfolio 7.87%, S&P 500 Total Return Index 10.01%

And in Australian Dollars:

International Growth in AUD Annualized Performance 1-Jul-2018 to 31-Dec-2022: Portfolio 9.83%, S&P 500 Total Return Index 12.00%

Performance of Individual Stocks

[Content protected for Premium, International Growth members only]

The portfolio has a sizable allocation to gold & precious metals (19% at 31-Dec-2022). We expect negative real interest rates to lift performance of this asset class over the next year.

Notes:

  • Performance is calculated in US Dollars except where otherwise stated.
  • Annualized performance is calculated using the CAGR formula.
  • Returns are calculated after brokerage costs but exclude all other fees and charges.
  • Not all stocks have equal weighting nor held for the full period.
  • Past performance is not a guarantee of future performance.

Australian Growth: Performance Dec-2022

Australian Growth portfolio performance since inception on July 1, 2018 is set out below. We expect to hold most growth stocks for 5 to 10 years.

Australian Growth Annualized Performance 1-Jul-2018 to 31-Dec-2022: Portfolio 3.19%, ASX 200 Accumulation Index 6.99%

Individual Stocks

[Content protected for Premium, Australian Growth members only]

The portfolio has a sizable allocation to gold & precious metals (17% at 31-Dec-2022). We expect negative real interest rates to lift performance of this asset class over the next year.

Notes:

  • Performance is calculated in Australian Dollars.
  • Annualized performance is calculated using the CAGR formula.
  • Returns are calculated after brokerage costs but excludes all other fees and charges.
  • Franking credits are excluded from return calculations.
  • Not all stocks have equal weighting nor held for the full period.
  • Past performance is not a guarantee of future performance.

International Growth: Performance Nov-2022

International Growth portfolio performance since inception on 1 July 2018 is set out below. We expect to hold most growth stocks for 5 to 10 years.

International Growth Annualized Performance 1-Jul-2018 to 30-Nov-2022: Portfolio 10.07%, S&P 500 Total Return Index 11.69%

And in Australian Dollars:

International Growth in AUD Annualized Performance 1-Jul-2018 to 30-Nov-2022: Portfolio 12.21%, S&P 500 Total Return Index 13.87%

Performance of Individual Stocks

[Content protected for Premium, International Growth members only]

The portfolio has a sizable allocation to gold & precious metals (17% at 30-Nov-2022). We expect negative real interest rates to lift performance of this asset class over the next year.

Notes:

  • Performance is calculated in US Dollars except where otherwise stated.
  • Annualized performance is calculated using the CAGR formula.
  • Returns are calculated after brokerage costs but exclude all other fees and charges.
  • Not all stocks have equal weighting nor held for the full period.
  • Past performance is not a guarantee of future performance.

Australian Growth: Performance Nov-2022

Australian Growth portfolio performance since inception on 1 July 2018 is set out below. We expect to hold most growth stocks for 5 to 10 years.

Australian Growth Annualized Performance 1-Jul-2018 to 30-Nov-2022: Portfolio 3.28%, ASX 200 Accumulation Index 7.92%

Individual Stocks

[Content protected for Premium, Australian Growth members only]

The portfolio has a sizable allocation to gold & precious metals (17% at 30-Nov-2022). We expect negative real interest rates to lift performance of this asset class over the next year.

Notes:

  • Performance is calculated in Australian Dollars.
  • Annualized performance is calculated using the CAGR formula.
  • Returns are calculated after brokerage costs but excludes all other fees and charges.
  • Franking credits are excluded from return calculations.
  • Not all stocks have equal weighting nor held for the full period.
  • Past performance is not a guarantee of future performance.

Aristocrat Leisure (ALL)

Stock: Aristocrat Leisure Ltd
Exchange: ASX Symbol: ALL
Date: 12-Dec-22 Latest price: A$33.64
Market Cap: A$22.2 bn Fair Value: A$25.21
Forward DY: 1.5% Payback (Years): 11
Financial Y/E: 30-Sep-23 Rating: HOLD
Sector: Discretionary Industry: Gambling
Investment Theme: LT Growth Macro Trends: Online Entertainment

Aristocrat is trading at a premium to our estimate of fair value while the stock is in a down-trend. Our recommendation is to HOLD.

Valuation

We increased our fair value estimate for Aristocrat (ALL) by 66%, to A$25.21, based on the following long-term projections:

  • Real organic long-term revenue growth of 6%;
  • EBITDA margin of 30% (currently 33.2% in FY22);
  • Capital expenditure of 5.0% of revenue;
  • No increases in net working capital; and
  • An effective tax rate of 30%.

We selected a payback period of 11 years (formerly 10 years) to reflect Aristocrat’s strong market share but in a cyclical industry. The company recovered well from the pandemic but may have benefited from increased disposable income due to government transfers.

Business Profile

Aristocrat Leisure is an electronic gaming machine manufacturer, selling machines to pubs, clubs, and casinos. The firm is licensed in all Australian states and territories, North American jurisdictions, and essentially every major country. Aristocrat is one of the largest three players in the space along with International Game Technology and Scientific Games. Through acquisitions of Plarium and Big Fish, Aristocrat now derives a significant proportion of earnings from mobile gaming, under the Pixel United banner.

Performance

Revenue grew 12% in FY22, while EBITDA grew 13.7%, on a constant currency basis.

Gaming

Pixel United

Capital structure

Aristocrat’s cash assets exceed debt plus lease liabilities.

Disclosure

Staff of The Patient Investor may directly or indirectly own shares in the above company.

Australian Growth: Performance Oct-2022

Australian Growth portfolio performance since inception on 1 July 2018 is set out below. We expect to hold most growth stocks for 5 to 10 years.

Australian Growth Annualized Performance 1-Jul-2018 to 31-Oct-2022: Portfolio 2.48%, ASX 200 Accumulation Index 6.5%

Individual Stocks

[Content protected for Premium, Australian Growth members only]

The portfolio has a sizable allocation to gold & precious metals (15% at 31-Oct-2022). We expect negative real interest rates to lift performance of this asset class over the next year.

Notes:

  • Performance is calculated in Australian Dollars.
  • Annualized performance is calculated using the CAGR formula.
  • Returns are calculated after brokerage costs but excludes all other fees and charges.
  • Franking credits are excluded from return calculations.
  • Not all stocks have equal weighting nor held for the full period.
  • Past performance is not a guarantee of future performance.