Be wary of investing in a rigged market

The S&P 500 recovered above 3000, suggesting another advance, but bearish divergence on Twiggs Money Flow warns of (secondary) selling pressure.  Further tests of new support at 2950 are likely.

S&P 500

Falling commodity prices warn of declining global demand.

DJ-UBS Commodity Index

Declining crude prices reinforce the warning.

Nymex Light Crude

While in the US, the Cass Freight Index formed a lower peak. Follow-through below the previous trough would warn of a down-trend and declining activity.

Cass Freight Index

Capital goods orders, adjusted for inflation, continue to decline.

Capital Goods Orders

Housing starts are steady but declining building permits warn of a slow-down ahead.

Housing Starts and Building Permits

Craig Johnson of Piper Jaffray says odds of a recession are growing:

“The bond market has already priced in two rate cuts at this point in time, and potentially part of a third,” Johnson said. “History has always said that bonds lead equities and we need to listen to that message. I think that’s what the smart money is doing…I guess we can’t seem to quite get off of the monetary train that we’ve gotten ourselves onto, and I don’t think it’s quite so simple.”

S&P 500 PEmax

Trailing price-earnings (PEmax) are above 20, historically a warning that the market is over-heated. The biggest buyers of stocks are the companies themselves, through buybacks. The Fed is expected to cut rates while employment growth is still strong. Price signals are being distorted.

Be wary of investing in a rigged market. It’s a good time to be cautious.

“It is optimism that is the enemy of the rational buyer.”

~ Warren Buffett

Trade war reality sinks in

Realization that we are slipping into a trade war is starting to sink in.
The S&P 500 broke medium-term support at 2800, warning of a correction. The target is primary support at 2400. Volatility is flashing an amber warning, above 1.0%.

S&P 500

Nymex crude is plunging as anticipated global demand falls.

Crude Oil

Long-term Treasury yields are falling, with the 10-Year headed for a test of support at 2.0%. The Yield Differential (purple line) is back below zero, warning of a recession.

Yield Differential: 10-Year and 3-Month Treasuries

As I have mentioned earlier, a negative yield curve is a reliable early indicator of recession but trouble is imminent when it recovers above zero. Normally caused by the Fed cutting interest rates in response to falling employment growth. The critical indicator to watch is non-farm payroll growth. When that falls below 1.0% (right-hand scale), watch out!

Employment Growth and Fed Funds Rate

War is an evil thing; but to submit to the dictation of other states is worse…. Freedom, if we hold fast to it, will ultimately restore our losses, but submission will mean permanent loss of all that we value…. To you who call yourselves men of peace, I say: You are not safe unless you have men of action on your side.

~ Thucydides (circa 400 BC)

Employment lifts but S&P 500 tentative

Growth in total non-farm payrolls ticked up to 1.76% for the 12 months to April 2019, supporting Fed reluctance to cut interest rates.

Payroll Growth

The Philadelphia Fed Leading Index has been revised upwards, above a comfortable 1.0%.

Leading Index

Real GDP growth came in at a healthy 3.2% for the 12 months ended 31 March 2019 but growth in total hours worked sagged to 1.47%, suggesting that GDP growth is likely to slow.

Real GDP and Total Hours Worked

Growth in average hourly earnings came in at 3.23% (total private), suggesting that inflationary pressures remain under control. Little chance of a Fed rate hike either.

Average Hourly Earnings

The S&P 500 retracement respected support at 2900. Rising Money Flow indicates buying pressure but gains seem tentative.

S&P 500

US growth looks to continue but commodity prices warn that global growth is slowing.

Nymex crude penetrated its lower trend channel, warning of a correction. Despite the supply impact of increasing sanctions on Iran and Venezuela, and the threat of supply disruption in Libya.

Nymex Light Crude

A similar correction on DJ-UBS Commodities index reinforces that global demand is slowing.

DJ-UBS Commodities Index

Gold retreats

Spot Gold retreated from resistance at $1350/ounce. Penetration of the rising trendline warns of another correction. The immediate target is support at $1250.

Spot Gold in USD

Silver is also retreating. Breach of $15/ounce would strengthen the bear signal.

Spot Silver in USD

Crude oil has rallied since the start of the year but the primary trend is down and lower peaks on the trend index warn of further selling pressure. Breach of medium-term support at $52 would signal another test of primary support at $42 which would be bullish for the Dollar.

Crude Oil

The Dollar is gradually strengthening. Breakout of the Dollar Index above its current range of 95.50 to 97.50 would be bearish for gold.

Dollar Index

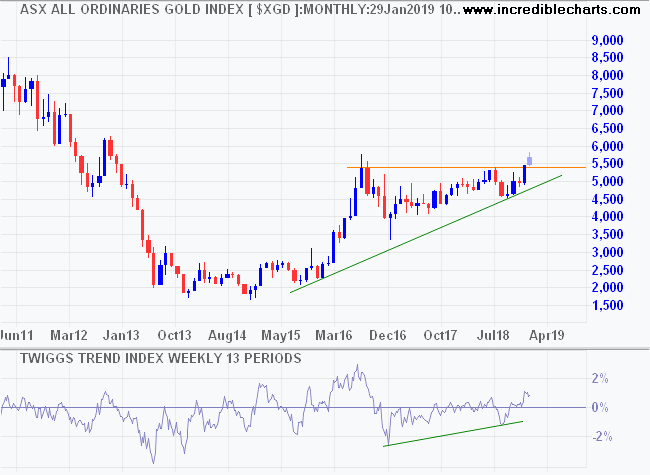
The Aussie Dollar held steady, while the All Ordinaries Gold Index retreated from its recent high above 6000. Expect a test of new support at 5400.

All Ordinaries Gold Index

Gold-Oil divergence

The crude oil bounce continues but the primary trend is down. WTI Light Crude (shown here on a monthly chart) is likely to test resistance at $60/barrel, followed by another test of primary support at $45.

Crude Oil

Weak crude tends to coincide with a weak gold price. At present the two commodities are diverging, with gold rallying as crude falls. Safe haven demand for gold, due to rising global uncertainty, is the most likely explanation.

Spot Gold and Crude Oil adjusted for inflation (CPI)

Spot Gold is testing resistance at $1350/ounce. Breakout would signal a primary advance but gold is expected to follow oil lower in the long-term.

Spot Gold in USD

The All Ordinaries Gold Index broke resistance at 5400/5500, signaling an advance to 7000. Strength of the advance depends on a weaker Aussie Dollar and/or a stronger gold price in US Dollars.

All Ordinaries Gold Index

Gold rallies but so does the Dollar

A long-term (monthly) chart shows Crude Oil (WTI Light Crude) has broken below its trend channel and is testing support at $45/barrel.

Crude Oil

Weak crude tends to coincide with a strong Dollar. Breakout of the Dollar index above 97 is likely. Rising Trend index troughs indicate buying pressure.

Dollar Index

Gold is headed for another test of resistance at $1350/ounce but a strong Dollar is likely to undermine a primary advance.

Spot Gold in USD

The All Ordinaries Gold Index broke resistance at 5400/5500, signaling a primary advance with a target of 7000. That will depend on further weakness in the Aussie Dollar and/or a stronger gold price.

All Ordinaries Gold Index

Conclusion: We are witnessing a rally in Gold due to global uncertainty but the LT outlook, with declining crude and a stronger Dollar, is still bearish.

Retail sales fall while trade talks stall

Retail sales

Retail sales growth (USA advance retail sales excluding autos and parts) fell sharply in December, indicating that consumer confidence is fading despite strong employment figures.

Advance Retail Sales

The decline in consumer confidence also shows in lower January 2019 light vehicle sales.

Light Vehicle Sales

Trade talks make little progress

Trivium provide a useful update on US-China trade negotiations:

The latest round of trade talks with the US are finishing up as we go to press. There hasn’t been much progress (Bloomberg): “As of Friday afternoon, there had been no visible progress on efforts to narrow the gap around structural reforms to China’s economy that the U.S. has requested, according to three U.S. and Chinese officials who asked not to be identified because the talks were private……Chinese officials are angry about what they see as US efforts to undermine their state-led economy.”

These are issues that will take generations to resolve. The chance of a quick fix is highly unlikely.

Stocks

The stock market continues to rally on the back of a solid earnings season.

Of the 216 issues (505 in the S&P 500 index) with full operating comparative data 154 (71.3%) beat, 51 (23.6%) missed, and 11 met their estimates; 135 of 215 (62.8%) beat on sales. (S&P Dow Jones Indices)

Index volatility remains high, however, and a 21-day Volatility trough above 1.0% would warn of a bear market. S&P 500 retreat below 2600 would reinforce the signal.

S&P 500

Crude prices continue to warn of a fall in global demand.

Light Crude

As do commodity prices.

DJ-UBS Commodities Index

10-Year Treasury yields are testing support at 2.50% and a Trend Index peak below zero warns of buying pressure from investors seeking safety (yields fall as prices rise).

10-Year Treasury Yield

The Nasdaq 100 shows rising Money Flow but I believe this is secondary in nature. The next correction is likely to provide a clearer picture.

Nasdaq 100

My conclusion is the same as last week. This is a bear market. Recovery hinges on an unlikely resolution of the US-China ‘trade dispute’.

Concessions to adversaries only end in self reproach, and the more strictly they are avoided the greater will be the chance of security.

~ Thucydides (460 – 400 B.C.)

More signs of risk avoidance

Bloomberg: “U.S. stocks slid as investors grew anxious that the Trump administration won’t reach a trade deal with China before a March deadline for escalating the war. Treasuries surged.

The post-Christmas rally that added 16 percent to the S&P 500 came under increasing pressure amid reports the two trading partners remained far apart on a deal and that the nations’ presidents won’t meet before higher tariffs are slated to take effect on Chinese goods next month.”

S&P 500 volatility remains high. If the rally runs out of steam, a large Twiggs Volatility (21-day) trough above 1.0% would signal a bear market. Retreat below 2600 would reinforce the signal.

S&P 500

Crude prices retreated below resistance at $54/$55 per barrel, on fears of falling global (mainly Chinese) demand. Another test of primary support at $42/barrel is likely.

Light Crude

10-Year Treasury yields retreated to 2.65%. A Trend Index peak below zero warns of buying pressure from investors (yields fall when prices rise) who are looking for safety.

10-Year Treasury Yield

My conclusion is the same as last week. This is a bear market. Recovery hinges on an unlikely resolution of the US-China ‘trade dispute’.

The secret of happiness is freedom and the secret of freedom is courage.

~ Thucydides (460 – 400 B.C.)

Gold and the Dollar direction

Crude Oil (WTI Light Crude) respected support at $45/barrel, with turmoil in Venezuela raising concerns over supply. Breakout above $55 would signal another rally but declining peaks on the Trend Index warn of selling pressure. Expect another test of $45. Breach of support would signal a decline to test the 2016 low at $26/barrel.

Crude Oil

The Dollar index is weakening. If China continues to support the Yuan, we may see a correction to test support at 92. A lot will depend on trade talks in the next two weeks but I expect continued Dollar strength and Yuan weakness.

Dollar Index

The PBOC increased support for the Yuan over the last month, leading up to the US-China trade talks, causing the Dollar to weaken.

Chinese Yuan/USD

Gold has ranged below resistance at $1350/ounce for the past five years. Expect another test of $1350 if the Dollar weakens. Breakout would signal a primary up-trend but LT Dollar strength is likely ….and a correction to test support at $1200.

Spot Gold in USD

A weakening Australian Dollar has helped Aussie gold stocks. The All Ordinaries Gold Index broke resistance at 5400, signaling a primary advance with a target of 7000. But that depends on further weakness in the Aussie Dollar (< 70 US cents?) and/or a stronger gold price (> $1350?)

All Ordinaries Gold Index

Conclusion: We are witnessing a rally in Gold due to global uncertainty but the LT outlook, with declining crude and a stronger Dollar, is bearish.

Gold: Bull or bear?

Gold is testing resistance at $1300/ounce and is likely to follow-through to the long-term (LT) ceiling at $1350. Trend Index  on the LT  monthly chart displays a large triangular consolidation, indicating uncertainty. Upward breakout would signal a primary up-trend but this is unlikely, for three reasons. First, this is a bear market. A decline is more likely for that reason alone. Target for a decline is the 2015 low at $1050/ounce.

Spot Gold in USD

Second, a strengthening Dollar is likely to weaken Gold. I have inverted the LT chart of the Dollar Index (and Trend Index) below so that it is easier to relate to gold. As the Dollar strengthened, denoted by a LT fall on the inverted chart, Gold has weakened. The Dollar index shows a broadening consolidation since 2015, with bull and bear traps, again indicating uncertainty. At present, the Dollar is testing resistance at 97 but is likely to follow through to test LT resistance at 100. Rising Trend Index troughs above zero (remember the scale is inverted) signal buying pressure.

Dollar Index inverted

Third, falling Crude Oil prices are bearish for Gold. The LT chart below compares spot crude  to  spot gold, both adjusted for inflation to bring earlier peaks into proper perspective. The LT relationship is clear: gold and crude tend to rise and fall together. Crude prices have recently tumbled, exerting downward pressure on Gold.

Gold and Crude Oil, adjusted by CPI

Conclusion: We are witnessing a rally in Gold because of global uncertainty but the LT outlook is bearish.