Inflation is coming

Inflation tops investor concerns according to Fed report

Concerns over higher inflation and tighter monetary policy have become the top concern for market participants, pushing aside the COVID-19 pandemic, the Federal Reserve said on Monday in its latest report on financial stability. ….Roughly 70% of market participants surveyed by the Fed flagged inflation and tighter Fed policy as their top concern over the next 12 to 18 months, ahead of vaccine-resistant COVID-19 variants and a potential Chinese regulatory crackdown. (Investing.com)

The market is no longer buying the Fed’s talk of “transitory” inflation.

Fed’s Bullard expects two rate hikes in 2022

St. Louis Federal Reserve Bank President James Bullard on Monday said he expects the Fed to raise interest rates twice in 2022 after it wraps up its bond-buying taper mid-year, though he said if needed the Fed could speed up that timeline to end the taper in the first quarter. “If inflation is more persistent than we are saying right now, then I think we may have to take a little sooner action in order to keep inflation under control,” Bullard said in an interview on Fox Business Network……Bullard has been among the Fed’s biggest advocates for an earlier end to the Fed’s policy easing, given his worries that inflation may not moderate as quickly or as much as many of his colleagues think it will. (Reuters)

The Fed are reluctant to hike interest rates, to rein in inflationary pressures, as it would kill the recovery.

Producer Price Index

Producer prices (PPI) climbed more than 22% in the 12 months to October 2021, close to the high from 1974 (23.4%). Consumer prices have diverged from PPI in recent years but such a sharp rise in PPI still poses a threat to the economy.

Producer Price Index (PPI) & Consumer Price Index (CPI)

Iron and steel prices, up more than 100% year-on-year (YoY), will inevitably lead to price increases for automobiles and consumer durables. Other notable YoY increases in key inputs are construction materials (+30.6%), industrial chemicals (+47.3%), aluminium (+40.7%), and copper (+34.5%).

Producer Price Index: Commodities

Underlying many of the above price rises is a sharp increase in fuel, related products and power: up 55.7% over the past 12 months.

Producer Price Index: Fuel & Energy

Conclusion

Inflation is coming, while the Fed are reluctant to hike interest rates. Buy Gold, precious metals, commodities, real estate, and stocks with pricing power —  a strong competitive position which enables them to pass on price increases to their customers — if you can find them at reasonable prices. Avoid financial assets like bonds and bank term deposits.

Markets that are likely to outperform in 2021

There is no reliable benchmark for assessing performance of different markets (stocks, bonds, precious metals, commodities, etc.) since central banks have flooded financial markets with more than $8 trillion in freshly printed currency since the start of 2020. The chart below from Ed Yardeni shows total assets of the five major central banks (Fed, ECB, BOC, BOE and BOJ) expanded to $27.9T at the end of November 2020, from below $20T at the start of the year.

Central Banks: Total Assets

With no convenient benchmark, the best way to measure performance is using relative strength between two prices/indices.

Measured in Gold (rather than Dollars) the S&P 500 iShares ETF (IVV) has underperformed since mid-2019. Respect of the red descending trendline would confirm further weakness ahead (or outperformance for Gold).

S&P 500 iShares ETF/Gold

But if we take a broad basket of commodities, stocks are still outperforming. Reversal of the current up-trend would signal that he global economy is recovering, with rising demand for commodities as manufacturing output increases. Breach of the latest, sharply rising trendline would warn of a correction to the long-term rising trendline and, most likely, even further.

S&P 500 iShares ETF/DJ-UBS Commodity Index

Commodities

There are pockets of rising prices in commodities but the broader indices remain weak.

Copper shows signs of a recovery. Breakout above -0.5 would signal outperformance relative to Gold.

Copper/Gold

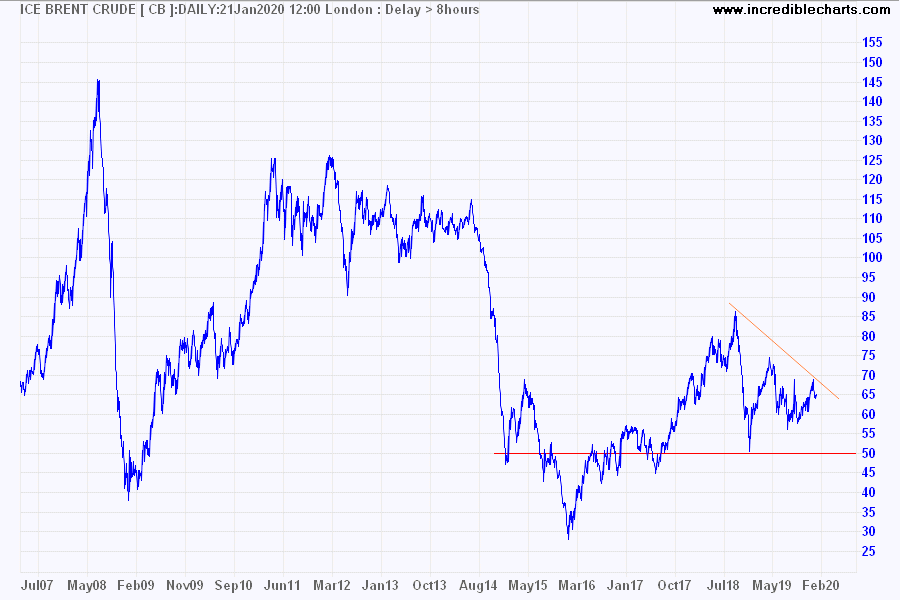
Brent crude shows a similar rally. Breakout above the declining red trendline would suggest outperformance ahead.

Brent Crude/Gold

But the broad basket of commodities measured by the DJ-UBS Commodity Index is still in a down-trend.

DJ-UBS Commodity Index/Gold

Precious Metals

Silver broke out of its downward trend channel relative to Gold. Completion of the recent pullback (at zero) confirms the breakout and signals future outperformance.

Silver/Gold

Stock Markets

Comparing major stock indices, the S&P 500 has outperformed the DJ Stoxx Euro 600 since 2010. Lately the up-trend has accelerated and breach of the latest rising trendline would warn of reversion to at least the long-term trendline. More likely even further.

S&P 500 iShares ETF/Euro Stoxx 600

The S&P 500 shows a similar accelerating up-trend relative to the ASX 200. Breach of the latest trendline would similarly signal reversion to the LT trendline and most likely further.

S&P 500 iShares ETF/ASX 200

Reversion is already under way with India’s Nifty 50 (NSX), now outperforming the S&P 500.

S&P 500 iShares ETF/Nifty 50

S&P 500 performance relative to the Shanghai Composite plateaued at around +0.4. Breakout would signal further gains but respect of resistance is as likely.

S&P 500 iShares ETF/Shanghai Composite

Growth/Value

Looking within the Russell 1000 large caps index, Growth stocks (IWF) have clearly outperformed Value (IWD) since 2006. Breach of the latest, incredibly steep trendline, however, warns of reversion to the mean. We are likely to see Value outperform Growth in 2021.

Russell 1000 Value/Growth

Bonds

The S&P 500 has made strong gains against Treasury bonds since March (iShares 20+ Year Treasury Bond ETF [TLT]) but is expected to run into resistance between 1.3 and 1.4. Rising inflation fears, however, may lower bond prices, spurring further outperformance by stocks.

S&P 500 iShares ETF/Long_term Bond ETF (TLT)

Currencies

The US Dollar is weakening against a basket of major currencies. Euro breakout above resistance at $1.25 would signal a long-term up-trend.

Euro/Dollar

China’s Yuan has already broken resistance at 14.6 US cents, signaling a long-term up-trend.

Yuan/Dollar

India’s Rupee remains sluggish.

Indian Rupee/Dollar

But the Australian Dollar is surging. The recent correction that respected support at 70 US cents suggests an advance to at least 80 cents.

Australian Dollar/Dollar

Gold, surprisingly, retraced over the last few months despite the weakening US Dollar. But respect of support at $1800/ounce would signal another primary advance.

Spot Gold/Dollar

Conclusion

Silver is expected to outperform Gold.
Gold is expected to outperform stocks.
Value stocks are expected to outperform Growth.
India’s Nifty 50 is expected to outperform other major indices. This is likely to be followed by the Stoxx Euro 600 and ASX 200 but only if they break their latest, sharply rising trendlines. That leaves the S&P 500 and Shanghai Composite filling the minor placings.
Copper and Crude show signs of a recovery but the broad basket of currencies is expected to underperform stocks and precious metals.
The Greenback is expected to weaken against most major currencies, while rising inflation is likely to leave bond investors holding the wooden spoon.

Crude oil: Opportunities and value traps

On the weekend we wrote that the bottom had fallen out of the oil market after Nymex crude broke support at $20 per barrel.

Now, the previously unimaginable has occurred, with Nymex Light Crude falling below zero for the first time in history, closing at -$13.10 per barrel with reports of intra-day lows at -$37.63.

WTI Crude

From The Age:

“Traders are still paying $US20.43 for a barrel of US oil to be delivered in June, which analysts consider to be closer to the “true” price of oil. Crude to be delivered next month, meanwhile, is running up against a stark problem: traders are running out of places to keep it, with storage tanks close to full amid a collapse in demand as factories, automobiles and airplanes sit idled around the world.

Tanks at a key energy hub in Oklahoma could hit their limits within three weeks, according to Chris Midgley, head of analytics at S&P Global Platts. Because of that, traders are willing to pay others to take that oil for delivery in May off their hands, so long as they also take the burden of figuring out where to keep it.”

Cushing Storage

Brent Crude is trading at $25.57 per barrel but a Trend Index peak deep below zero warns of similar strong selling pressure.

Brent Crude

Outlook

Crude oil production is still in a long-term up-trend. Low prices may present opportunities to buy cyclical stocks at historically low prices.

IEA Oil Production

The Oil & Gas sector has plunged as expected.

DJ US Oil & Gas

Oil infrastructure is also suffering from low activity levels.

DJ US Pipelines

Energy-consuming industries, however, may benefit from lower oil prices.

EIA: Industrial Sectors

Transport

Transport is the biggest consumer of crude oil products.

IEA Oil Sectors

If we break usage down by fuel types, the largest is diesel/gas, followed closely by motor gasoline, with jet kerosene significantly smaller.

Products from Crude

Airlines which have suffered from a massive drop in air travel.

DJ US Airlines

While delivery services (formerly air freight) are suffering from the collapse of global trade.

DJ US Delivery Services

So is marine transport.

DJ US Marine Transport
But trucking is holding up well.

DJ US Trucking

Construction Materials

Crude oil runs a distant second to coal as the chief energy source for cement production.

IEA Cement - Energy Usage

But the industry is a heavy transport user and should benefit from lower oil prices.

DJ US Construction Materials

Mining

Mining is also likely to benefit from lower extraction and transport costs.

DJ US Basic Materials

Forestry & Paper

Forestry is another heavy fuel user.

DJ US Forestry & Paper

Chemicals & Plastics

Basic chemicals (including fertilizers) are the largest industrial consumer of crude oil.

DJ US Chemicals

Specialty chemicals are also largely oil-based.

DJ US Specialty Chemicals

Aerospace & Automobiles

Aerospace, laid low by problems at Boeing (BA), has been floored by a massive downturn in the airline industry and will take a long time to recover.

DJ US Aerospace

Automobiles have so far stood up well because of stellar performance from the likes of Tesla (TSLA).

DJ US Automobiles

But the sting is in the tail. Light vehicle sales have plummeted.

Light Vehicle Sales

Low vehicle sales and less travel also means lower tire sales.

DJ US Tires

Oil Producers in Affected Regions

The IEA graph below shows producing regions that are uneconomic at varying prices/barrel (x-axis). If we take $25/barrel as the average over the next two years, North American producers would suffer the most, followed by Asia-Pacific and Latin America.

Uneconomic Crude Production by Country

Middle-Eastern producers enjoy the lowest extraction costs and are mostly still profitable at lower prices.

Avoiding Value Traps

Value opportunities abound in industries that are badly affected by the economic contraction and falling crude prices — as well as by those industries that stand to benefit from low oil prices. Some affected industries, however, are going to struggle to survive without state assistance.

The problem with value stocks is that, although they may seem cheap, prices can fall a lot further. That is why we use both technical and fundamental analysis to evaluate opportunities.

There are many stocks that are trading well below our assessment of fair value at present but we will not buy until the technical outlook turns bullish. It takes plenty of patience. But helps to avoid value traps.

The stock market remains an exceptionally efficient mechanism
for the transfer of wealth from the impatient to the patient.

~ Warren Buffett

The S&P 500 and Plan B

The S&P 500 penetrated its rising trendline, warning of a re-test of support at 3000. But selling pressure on the Trend Index appears to be secondary.

S&P 500

Transport bellwether Fedex retreated below long-term support at 150 on the monthly chart — on fears of a slow-down in international trade. Follow-through below 140 would strengthen the bear signal, offering a target of 100. The bear-trend warns that economic activity is contracting.

Fedex

Brent crude dropped below $60/barrel on fears of a global slow-down. Expect a test of primary support at 50.

Brent Crude

Dow Jones – UBS Commodity Index broke primary support at 76 on the monthly chart, also anticipating a global slow-down.

DJ-UBS Commodity Index

South Korea’s KOSPI Index is a good barometer for global trade. Expect a re-test of primary support at 250.

KOSPI

While Dr Copper, another useful barometer, warns that the patient (the global economy) is in need of medical assistance.

Copper (S1)

The Fed can keep pumping Dollars into financial markets but at some point, the patient is going to stop responding. In which case you had better have a Plan B.

Commodities & Global Growth

Commodity prices warn that the global economy is still in a slump.

The Dow Jones – UBS Commodity Index remains at one-third of its 2007 peak, with no sign of recovery.

DJ-UBS Commodity Index

The fall in crude prices hasn’t been as severe, but Brent Crude is again weakening and looks set for another test of $50/barrel.

Brent Crude

Shipping rates for dry bulk goods, such as iron ore and coal, have fallen, with the Baltic Dry Index close to long-term support at 500.

Baltic Dry Index

Supply interruptions to iron ore production in Brazil have cushioned Australian producers from a sharp down-turn in iron ore prices. But coal exporters are feeling the pinch.

RBA Chart Pack: Bulk Commodity Prices

Recovery of Brazilian production over the next two years is expected to add downward pressure to iron ore prices.

The only positive appears to be container shipping rates. The Harpex Index rose steeply in 2019, reflecting increased demand for container shipping of finished goods.

Harpex Index

Somewhat surprising, since this coincided with US-China trade tensions and tariff increases. The answer may lie with importers on both sides of the Pacific attempting to front-run the imposition of tariffs and build inventories in case of supply interruptions and to allow time to adapt their supply chain. Expect the index to retreat in the early part of 2020.

It looks like low global growth will continue.

S&P 500: Upside limited, while downside risks grow

Corporate profits (before tax) ticked up slightly in the second quarter of 2019 but remain below 2006 levels in real terms. The chart below shows corporate profits adjusted for inflation using the GDP implicit price deflator.

Real GDP and Hours Worked

Growth in production of durable consumer goods remains week, reflecting poor consumer confidence.

Durable Goods Production

The chart below shows growth in bank credit and the broad money supply (MZM plus time deposits). Credit growth (blue) remains steady at around 5%, slightly ahead of nominal GDP growth (4.04% for 12 months ending June); a healthy sign. Broad money (green) surged upwards in the first three quarters of this year. Not an encouraging sign when there were similar surges in broad money before the last two recessions.

Broad Money & Credit Growth

The S&P 500 is testing resistance at 3000. Bearish divergence on Twiggs Money Flow warns of secondary selling pressure. Expect a test of support at 2800. Breach would flag a reversal, with a target of 2400.

S&P 500

The cyclical Retailing Index displays a similar pattern, with resistance between 2450 and 2500.

Retail

Our view is that upside is limited, while downside risks are growing.

On the global front, the outlook is still dominated by the prospect of a prolonged US-China trade war. More great insights from Trivium China:

Tariff delays may be aimed at creating warm, fuzzy feelings before the next round of talks in early October, but……These small gestures do nothing to resolve the underlying trade conflict. We’re still pessimistic on prospects for a deal.

Zhou Xiaoming – China’s former top diplomat in Geneva – expressed the same view in a recent interview (Guancha):
“The two sides disagree too much on the objectives of the negotiations……It is almost impossible to reach an agreement in the short term.”

Zhou urged Chinese officials to be clear on the US’s objective:
“Economic and technological decoupling is the objective of the entire US government.”

Zhou said that officials must prepare for that potentiality, even if it is not their desired outcome.

So should we.

Dow Jones – UBS Commodity Index found support at 76 before rallying to 79. Rising troughs on the Trend Index reflect increased support. Consolidation between 76 and 81 is likely but we maintain our bearish long-term outlook for commodities.

DJ-UBS Commodities Index

On the global front, weak crude oil prices flag an anticipated slow-down in the global economy. Trend Index peaks below zero indicate selling pressure. Breach of support at $50/$51 per barrel would be a strong bear signal, warning of a decline to $40 per barrel.

Nymex Light Crude

We maintain our investment in quality growth stocks but have reduced equity exposure to 40% of (International Growth) portfolio value.

S&P 500: Flight to safety

10-Year Treasury yields are near record lows after Donald Trump’s announcement of further tariffs on China. The fall reflects the flight to safety, with rising demand for Treasuries as a safe haven.

10-Year Treasury Yield

Crude found support at $50/barrel. Breach would warn of a new down-trend, with a target of $40/barrel. Declining crude prices reflect a pessimistic outlook for the global economy.

10-Year 3-Month Treasury Spread

The S&P 500 found support at 2850. Rising volatility warns of increased market risk. A test of support at 2750 remains likely.

S&P 500

Declining Money Flow on the Nasdaq 100 reflects rising selling pressure. Expect a test of 7000.

Nasdaq 100

The Shanghai Composite Index broke support at 2850. A Trend Index peak at zero warns of strong selling pressure. Expect a test of support at 2500.

Shanghai Composite Index

India’s Nifty is testing support at 11,000. Breach would offer a target of 10,000.

Nifty Index

Dow Jones Euro Stoxx 600, reflecting large cap stocks in the European Union, is testing primary support at 368. Strong bearish divergence on the Trend Index warns of a double-top reversal, with a target of 330.

DJ Euro Stoxx 600

The Footsie is similarly testing support at 7150. Breach would offer a target of 6600.

FTSE 100

I have warned clients to cut exposure to the market. It’s a good time to be cautious.

“There is a time for all things, but I didn’t know it. And that is precisely what beats so many men in Wall Street who are very far from being in the main sucker class. There is the plain fool, who does the wrong thing at all times everywhere, but there is the Wall Street fool, who thinks he must trade all the time.”

~ Jesse Livermore

Be wary of investing in a rigged market

The S&P 500 recovered above 3000, suggesting another advance, but bearish divergence on Twiggs Money Flow warns of (secondary) selling pressure.  Further tests of new support at 2950 are likely.

S&P 500

Falling commodity prices warn of declining global demand.

DJ-UBS Commodity Index

Declining crude prices reinforce the warning.

Nymex Light Crude

While in the US, the Cass Freight Index formed a lower peak. Follow-through below the previous trough would warn of a down-trend and declining activity.

Cass Freight Index

Capital goods orders, adjusted for inflation, continue to decline.

Capital Goods Orders

Housing starts are steady but declining building permits warn of a slow-down ahead.

Housing Starts and Building Permits

Craig Johnson of Piper Jaffray says odds of a recession are growing:

“The bond market has already priced in two rate cuts at this point in time, and potentially part of a third,” Johnson said. “History has always said that bonds lead equities and we need to listen to that message. I think that’s what the smart money is doing…I guess we can’t seem to quite get off of the monetary train that we’ve gotten ourselves onto, and I don’t think it’s quite so simple.”

S&P 500 PEmax

Trailing price-earnings (PEmax) are above 20, historically a warning that the market is over-heated. The biggest buyers of stocks are the companies themselves, through buybacks. The Fed is expected to cut rates while employment growth is still strong. Price signals are being distorted.

Be wary of investing in a rigged market. It’s a good time to be cautious.

“It is optimism that is the enemy of the rational buyer.”

~ Warren Buffett

Trade war reality sinks in

Realization that we are slipping into a trade war is starting to sink in.

The S&P 500 broke medium-term support at 2800, warning of a correction. The target is primary support at 2400. Volatility is flashing an amber warning, above 1.0%.

S&P 500

Nymex crude is plunging as anticipated global demand falls.

Crude Oil

Long-term Treasury yields are falling, with the 10-Year headed for a test of support at 2.0%. The Yield Differential (purple line) is back below zero, warning of a recession.

Yield Differential: 10-Year and 3-Month Treasuries

As I have mentioned earlier, a negative yield curve is a reliable early indicator of recession but trouble is imminent when it recovers above zero. Normally caused by the Fed cutting interest rates in response to falling employment growth. The critical indicator to watch is non-farm payroll growth. When that falls below 1.0% (right-hand scale), watch out!

Employment Growth and Fed Funds Rate

War is an evil thing; but to submit to the dictation of other states is worse…. Freedom, if we hold fast to it, will ultimately restore our losses, but submission will mean permanent loss of all that we value…. To you who call yourselves men of peace, I say: You are not safe unless you have men of action on your side.

~ Thucydides (circa 400 BC)

Employment lifts but S&P 500 tentative

Growth in total non-farm payrolls ticked up to 1.76% for the 12 months to April 2019, supporting Fed reluctance to cut interest rates.

Payroll Growth

The Philadelphia Fed Leading Index has been revised upwards, above a comfortable 1.0%.

Leading Index

Real GDP growth came in at a healthy 3.2% for the 12 months ended 31 March 2019 but growth in total hours worked sagged to 1.47%, suggesting that GDP growth is likely to slow.

Real GDP and Total Hours Worked

Growth in average hourly earnings came in at 3.23% (total private), suggesting that inflationary pressures remain under control. Little chance of a Fed rate hike either.

Average Hourly Earnings

The S&P 500 retracement respected support at 2900. Rising Money Flow indicates buying pressure but gains seem tentative.

S&P 500

US growth looks to continue but commodity prices warn that global growth is slowing.

Nymex crude penetrated its lower trend channel, warning of a correction. Despite the supply impact of increasing sanctions on Iran and Venezuela, and the threat of supply disruption in Libya.

Nymex Light Crude

A similar correction on DJ-UBS Commodities index reinforces that global demand is slowing.

DJ-UBS Commodities Index