Australia: Warning signs of a contraction

Australia faces shrinking inflationary pressures.

Inflation

Wage growth is falling.

Wage Price Index

Credit growth is shrinking.

Inflation

Growth of currency in circulation is also slowing. The fall below 5% warns of a contraction.

Currency in Circulation: Growth

One piece of good news is that Chinese monetary policy seems to be easing. After a sharp contraction of M1 money stock growth in January, February shows a partial recovery. Collapse of the Chinese property bubble may be deferred a while longer.

China M1 Money Stock

Which is good news for iron ore exporters. At least in the short-term.

Inflation surges

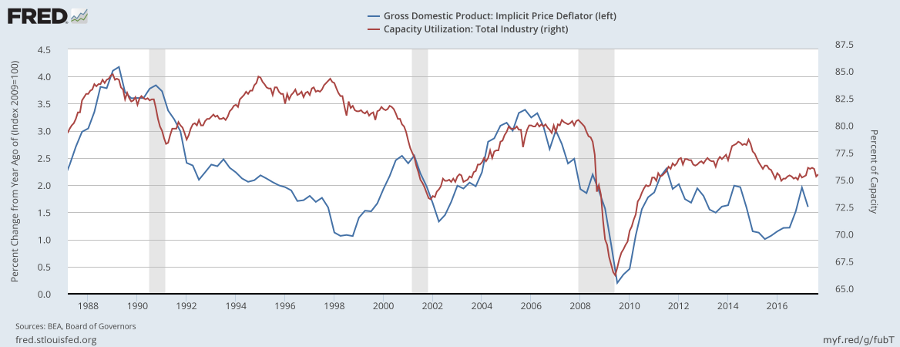
Inflation is rising, with CPI climbing steeply above the Fed’s 2% target. But core CPI excluding energy and food remains stable.

Consumer Price Index

Job gains were the lowest since May 2016.

Job Gains

But the unemployment rate fell to a low 4.5%.

Unemployment

Hourly wage rate growth has eased below 2.5%, suggesting that underlying inflationary pressures are contained.

Average Hourly Earnings Growth

The Fed is unlikely to accelerate its normalization of interest rates unless we see a surge in core inflation and/or hourly earnings growth.

Jobs, Inflation & the Fed | ECRI

From Lakshman Achuthan at ECRI:

Headline jobs growth came in well below expectations, and weather played some part in suppressing job growth, both in construction and retail.

But the jobless rate dropped to 4.5%, its lowest reading since 2007, so the Fed’s “full-employment” mandate has been met.

Their other mandate is on inflation, and over the past year I’ve discussed our U.S. Future Inflation Gauge, which anticipated the inflation cycle upturn shown by the chart. Today the forward looking USFIG remains near an 8¾ -year high.

The chart shows the year-over-year PCE inflation rising sharply to a 5-year high, and breaching the Fed’s 2% inflation target which is defined by this inflation measure.

For those who might think this is just about oil prices, please note that core PCE inflation, ex-food and energy, has also been rising, and now above 1¾%, the highest reading in over 2½ years.

This is what a cyclical upswing in inflation looks like.

Moreover, the U.S. economy has a good tailwind from rising global growth.

All of this helps explain why the Fed is finally able to implement a full-fledged rate hike cycle.

Source: Jobs, Inflation & the Fed | News | News and Events | ECRI

Robert Shiller: Is he right that stocks are overpriced?

I frequently come across stocks such as Netflix [NFLX], trading on a forward PE of 137 (Morningstar), or even Coca Cola [KO] and Procter & Gamble [PG] that leave me muttering about unrealistic valuations.

Nobel laureate Robert Shiller this week commented that he was no longer buying stocks as he believed they were overvalued. His justification is the CAPE index which compares current stock prices to the 10-year average of inflation-adjusted earnings.

Shiller CAPE Index

The index is below its Dotcom high but is approaching the same level that it peaked at in 1929. Is the CAPE index flawed or does this portend disaster?

Bear in mind that Shiller is not selling all his existing stocks — he has merely stopped buying — and is the first to point out that the CAPE index is a poor tool for timing market tops and bottoms.

Before we make any rash decisions let us compare Shiller’s index to a few other handy measures of market valuation.

Warren Buffett’s favorite

Warren Buffett’s favorite measure of market value is to compare total stock market capitalization to GDP. The higher the ratio, the more the stock market is overvalued.

US Market Cap to GDP

This looks even worse than the CAPE index, with market cap to GDP well above its 2007 high and well on its way to Dotcom levels.

Adapting the ratio to include offshore earnings of multinational companies makes very little difference to the results. Here I compare market cap to GNP as well as GDP. GNP, or gross national product, includes offshore earnings of domestioc companies rather than just domestic earnings as with GDP. The end result is much the same.

US Market Cap to GNP

Market Cap to Corporate Profits

When we compare market capitalization to current profits after tax, however, valuations are still high but nowhere near the irrational exuberance of the Dotcom era.

US Market Cap to Profits after Tax

The current peak resembles earlier peaks in the 1980s and 1960s.

What this tells us is that corporate profits are rising faster than GDP. And that a 10-year average may be a poor reflection of future sustainable earnings.

Sustainable Earnings

Are current earnings sustainable? There is no clear answer to this. But there are some key criteria if earnings are to remain at current levels of GDP.

First, wage rate growth remains low. The graph below illustrates how profits fall when employee compensation rises (per unit of value added).

Wage Rates

Second, that interest rates stay low. The Fed is doing its best to normalize interest rates but monetary tightening would spoil the party. That is, deliberate tightening by the Fed to subdue rising inflationary pressures.

A third element is corporate taxes but there seems little risk of rising taxes in the current climate.

The key variable for both #1 and #2 is wage rates. At present these are subdued, so no cause for alarm.

Wage Rates

….yet.

Australia’s economic growth is slowing.

Employment and Participation rates are falling.

Australia Employment & Participation Rates

Wage rate growth is slowing.

Australia Wage Rates

Slowing wage rate growth and inflation confirm that the economy is faltering.

Australia Underlying Inflation

The RBA, with one eye on the housing bubble, has indicated its reluctance to cut rates further. Increased infrastructure spending by Federal and State governments seems the only viable alternative.

With the motor industry winding down and apartment construction headed for a cliff, this is becoming increasingly urgent.

US Job Growth, Wage Rates & Inflation

Payrolls jumped by a seasonally adjusted 235,000 jobs in February, setting the Fed on track for another rate rise next week.

US Job Growth

GDP growth is projected to lift in line with employment, wage rates and hours worked. At this stage, the Fed is still attempting to normalize interest rates rather than slow the economy to cool inflationary pressures.

Projected GDP

Wage rate growth remains muted, at close to 2.5 percent, so rate hikes are likely to proceed at a gradual pace.

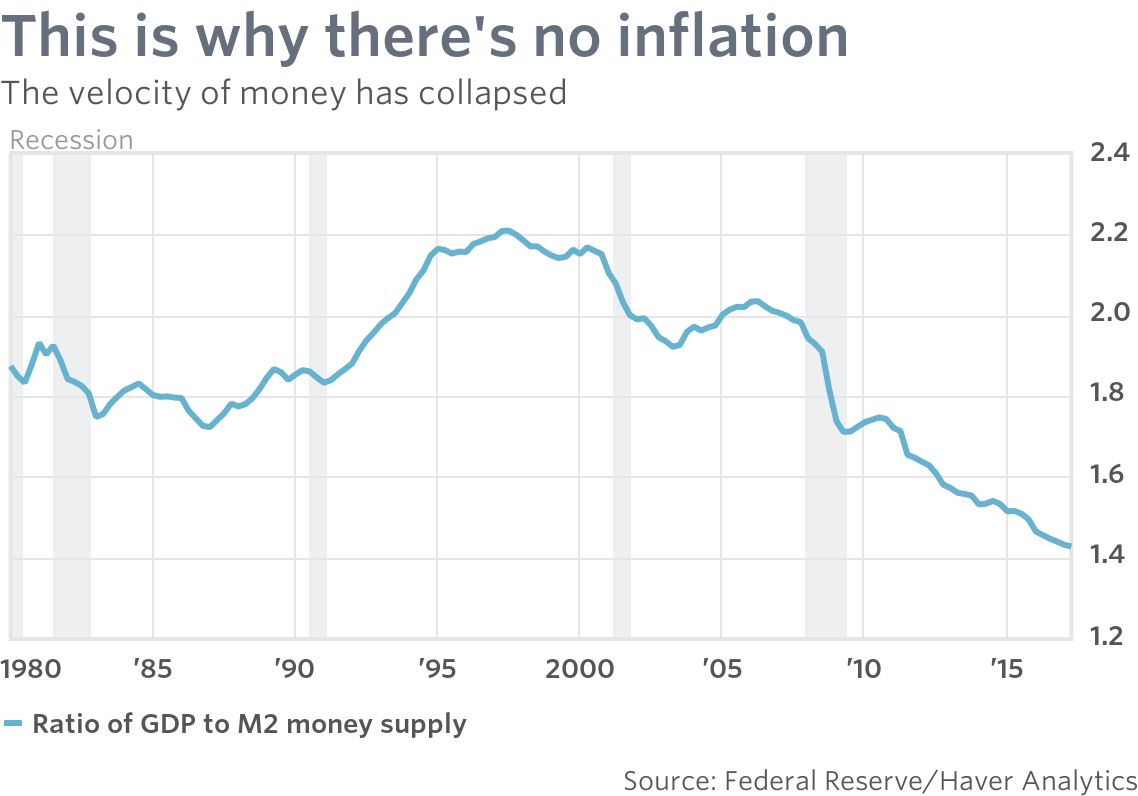
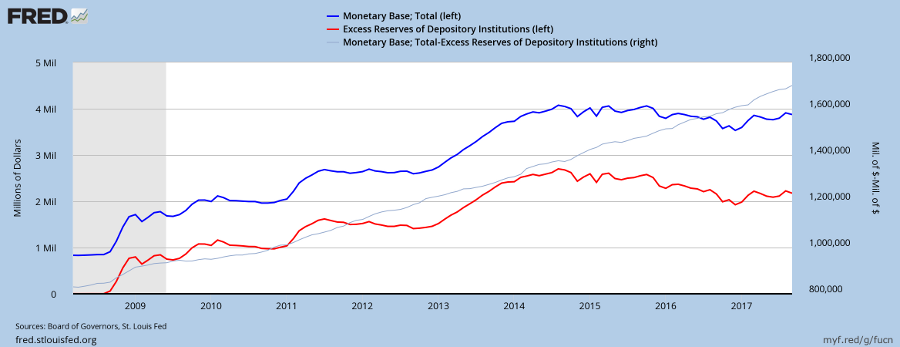
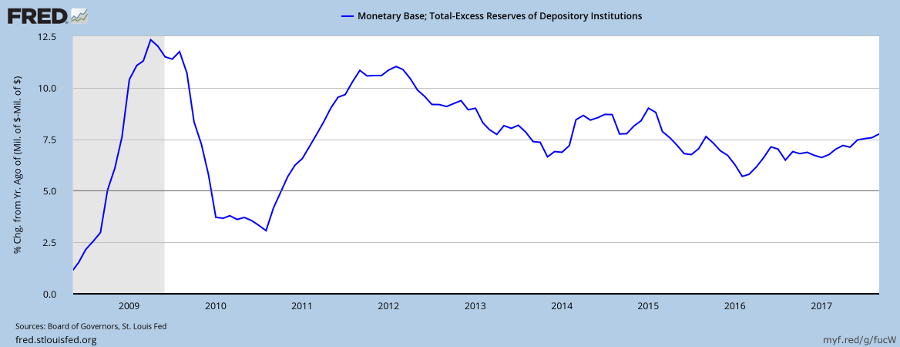
Hourly Wage Rates and Money Supply

The need to tighten monetary policy is only likely to be seriously considered when wage rate growth [light green] exceeds 3.0 percent [dark green line]. Then you are likely to witness a dip in money supply growth [blue], as in 2000 and 2006, with bearish consequences for stocks.

*The dip in 2010 was a mistake by the Fed, taking its foot off the gas pedal too soon after the 2008 crash.

The key component driving inflation

Two interesting graphs on inflation from Niels Jensen at Absolute Return Partners:

….similarities between the story unfolding in the UK and the one in the US. Core inflation in both countries is significantly higher than it is in the Eurozone – just above 2% in the US and just below 2% in the UK whereas, in the Eurozone, it is only 0.9%. Furthermore, services are very much the engine that drives core inflation in both the UK and the US (exhibit 6).

Exhibit 6: The drivers of core inflation (US only)Source: The Daily Shot, BEA, Bureau of Labor Statistics, Haver Analytics, February 2017. Data as of December 2016

To a very significant degree that is down to rising medical care costs (exhibit 7). As the populace ages, this can only get worse – at least in the US, where almost all healthcare is provided privately and paid for by insurance companies.

Exhibit 7: US personal consumption expenditures by component (%)
Source: The Daily Shot, BEA, Haver Analytics, February 2017

Source: A Note on Inflation: Is it here or isn’t it? – The Absolute Return Letter

Australia & Canada in 4 charts

RBA governor Phil Lowe recently made a speech comparing the experiences of Australia and Canada over the last decade. Both have undergone a resources and housing boom. Four charts highlight the differences and similarities between the two countries.

Australia’s spike in mining investment during the resources boom did serious damage to non-mining investment while Canada’s smaller boom had no impact.

Australia & Canada: Mining v. Non-Mining Investment

Immigration fueled a spike in population growth in Australia, adding pressure on infrastructure and housing.

Australia & Canada: Population Growth

Both countries are experiencing a housing bubble, fueled by low interest rates and lately by export of China’s property bubble, with capital fleeing China and driving up house prices in the two countries.

Australia & Canada: Housing

Record levels of household debt make the situation more precarious and vulnerable to a correction.

Australia & Canada: Household Debt

Hat tip to David Llewellyn-Smith at Macrobusiness

The Threat of Inflation

From the Trading Diary:

I received a message from a US reader suggesting I should “stay out of politics”.

I would love to stay out of politics. Frankly, I find it tiresome. Unfortunately, politics and the economy are so intertwined as to make the study of one meaningless without consideration of the other. I say “unfortunately” because a lot of the damage done to the economy is caused by the political system.

As for Donald Trump, I am a conservative but do not support him. He is not another Reagan who can lead from the center and inspire his country. If anything he is a polarizing force, more ego-driven than Nixon and just as unpredictable.

I hope I am wrong. Trump has many sound policies and has made some solid appointments to his team. Don’t believe everything you read from a hostile media. They could do a lot of good. Provided they are able to manage the elephant in the lifeboat — the destabilizing side of Trump’s nature.

Now that I have offended at least half of all US readers — slightly less than half if you listen to bleating about the majority vote — let me explain why politics and economics are so intertwined.

Apart from trade wars, which I will discuss at a later date, I see the main threat to the US economy as inflation.

Before I start, let me say that these dangers are not immediate and the present boom is likely to continue for the next 12 to 18 months. But they could quickly materialize, bringing the boom to a premature end, so it is best to keep a weather eye on them.

Inflation

Earlier this week I discussed why the inflation outlook is so important to stock market performance:

From Tim Wallace at The Sydney Morning Herald:

Nine years on from the start of the financial crisis, the US recovery may be overheating, Legal & General Investment Management economist James Carrick has warned.

He has predicted a series of interest rate hikes will tip the US into a 2018 recession.”Every recession in the US has been caused by a tightening of credit conditions,” he said, noting inflation is on the rise and the US Federal Reserve is discussing plans for higher interest rates.

Officials at the Fed have only raised interest rates cautiously, because inflation has not taken off, so they do not believe the Fed needs to take the heat out of the economy.

But economists fear the strong dollar and low global commodity prices have restricted inflation and disguised domestic price rises. Underneath this, they fear the economy is already overheating.

As a result, they expect inflation to pick up sharply this year, forcing more rapid interest rate hikes.

That could cause a recession next year, they say. In their models, the signals are that this could take place in mid-2018.

Harvard scholar Paul Schmelzing points out that inflation is starting to rear its head in both China and Germany, with producer prices rising. This may in part be a result of the falling value of the Yuan and Euro against the Dollar, resulting in higher domestic commodity prices.

The opposite, however, is true for the US, with a rising Dollar lowering import prices and acting as a headwind against inflation.

The consumer price index (CPI) is rising because of higher crude oil prices but core CPI (excluding food & energy) has remained fairly constant, around the 2.0 percent target, over the last five years.

Core CPI and CPI

So why the concern?

Well the Fed is more concerned about underlying inflation, best reflected by hourly wage rates, than the headline CPI figure.

A sharp rise in hourly earnings rates would force the Fed to respond with tighter monetary policy to take the heat out of the economy.

The chart below shows how the Fed slams on the brakes whenever average hourly earning rates grow above 3.0 percent. Each surge in hourly earnings is matched by a dip in the currency growth rate as the Fed tightens the supply of money to slow the economy and reduce inflationary pressure. And tighter monetary normally leads to recession.

Hourly Earnings Growth compared to Currency in Circulation

Two anomalies on the above chart warrant explanation. First, is the sharp upward spike in currency growth in 1999/2000 when the Fed reacted to the LTCM crisis with monetary stimulus despite high inflationary pressures. Second, is the sharp dip in 2010 when the Fed took its foot off the gas pedal too soon after the financial crisis of 2008/2009, mistaking it for a regular recession.

Hourly earnings growth is currently at 2.5 percent, so the Fed has some wiggle room and is only likely to react with tighter monetary policy when the figure reaches 3.0 percent.

Recent rate rises are more about normalizing interest rates — not taming inflation — and are not cause for alarm.

But Paul Schmelzing warns that the combination of a tight labor market and fiscal stimulus could fuel inflation and lead to a bear market in bonds similar to the 1960s.

That is exactly where Donald Trump is headed with a major infrastructure program likely to hit the ground next year. In a tightening labor market, the Fed would be forced to tighten monetary policy, slowing the economy and leading to another bear market in stocks as well as bonds.

Politics is tricky; it cuts both ways. Every time you make a choice, it has unintended consequences.

~ Stone Gossard

China’s Day of Reckoning | The Market Oracle

From Michael Pento:

Therein lies China’s dilemma: Allow the yuan to intractably fall, which will increase capital flight and destroy its asset-bubble economy. Or, raise interest rates to stabilize the currency and risk collapsing asset bubbles that will crumble under the weight of rising debt carrying costs.

China embodies a Keynesian dystopia that results from central planning gone mad. It’s mirage of prosperity should soon be coming to an unpleasant end. The misguided belief any government can print unlimited amounts of money and issue a massive amount of new credit; while providing the conditions that are the antitheses necessary for viable growth, has one significant Achilles heel: eventually, it will destroy your currency. Currency is always the pressure valve that explodes in an economy that has reached the apogee of dysfunction. The Red nation isn’t the only offender on this front, but is certainly one of the worst. Therefore, China and the yuan may have finally run out of time.

Source: Chinese Yuan’s Day of Reckoning :: The Market Oracle ::