East to West: Trade tariffs spark rally

Commodities rallied and Asian stocks found support after a three-month sell-off.

DJ-UBS Commodity Index

From Reuters (September 19):

Copper jumped to its highest in three weeks on Wednesday, boosted by a weaker dollar after a new round of U.S.-China trade tariffs were not as high as previously expected.

China will levy tariffs on about $60 billion worth of U.S. goods in retaliation for U.S. tariffs on $200 billion worth of Chinese goods. Washington’s new duties, however, were set at 10 percent for now, rising to 25 percent by the end of the year, rather than starting immediately at 25 percent…….

“In some ways the bad news had been priced into the markets and, if anything, the news on trade had been slightly less severe than we had thought it would be,” said Capital Economic analyst Caroline Bain.

“It’s still too early to talk about this as sustainable … it just seems to be a bit of a relief rally after all of the bad news.”

The Shanghai Composite Index rallied off primary support at 2650, a slight bullish divergence on the Trend Index signaling short-term buying pressure. Penetration of the descending trendline would suggest that a bottom is forming.

Shanghai Composite Index

Japan’s Nikkei 225 is testing its January high at 24,000.

Nikkei 225 Index

India’s Nifty is testing support at 11,000. Long tails indicate buying pressure. Respect of support would signal another advance.

Nifty Index

Europe

Dow Jones Euro Stoxx 50 rallied off primary support at 3300 but is yet to break the down-trend.

DJ Euro Stoxx 600 Index

The Footsie also rallied, finding support at 7250, but a declining Trend Index warns of continued selling pressure.

FTSE 100 Index

North America

The S&P 500 rallied off the new support level at 2875 and is likely to test its long-term target of 3000.

S&P 500

The Nasdaq 100, however, continues to test support at 7700. Breach would warn of a correction to test 7000.

Nasdaq 100

Canada’s TSX 60 found support at 950 but declining peaks on the Trend Index continue to warn of selling pressure.

TSX 60 Index

Markets are dominated by one concern, a US-China trade war, and volatility is likely to remain high until a resolution is found.

Bears in the East, Bulls in the West

Market fears of a trade war appear to be easing but investors in China and South Korea remain cautious.

The Shanghai Composite Index is retracing to test resistance at the former primary support level at 3000.

Shanghai Composite Index

Dow Jones – UBS Commodity Index shows a similar retracement in commodity prices.

DJ-UBS Commodity Index

While crude oil prices have found support at the LT rising trendline.

Nymex Light Crude

South Korea’s Seoul Composite Index is in a primary down-trend but retracement to test the former primary support level at 2350 is likely.

Seoul Composite Index

Japan is more isolated and the Nikkei 225 is testing resistance at 23,000. A rising Trend Index suggests that breakout is likely, which would test the January high at 24,000.

Nikkei 225 Index

India is stronger, with the Nifty breaking resistance at its January high of 11,100 to signal a primary advance with a target of 12,000. But first, expect retracement to test the new support level.

Nifty Index

Europe

Dow Jones Euro Stoxx 600 was boosted by news that the EU-US trade dispute is settled. A Trend Index trough above zero signals strong buying pressure. and another test of 400 is likely.

DJ Euro Stoxx 600 Index

A bullish saucer pattern on the Footsie suggest further gains. The Trend Index trough above zero indicates buying pressure. Breakout of the index above 7800 would signal another advance, with a target of 8200.

FTSE 100 Index

North America

The Nasdaq 100 retreated when Facebook (FB) and Twitter (TWTR) reported disappointing growth for the quarter. Bearish divergence on the Trend Index warns of selling pressure but this appears secondary and support at 7000 is likely to hold. Respect would confirm another advance.

Nasdaq 100

Friday’s retreat is also evident on the S&P 500 daily chart. Expect retracement to test new support at 2800. A strong GDP result should strengthen support.

S&P 500

Canada’s TSX 60 retraced to test the new support level at 970. Respect would signal a test of 1000 but breach is as likely, testing support at 940.

TSX 60 Index

TSX60 meets resistance

Canada’s TSX 60 found resistance at 820. Reversal below 800 warns of a correction but short retracement would be a bullish sign. And breakout above 820 would signal another advance. Rising 13-week Twiggs Momentum suggests a primary up-trend.

TSX 60 Index

No fireworks yet

The S&P 500 is testing resistance at the previous high of 2130. Down-turn on 21-day Twiggs Money Flow warns of short-term selling pressure; a fall below zero would indicate strong resistance. Reversal below 2050 is unlikely, but would indicate another test of primary support at 1870.

S&P 500 Index

* Target calculation: 2000 + ( 2000 – 1870 ) = 2130

A declining CBOE Volatility Index (VIX) indicates market risk is easing.

S&P 500 VIX

NYSE short sales remain subdued.

NYSE Short Sales

Nasdaq 100 broke resistance at 4700 and is approaching its previous (March 2000) high of 4816. 13-Week Twiggs Money Flow is rising steeply but expect resistance at 4800. Breakout would be a positive sign for the large cap S&P 500 and Dow Industrial indices.

Nasdaq 100

Canada’s TSX 60 is far more hesitant, testing stubborn resistance at 825. Breakout would signal a fresh advance, but follow-through below 800 would be bearish and failure of 775 would warn of another decline. Recovery of 13-week Twiggs Momentum above -5% would offer some hope, but the index remains tentative.

TSX 60 Index

* Target calculation: 775 – ( 825 – 775 ) = 725

Europe

Germany’s DAX is consolidating below resistance at 11000; a bullish sign. Recovery of 13-week Twiggs Money Flow above zero indicates medium-term buying pressure. Breakout above 11000 and the descending trendline would suggest another test of the previous high at 12400.

DAX

The Footsie is similarly testing resistance at 6500. Breakout would suggest another test of the previous high at 7100. 13-Week Twiggs Money Flow troughs above zero indicate long-term buying pressure. Reversal below 6250 is unlikely, but would warn of another test of primary support at 6000.

FTSE 100

Asia

The Shanghai Composite Index is testing resistance at 3500. Rising 13-week Twiggs Money Flow indicates buying pressure. Breakout would signal an advance to 4000, but I remain wary because of government intervention.

Dow Jones Shanghai Index

Japan’s Nikkei 225 is testing resistance at 19000. Breakout would signal another test of 21000. Respect is less likely, but reversal below 18500 would warn of another test of primary support at 17000.

Nikkei 225 Index

* Target calculation: 19000 + ( 19000 – 17000 ) = 21000

India’s Sensex is testing the former primary support level at 26500 after encountering resistance at 27500. Rising 13-week Twiggs Money Flow troughs above zero indicate long-term buying pressure. Respect of 26500 is likely and would indicate continuation of the rally (to 28500). Failure of support would warn of a primary decline.

SENSEX

* Target calculation: 25000 – ( 27500 – 25000 ) = 22500

Australia

The ASX 200 is testing medium-term support at 5150. Reversal of 21-day Twiggs Money Flow below zero indicates medium-term selling pressure. Breach of 5150 is likely and would warn of another test of primary support at 5000. Recovery above 5400 is unlikely at this stage, but would suggest an advance to 6000.

ASX 200

* Target calculation: 5000 – ( 5400 – 5000 ) = 4600


More….

Gold tremors

Arthur C Clarke, satellites and democracy | On Line Opinion

Marc Faber: Don’t believe China’s growth figures

US: Robust underlying GDP growth trend

Iron ore price crashes through $50 | MINING.com

Iron ore headed for the smelter

Do the BRICS still matter?

Cilla Black : You’re My World (1964)

Best Halloween costume ever

We aren’t born with the ability to make good decisions; we learn it.

~ Ray Dalio, Bridgewater Associates

Iron ore headed for the smelter

Bloomberg News quotes Zhu Jimin, deputy head of the China Iron & Steel Association, representing major steel producers, at their quarterly briefing on Wednesday:

“Production cuts are slower than the contraction in demand, therefore oversupply is worsening.”

“China’s steel demand evaporated at unprecedented speed as the nation’s economic growth slowed,” Zhu said. “As demand quickly contracted, steel mills are lowering prices in competition to get contracts.”

Little wonder that bulk commodity prices are falling sharply.

RBA: Bulk Commodity Prices

Australian producers have been ramping up production to compensate for lower prices.

RBA: Bulk Commodity Exports

But with further production due to come on line, the market looks ready for a meltdown. This from David Llewellyn-Smith at Macrobusiness:

Yes, China is still shutting in supply and is on track for 270 million tonnes this year but it’s not going to drop enough in the future (at the very best down to 200mt) as Roy Hill, Sino, Anglo, Vale and India (and possibly Tonkolili as well) continue the great ramp up, adding another 200mt plus in the next two years even as Chinese steel production keeps falling at 2-3% per year, taking 40mt per annum out of demand….. the total seaborne iron ore market is about to peak and then shrink….

The ASX 300 Metals & Mining Index is testing its 2008 low. Breach appears likely and would offer a target of 1700*.

ASX 300 Metals & Mining Index

* Target calculation: 2200 – ( 2700 – 2200 ) = 1700

North America

The S&P 500 respected support at 2050 and is headed for a test of the previous high at 2130 on the back of strong earnings performance. Rising 21-day Twiggs Money Flow indicates medium-term buying pressure but expect strong resistance at 2130. Reversal below 2050 is unlikely, but would warn of another test of primary support at 1870.

S&P 500 Index

* Target calculation: 2000 + ( 2000 – 1870 ) = 2130

A declining CBOE Volatility Index (VIX) indicates market risk is easing.

S&P 500 VIX

NYSE short sales remain subdued.

NYSE Short Sales

Dow Jones Industrial Average is similarly headed for a test of 18300, with 13-week Twiggs Money Flow rising steeply.

Dow Jones Industrial Average

Canada’s TSX 60 continues to test stubborn resistance at 825. Weak 13-week Twiggs Momentum, below zero, indicates the market remains bearish. Breakout would signal an advance to 900, but reversal below the former primary support level at 800 is as likely and would warn of another decline.

TSX 60 Index

* Target calculation: 775 – ( 825 – 775 ) = 725

Europe

Germany’s DAX is testing resistance at 11000. Recovery of 13-week Twiggs Money Flow above zero indicates medium-term buying pressure. Breakout above the descending trendline would suggest another test of the previous high at 12400. Expect stubborn resistance, however, and reversal below 10000 would warn of another decline.

DAX

The Footsie is similarly testing resistance at 6500. Breakout above the descending trendline would suggest another test of the previous high at 7100. 13-Week Twiggs Money Flow troughs above zero indicate long-term buying pressure. Reversal below 6250 is unlikely, but would warn of another test of primary support at 6000.

FTSE 100

Asia

The Shanghai Composite Index continues to test resistance at 3500. Respect is likely and would indicate a re-test of government-backed support at 3000.

Dow Jones Shanghai Index

Hong Kong’s Hang Seng Index is retracing to test support at 22500. Respect would indicate a rally to 24000, but failure remains as likely and would test primary support at 21000. A 13-week Twiggs Money Flow trough above zero would indicate (long-term) buying pressure.

Hang Seng Index

Japan’s Nikkei 225 is testing resistance at 19000. Breakout would signal another test of 21000. Respect is less likely, but would warn of another test of primary support at 17000.

Nikkei 225 Index

* Target calculation: 19000 + ( 19000 – 17000 ) = 21000

India’s Sensex encountered resistance at 27500. Rising 13-week Twiggs Money Flow troughs above zero indicate long-term buyiong pressure. Expect another test of 26500 but respect is likely and would indicate continuation of the rally. Reversal below 26500 would warn of another (primary) decline.

SENSEX

* Target calculation: 25000 – ( 27500 – 25000 ) = 22500

Australia

The ASX 200 is retracing to test medium-term support between 5200 and 5300. Reversal of 21-day Twiggs Money Flow below its rising trendline indicates (medium-term) selling pressure; decline below zero would strengthen the signal. Breach of 5200 would warn of another test of primary support at 5000. Recovery above the descending trendline is unlikely at this stage, but would suggest another test of 6000.

ASX 200

* Target calculation: 5000 – ( 5400 – 5000 ) = 4600


More….

Do the BRICS still matter?

Zero deposit loans for Chinese investors in Australian property market | afr.com

China invades India (1962): JFK’s finest hour

Low inflation and a stronger dollar indicate weak gold

S&P 500 reporting in full swing

Crude testing support

Oil market showdown: Can Russia outlast the Saudis?

Putin’s Crimean gamble: Russia, Ukraine, and the new Cold War [podcast]

Containment 2.0 [podcast]

Jack Johnson: No Other Way

Failure is by and large due to not accepting and successfully dealing with the realities of life…. Achieving success is simply a matter of accepting and successfully dealing with all my realities.

~ Ray Dalio, Bridgewater Associates

Iron ore headed for the smelter

Bloomberg News quotes Zhu Jimin, deputy head of the China Iron & Steel Association, representing major steel producers, at their quarterly briefing on Wednesday:

“Production cuts are slower than the contraction in demand, therefore oversupply is worsening.”

“China’s steel demand evaporated at unprecedented speed as the nation’s economic growth slowed,” Zhu said. “As demand quickly contracted, steel mills are lowering prices in competition to get contracts.”

Little wonder that bulk commodity prices are falling sharply.

RBA: Bulk Commodity Prices

Australian producers have been ramping up production to compensate for lower prices.

RBA: Bulk Commodity Exports

But with further production due to come on line, the market looks ready for a meltdown. This from David Llewellyn-Smith at Macrobusiness:

Yes, China is still shutting in supply and is on track for 270 million tonnes this year but it’s not going to drop enough in the future (at the very best down to 200mt) as Roy Hill, Sino, Anglo, Vale and India (and possibly Tonkolili as well) continue the great ramp up, adding another 200mt plus in the next two years even as Chinese steel production keeps falling at 2-3% per year, taking 40mt per annum out of demand….. the total seaborne iron ore market is about to peak and then shrink….

The ASX 300 Metals & Mining Index is testing its 2008 low. Breach appears likely and would offer a target of 1700*.

ASX 300 Metals & Mining Index

* Target calculation: 2200 – ( 2700 – 2200 ) = 1700

North America

The S&P 500 respected support at 2050 and is headed for a test of the previous high at 2130 on the back of strong earnings performance. Rising 21-day Twiggs Money Flow indicates medium-term buying pressure but expect strong resistance at 2130. Reversal below 2050 is unlikely, but would warn of another test of primary support at 1870.

S&P 500 Index

* Target calculation: 2000 + ( 2000 – 1870 ) = 2130

A declining CBOE Volatility Index (VIX) indicates market risk is easing.

S&P 500 VIX

NYSE short sales remain subdued.

NYSE Short Sales

Dow Jones Industrial Average is similarly headed for a test of 18300, with 13-week Twiggs Money Flow rising steeply.

Dow Jones Industrial Average

Canada’s TSX 60 continues to test stubborn resistance at 825. Weak 13-week Twiggs Momentum, below zero, indicates the market remains bearish. Breakout would signal an advance to 900, but reversal below the former primary support level at 800 is as likely and would warn of another decline.

TSX 60 Index

* Target calculation: 775 – ( 825 – 775 ) = 725

Europe

Germany’s DAX is testing resistance at 11000. Recovery of 13-week Twiggs Money Flow above zero indicates medium-term buying pressure. Breakout above the descending trendline would suggest another test of the previous high at 12400. Expect stubborn resistance, however, and reversal below 10000 would warn of another decline.

DAX

The Footsie is similarly testing resistance at 6500. Breakout above the descending trendline would suggest another test of the previous high at 7100. 13-Week Twiggs Money Flow troughs above zero indicate long-term buying pressure. Reversal below 6250 is unlikely, but would warn of another test of primary support at 6000.

FTSE 100

Asia

The Shanghai Composite Index continues to test resistance at 3500. Respect is likely and would indicate a re-test of government-backed support at 3000.

Dow Jones Shanghai Index

Hong Kong’s Hang Seng Index is retracing to test support at 22500. Respect would indicate a rally to 24000, but failure remains as likely and would test primary support at 21000. A 13-week Twiggs Money Flow trough above zero would indicate (long-term) buying pressure.

Hang Seng Index

Japan’s Nikkei 225 is testing resistance at 19000. Breakout would signal another test of 21000. Respect is less likely, but would warn of another test of primary support at 17000.

Nikkei 225 Index

* Target calculation: 19000 + ( 19000 – 17000 ) = 21000

India’s Sensex encountered resistance at 27500. Rising 13-week Twiggs Money Flow troughs above zero indicate long-term buyiong pressure. Expect another test of 26500 but respect is likely and would indicate continuation of the rally. Reversal below 26500 would warn of another (primary) decline.

SENSEX

* Target calculation: 25000 – ( 27500 – 25000 ) = 22500

Australia

The ASX 200 is retracing to test medium-term support between 5200 and 5300. Reversal of 21-day Twiggs Money Flow below its rising trendline indicates (medium-term) selling pressure; decline below zero would strengthen the signal. Breach of 5200 would warn of another test of primary support at 5000. Recovery above the descending trendline is unlikely at this stage, but would suggest another test of 6000.

ASX 200

* Target calculation: 5000 – ( 5400 – 5000 ) = 4600

Bear market – brief respite

North America

The S&P 500 is retracing to test short-term support at 2000. Failure would warn of another test of support at 1870, while respect would indicate continuation of the bear rally to test resistance at the high of 2130. Bullish divergence on 21-day Twiggs Money Flow indicates (medium-term) buying pressure. The market remains bearish, however, having broken primary support at 2000, and respect of 2130 would warn of another test of support at 1870.

S&P 500 Index

* Target calculation: 2000 + ( 2000 – 1870 ) = 2130

The CBOE Volatility Index (VIX) below 20 indicates market risk is easing. We need to remain vigilant for the next few weeks. At least until we see a peak below 20.

S&P 500 VIX

NYSE short sales remain subdued.

NYSE Short Sales

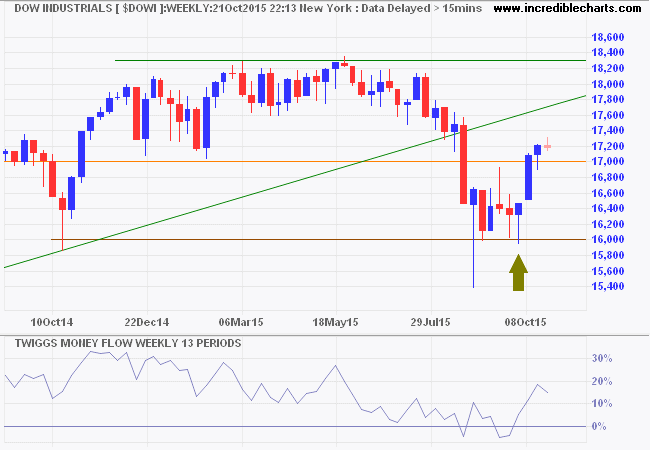
Dow Jones Industrial Average similarly retraced to test support at 17000 on the weekly chart. 13-Week Twiggs Money Flow holding above zero indicates buying pressure. Respect of support would again indicate a rally to test the previous high (18300), failure would warn of another test of primary support at 16000.

Dow Jones Industrial Average

Canada’s TSX 60 respected resistance at 825. Reversal below 800 would warn of another decline; breach of 775 would confirm. Weak 13-week Twiggs Momentum, below zero, signals the market is still bearish.

TSX 60 Index

* Target calculation: 775 – ( 825 – 775 ) = 725

Europe

Germany’s DAX remains weak, with the index retracing to test support at 10000 and 13-week Twiggs Money Flow below zero. Reversal below 10000 is likely and would warn of another decline; follow-through below 9500 would confirm. Recovery above 10500 is unlikely but would indicate continuation of the bear rally.

DAX

The Footsie is more resilient, with 13-week Twiggs Money Flow holding above zero. The index respected resistance at 6500 and is retracing to test short-term support at 6250. Respect is more likely and would suggest another test of 6500. Reversal below 6000 is unlikely, but would confirm the primary down-trend.

FTSE 100

Asia

The Shanghai Composite Index rallied off government-enforced support at 3000. But the rally is likely to be short-lived and recovery above 3500 unlikely.

Dow Jones Shanghai Index

Hong Kong’s Hang Seng Index is retracing to test support at 22500 after a similar bear rally. Respect of 22500 would indicate another test of 24000, but breach of support is more likely and would warn of another test of primary support at 21000.

Hang Seng Index

Japan’s Nikkei 225 encountered resistance at 18500. Gradual decline on 13-week Twiggs Money Flow suggests a secondary correction, with long-term buying pressure continuing. Recovery above 19000 would indicate another test of 21000.

Nikkei 225 Index

* Target calculation: 19000 + ( 19000 – 17000 ) = 21000

India’s Sensex is retracing to test support at 26500. The 13-week Twiggs Money Flow trough above zero, however, indicates strong buying pressure and respect of support at 26500 would indicate continuation of the rally. Reversal below 26000 is unlikely, but would confirm a primary down-trend.

SENSEX

Australia

The ASX 200 retreated from resistance at 5250/5300. Rising 13-week Twiggs Money Flow, however, indicates medium-term buying pressure. A higher trough above 5000 would strengthen the signal. Breakout above 5300 would signal continuation of the bear rally to test the descending trendline. The bear market continues despite recent support and breach of 5000 would confirm a primary down-trend.

ASX 200

* Target calculation: 5000 – ( 5400 – 5000 ) = 4600


Being powerful is like being a lady. If you have to tell people you are, you aren’t.

~ Margaret Thatcher

Bear Rally

North America

Construction activity continues to advance. The graph below shows Total US Construction Spending adjusted for inflation (Core CPI). Spending is substantially below the 2004 to 2007 property bubble but equates to the earlier Dotcom era. The steep rise suggests that rate increases will be necessary to prevent another bubble.

US Construction Spending adjusted by Core CPI

The S&P 500 is testing resistance at 2000. Bullish divergence on 21-day Twiggs Money Flow indicates (medium-term) buying pressure. Recovery above 2000 would signal a relieving rally, with a target (from the double-bottom pattern) of 2130*. The market remains bearish and respect of 2130 would warn of another test of primary support at 1870.

S&P 500 Index

* Target calculation: 2000 + ( 2000 – 1870 ) = 2130

The CBOE Volatility Index (VIX) below 20 indicates market risk is easing. We need to remain vigilant for the next few weeks as VIX can be prone to false breaks.

S&P 500 VIX

NYSE short sales are subdued.

Dow Jones Industrial Average is similarly testing resistance at 17000 on the weekly chart. Breakout would offer a similar target of 18300. Recovery of 13-week Twiggs Money Flow above zero indicates buying pressure. Reversal below 16000 is unlikely, but would confirm a primary down-trend.

Dow Jones Industrial Average

Canada’s TSX 60 recovered above the former primary support level at 800. Follow-through above 820 would signal a relieving rally. Weak 13-week Twiggs Momentum, below zero, warns the market is still bearish.

TSX 60 Index

* Target calculation: 820 + ( 820 – 750 ) = 890

Europe

Germany’s DAX remains weak, with 13-week Twiggs Money Flow below zero. Recovery above 10500 would indicate a bear rally. Only follow-through above 11000 would signal that the down-trend is over.

DAX

The Footsie proved more resilient, respecting support at 6000 with 13-week Twiggs Money Flow holding above zero. Breakout above 6300 indicates a relieving rally, while follow-through above the descending trendline would suggest that the correction is over. Reversal below 6000 is unlikely, but would confirm the primary down-trend.

FTSE 100

Asia

The Shanghai Composite Index continues to test government-enforced support at 3000. Recovery above 3500 is most unlikely.

Dow Jones Shanghai Index

Hong Kong’s Hang Seng Index rallied to test resistance at 22500, while 13-week Twiggs Money Flow recovered above zero. Follow-through above 22500 would indicate another test of 24000. But this remains a bear market and reversal below 22500 would warn of another decline.

Hang Seng Index

Japan’s Nikkei 225 respected primary support at 17000. Gradual decline on 13-week Twiggs Money Flow suggests a secondary correction. Recovery above 19000 would indicate another test of 21000.

Nikkei 225 Index

* Target calculation: 19000 + ( 19000 – 17000 ) = 21000

India’s Sensex followed through above resistance at 26500, indicating a bear rally. Strong buying pressure, signaled by a 13-week Twiggs Money Flow trough above zero, suggests a reversal. Breakout above 28500 would confirm. Reversal below 25000 is unlikely, but would confirm a primary down-trend.

SENSEX

Australia

A monthly chart of the ASX 200 shows the significance of the 5000 support level.

ASX 200 monthly

Rising 21-Day Twiggs Money Flow on the daily chart indicates medium-term buying pressure. Breakout above 5300 would offer a target of 5700. But expect stiff resistance between 5200 and 5300 — already flagged by a tall shadow on today’s candlestick. Breach of 5000 is unlikely at present, but would confirm a primary down-trend.

ASX 200

* Target calculation: 5000 – ( 5400 – 5000 ) = 4600


More….

Crude: Another bear rally

Gold down-trend continues

Sen. John McCain on Russia’s airstrikes in Syria

Paddleboarding with whales

Deleveragings go on for about 15 years. The process of raising debt relative to incomes goes on for 30 or 40 years, typically. There’s a last big surge, which we had in the two years from 2005 to 2007 and from 1927 to 1929, and in Japan from 1988 to 1990, when the pace becomes manic. That’s the classic bubble. And then it takes about 15 years to adjust.

~ Ray Dalio, Bridgewater Associates

Bears out in force

Bears continue to dominate equity markets. Patches of support are visible across North America, Europe and Asia but this is likely to be a secondary rally rather than a trend change.

The Russian bear is also playing up. This time in Syria. Senator John McCain sums up the escalating crisis in the Middle East in this 15-minute video.

North America

The S&P 500 respected support between 1870 and 1900, rallying toward another test of resistance at 2000. The 21-day Twiggs Money Flow peak just above zero continues to indicate (medium-term) selling pressure. Recovery above 2000 is unlikely, but would signal a relieving rally. Breach of support at 1870 would confirm the primary down-trend.

S&P 500 Index

* Target calculation: 1900 – ( 2000 – 1900 ) = 1800

The CBOE Volatility Index (VIX) holding above 20 indicates elevated market risk.

S&P 500 VIX

NYSE short sales remain subdued.

Dow Jones Industrial Average is testing support at 16000. Long tails on the last two weekly candles and recovery of 13-week Twiggs Money Flow above zero indicate strong support. Breach of 16000 would confirm a primary down-trend but we are likely to see a (secondary) bear rally beforehand.

Dow Jones Industrial Average

Bellwether transport stock Fedex continues to warn of a contraction in economic activity.

Fedex

And retail sales growth remains subdued.

Retail Sales and Core CPI

A long tail on Canada’s TSX 60 indicates continued support despite the breach of 790. Declining 13-week Twiggs Momentum below zero indicates a primary down-trend. Recovery above 820 is unlikely, but would suggest a bear trap.

TSX 60 Index

* Target calculation: 800 – ( 900 – 800 ) = 700

Europe

Germany’s DAX signals a primary down-trend, but appears to have found secondary support at 9500. Recovery of 13-week Twiggs Money Flow above zero would suggest a bear rally.

DAX

The Footsie found strong support at 6000, with long tails and 13-week Twiggs Money Flow recovering above zero. Penetration of the descending trendline is unlikely but would warn of a bear trap. Breach of support at 6000 is more likely and would confirm the primary down-trend.

FTSE 100

Asia

The Shanghai Composite Index continues to test government-enforced support at 3000. Recovery above 3500 is most unlikely. Breach of 3000 would warn of another sharp sell-off.

Dow Jones Shanghai Index

Hong Kong’s Hang Seng Index broke support at 21000, confirming the primary down-trend — signaled earlier by 13-week Twiggs Money Flow.

Hang Seng Index

Japan’s Nikkei 225 is testing primary support between 16500 and 17000. Gradual decline on 13-week Twiggs Money Flow suggests a secondary correction, but reversal of 13-week Momentum below zero warns of a primary down-trend. Breach of 16500 would confirm.

Nikkei 225 Index

* Target calculation: 17500 – ( 19000 – 17500 ) = 16000

India’s Sensex found support at 25000 before testing resistance at 26500. 13-Week Twiggs Money Flow trough above zero indicates strong buying pressure. Recovery above 26500 would warn of a bear trap. Reversal below 25000 is less likely, but would confirm the primary down-trend.

SENSEX

* Target calculation: 25000 – ( 26500 – 25000 ) = 23500

Australia

The ASX 200 also shows solid support at 5000, with rising 21-Day Twiggs Money Flow indicating medium-term buying pressure. Recovery above 5200 would indicate a bear rally. Breach of 5000 remains likely, however, and would confirm the primary down-trend.

ASX 200

* Target calculation: 5000 – ( 5400 – 5000 ) = 4600


More….

Gold and Treasury yields decline as inflation weakens

Sen. John McCain on Russia’s airstrikes in Syria

Japan abandons Fed-style inflation targeting and targets GDP growth instead

Deflation supercycle is over as world runs out of workers | Telegraph

Australia: Latest SMSF statistics | FINSIA

I think anybody who is a great investor, a good investor, a successful investor has to be a person who can be both aggressive and defensive….. have enough fear to have the caution. But you can’t let the fear control you.

~ Ray Dalio, Bridgewater Associates