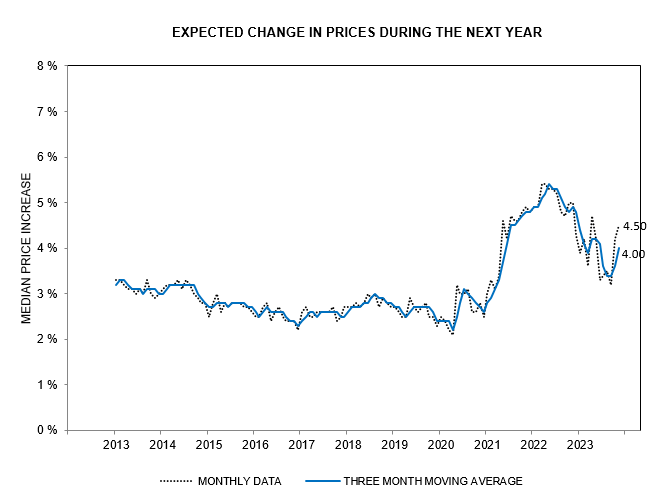
S&P 500: Stocks lift but jobs and profits a red flag

The S&P 500 has advanced steadily since breaking resistance at 3000.

S&P 500

Lifted by Fed liquidity injections in the repo market.

S&P 500 and Fed Assets

Optimism over improved global trade has spread, with the DJ Euro Stoxx 600 breaking resistance at 400.

DJ Euro Stoxx 600

South Korea’s KOSPI completed a double-bottom reversal to signal an up-trend.

KOSPI

And India’s Nifty Index broke resistance at 12,000.

Nifty

Commodity prices remain low but rising Trend Index troughs on the DJ-UBS Commodity Index suggest that a bottom is forming.

DJ-UBS Commodity Index

Crude spiked up with rising US-Iran tensions but is expected to re-test support at 50 as supply threats fade.

Nymex Light Crude

Fedex recovered above primary support at 150, but the outlook for economic activity remains bearish.

Fedex

Falling US wages growth warns of slowing job creation.

Average Hourly Wages

Declining employment growth highlights similar weakness.

Employment Growth

Initial jobless claims, while not alarming, are now starting to rise.

Initial Claims

Growth in weekly hours worked has slowed, with real GDP expected to follow.

Real GDP and Weekly Hours Worked

While GDP growth is slowing, corporate profits (before tax) are also declining as a percentage of GDP.

Corporate profits Before Tax/GDP

Market Capitalization of equities has spiked to a ratio of 20 times Corporate Profits (before tax), an extreme only previously seen in the Dotcom bubble.

Market Cap/Corporate Profits before Tax

The market can remain irrational for longer than you or I can stay solvent, but this is a clear warning to investors to stay on the defensive.

We maintain our view that stocks are over-valued and will remain under-weight equities (over-weight cash) until normal earnings multiples are restored.

What is causing the current S&P 500 rise and how is it likely to end?

In November 2007, six months after the inverted yield curve (3M-10Y) recovered to a positive slope, bellwether transport stock Fedex broke primary support at 100 to warn of an economic slow-down.

Today, two months after rate cuts restored an inverted yield curve to positive, Fedex again broke primary support, this time at 150. Their CEO observed that the stock market might be booming but the “industrial economy does not reflect any growth at all.”

Fedex

Real GDP growth is slowing, with our latest estimate, based on weekly hours worked, projecting GDP growth of 1.5% for the calendar year.

Real GDP and Weekly Hours Worked

While real corporate profits are declining.

Corporate Profits Before Tax adjusted for Inflation

What is keeping stocks afloat?

First, a flood of new money from the Fed. They expanded their balance sheet by $375 billion since September 2019 and are expected to double that to $750 billion — bringing total Fed holdings to $4.5 trillion by mid-January — to head off an expected liquidity crisis in repo and FX swap markets. The red line below shows expansion of the Fed’s balance sheet, the blue is the S&P 500 index.

S&P 500 and Fed Assets

Second, ultra-low bond yields have starved investment markets of yield, boosting earnings multiples. P/E of historic earnings rose to 22.01 at the end of the September quarter and is projected to reach 22.82 in the December quarter (based on current S&P earnings estimates).

S&P 500 P/E (maximum of previous earnings)

That is significantly higher than the peak earnings multiples achieved before previous crashes — 18.86 of October 1929 and 18.69 in October 1987 — and is only surpassed by the massive spike of the Dotcom bubble.

How could this end?

First, if the Fed withdraws (or makes any move to withdraw) the $750 billion temporary liquidity injection, intended to tide financial markets over the calendar year-end, I expect that the market would crash within minutes. They are unlikely to be that stupid but we should recognize that the funding is permanent, not temporary.

Second, if bond yields rise, P/E multiples are likely to fall. 10-Year breakout above 2.0% would signal an extended rise in yields.

10-Year Treasury Yields

China has slowed its accumulation of US Dollar reserves, allowing the Yuan to strengthen against the Dollar (or at least weaken at a slower rate). Reduced Treasury purchases are causing yields to rise. The chart below shows in recent months how Treasury yields have tracked the Yuan/US Dollar (CNYUSD) exchange rate.

CNYUSD

Accumulation of USD foreign exchange reserves (by China) is likely to be a central tenet of US trade deal negotiations — as they were with Japan in the 1985 Plaza Accord. Expect upward pressure on Treasury yields as growth in Chinese holdings slows and possibly even declines.

Third, and most importantly, are actual earnings. With 98.6% of S&P 500 companies having reported, earnings for the September quarter are 6.5% below the same quarter last year. Poor Fedex results and low economic growth warn of further poor earnings ahead.

We maintain our view that stocks are over-priced and that investors need to exercise caution. We are over-weight cash and under-weight equities and will hold this position until normal P/E multiples are restored.

S&P 500 recovers but employment gains sluggish

Short retracement on the S&P 500 that respected support at 3000 strengthens the bull signal. Further gains are expected in the short- to medium-term.

S&P 500

Corporate profits before tax continue to decline after adjusting for inflation, exposing the vulnerability of high earnings multiples.

S&P 500

Hours worked (non-farm payroll x average weekly hours) for November also point to low annual GDP growth of around 1.5% after inflation.

Real GDP and Hours Worked

Employment growth for the 12 months to November came in at a similar 1.48%.

Employment Growth & Fed Funds Rate

Not enough to justify a P/E multiple of 23.25.

Average hourly earnings growth is increasing, especially for production & non-supervisory employees (3.65% for 12 months to November), but in the present environment the Fed seems unconcerned about inflationary pressures.

Average Hourly Earnings

Patience

Patience is required. We have had a weak S&P 500 retracement confirm the breakout but there is minimal up-turn in November employment indicators to support the bull signal. Market risk is elevated and investors should exercise caution.

“The world has a way of undermining complex plans. This is particularly true in fast moving environments. A fast moving environment can evolve more quickly than a complex plan can be adapted to it….”
~ Carl Von Clausewitz, Vom Kriege (On War) (1780-1831)

S&P 500: Betting on QE

The S&P 500 continued its cautious advance in a shortened week due to Thanksgiving. Expect retracement to test the new support level at 3000.

S&P 500

I believe that the latest surge has little do with an improved earnings outlook and is simply a straight bet that Fed balance sheet expansion (QE) will goose stock prices in the short- to medium-term. The chart below highlights the timing of the increase in Fed assets and its effect on the S&P 500 index.

S&P 500 and Fed Total Assets

There is plenty of research on the web pointing to a strong correlation between QE and equity prices. Here are two of the better ones:

Economic Activity

If we look at fundamentals, many of them are headed in the opposite direction.

Bellwether transport stock Fedex (FDX) is testing primary support at 150. Breach would warn of a slow-down in economic activity.

Fedex

Monthly container traffic at the Port of Los Angeles shows a marked year-on-year fall in imports and, to a lesser extent, exports.

Port of Los Angeles: Container Imports & Exports

Rather than boosting local manufacturers, industrial production is falling.

Industrial Production

Production of durable consumer goods is falling even faster, though the October figure may be distorted by the GM strike.

Industrial Production: Durable Consumer Goods

What is clear is that slowing growth in the global economy is unlikely to reverse any time soon.

Market Cap v. Corporate Profits

Yet market capitalization for non-financial stocks is at a precarious 24.7 times profits before tax, second only to the Dotcom bubble. The surge since 2010 coincides with Fed injection of a net $2.0 trillion into financial markets ($4.5T – $2.5T in excess reserves).

Nonfinancial corporations: Market Capitalisation/Profits before tax

The problem, as the Fed unwind showed, is that once central banks embark on this path, it is difficult for them to stop. The Bank of Japan started in the late 1980s — and is still at it.

Bank of Japan: Total Assets

Margin Debt

This chart from Advisor Perspectives compares the S&P 500 to margin debt. The decline since late 2018 appears ominous but November margin debt levels may reflect an up-turn. We will have to keep a weather eye on this.

FINRA Margin Debt & S&P 500 Index

Patience

Patience is required. First, wait for S&P 500 retracement to confirm the breakout. Second, look for an up-turn in November economic indicators, especially employment, to support the bull signal. Failure of economic indicators to confirm the breakout will flag that market risk is elevated and investors should exercise caution.

“If the mind is to emerge unscathed from this relentless struggle with the unforeseen, two qualities are indispensable: first, an intellect that, even in the darkest hour, retains some glimmerings of the inner light which leads to truth; and second, the courage to follow this faint light wherever it may lead.”
~ Carl Von Clausewitz, Vom Kriege (On War) (1780-1831)

S&P 500: A cautious advance

A monthly chart shows the S&P 500 cautiously advancing after breaking resistance at 3000. Short candle bodies reflect hesitancy but Trend Index troughs above zero remain bullish.

S&P 500

ETF flows reveal risk-averse investors, with outflows from US Equities in the last week and a relatively much larger outflow from Leveraged ETFs. Inflows are mainly into Fixed Income and Inverse.

ETF Flows

Year-to-date flows tell a similar story, with outflows from Equities and into Fixed Income. So where is the money flow into equities coming from?

Twitter: Buybacks

Meanwhile, the Fed has eased up on their balance sheet expansion now that the PBOC is back in the market. But broad money (MZM plus time deposits) continues to spike upwards, warning that the Fed is trying to head off a potential liquidity squeeze. They are not always successful. A similar spike occurred before the last two recessions.

Fed Assets and Broad Money Growth

The personal savings rate is climbing. Far from a positive sign, this warns that personal consumption, the largest contributor to GDP, is likely to fall.

Saving Rate

This is a dangerous market and we urge investors to be cautious.

“A hell of a mess in every direction” – Paul Volcker

The S&P 500 strengthened on Friday, closing at a new high of 3067. Volatility (21-day) crossed below 1%, signaling that risk is easing. Money Flow strengthened; a trough above zero suggests another advance. The medium-term target is 3250.

S&P 500

Dow Jones Industrial Average is weaker, with Money Flow having dipped below zero, but breakout above 27,400 would signal another advance. Target for the advance is 29,400.

DJ Industrial Average

“We’re in a hell of a mess in every direction,” is how Paul Volcker, the former Fed Chairman describes it.

Equities are making new highs, while the Fed cuts interest rates. Donald Trump is effectively dictating monetary policy. This could only end badly.

Unemployment and initial jobless claims are near record lows.

Unemployment and Jobless Claims

Inflationary pressures are moderate, with average wage rates growing between 3.0% and 3.5% (production and non-supervisory employees).

Average Wage Rates

GDP growth is slowing, however, and likely to fall further according to our advance indicator (estimated hours worked).

Real GDP and Estimated Hours Worked

Payroll growth is also slowing. While this has been explained as a result of record low unemployment (new employees may be hard to find) it is likely that rising uncertainty has played a big part.

Payroll Growth and Fed Funds Rate

The 3-month TMO of Non-Farm Payrolls kicked up to 0.58%, above the amber risk level of 0.5%.

Payroll Recession Warnings

With 73.5% of stocks having reported for Q3, the price-earnings ratio remains elevated. A reading above 20 warns that stocks are over-priced, especially because expected earnings growth is low.

P/E of Highest Earnings

If we project nominal GDP growth (including inflation) at 3.5% and buyback yields at 3.0% (Q2: 3.26%) that gives us anticipated growth of 6.5%. Add dividend yield of 2.0% (Q2: 1.96%) and we can expect stocks to yield a total return (dividends plus growth) of 8.5%.

Nominal GDP and Estimated Hours Worked * Average wage rate

But that assumes that current price-earnings multiples are maintained. Any downward revision, from earnings disappointments, would most likely result in a negative return.

If you thought the sell-off was over

Flush with new money, the S&P 500 broke resistance at 3030 this week to set a new high. Declining Money Flow,  however, warns of selling pressure. Expect retracement to test the new support level at 3000. Breach would signal another test of support at the recent lows of 2830 to 2860.

S&P 500

Selling pressure on blue chips is a lot stronger, with Money Flow on Dow Jones Industrial Average dipping below zero. Reversal below 26800 would warn of a correction.

DJ Industrial Average

The investment outlook remains Risk-Off, with last week’s ETF investment flows heavily weighted towards bonds.

ETF Flows W/E 25 October 2019

Year-to-date flows reflect a similar picture, with fixed income inflows outweighing the much larger equity ETF market.

ETF Flows YTD 25 October 2019

Supply & Demand

We normally gauge whether stocks are under- or over-priced by comparing earnings to market capitalization, whether in the form of P/E or Robert Shiller’s inflation-adjusted CAPE. But the Fed has shown that stock prices are really a function of supply and demand.

Investment demand skyrocketed in the last decade, with QE driving down bond yields and forcing a large flow of investment funds into equities, searching for yield. The chart below shows estimated market value of publicly-held equity of U.S. domestic (financial and non-financial) corporations and the market value of closely-held equity.

Stock Market Capitalization

Supply of equities in the same period experienced limited growth because of three related factors. First, GDP growth slowed (partly because of QE). Corporate profit growth then slowed as a result. That left management little option. With limited investment opportunities, they returned capital to investors by way of stock buybacks. That restricted the supply of new equities for investment while demand was soaring.

The result was an inevitable surge in prices relative to earnings.

The chart below compares market cap (above) to corporate profits before tax. I have circled 1987 for comparison.

Market Cap/Corporate Profits Before Tax

We remain cautious. Stocks are highly-priced compared to earnings.

Don’t fight the Fed

The Fed is again expanding its balance sheet in response to the recent interest rate spike in repo markets. The effect is the same as QE: the Fed is creating new money (reserve balances) and pumping this into financial markets.

Fed Assets and Excess Reserves on Deposit

Why is this happening?

The US government is issuing record amounts of new Treasuries to cover Donald Trump’s record deficit.

Fed Assets and Excess Reserves on Deposit

According to Luke Gromen: “US govt is on pace to issue $11.3T in USTs on a gross basis in F19.

Gregor Samsa at Macro-Monitor sums up the problem with the following diagram.

Macro Monitor - US Treasury Supply Demand Curves

If supply-demand curves do your head in, the above graph simply says that when you suppress interest rates, there will be a surplus of Treasuries. The yield is less attractive and demand from investors will fall.

Not only do we not have enough domestic buyers, foreign (Chinese?) purchases of US Treasuries are drying up. Primary dealers are required to take up the shortfall on any new issues. The recent price spike tells us they don’t want them.

10-Year Treasury Yields

So it’s all hands to the pump at the Fed. We are likely to see further balance sheet expansion in the months ahead, driving down Treasury yields and the Dollar.

And lifting equities.

The flush of new money is likely to suppress volatility.

S&P 500

And drive equities even further out along the risk curve. Breakout above 3025 would signal another advance.

S&P 500

We remain cautious. Stocks are highly-priced compared to earnings.

Corporate profits are falling in real terms.

Real Corporate Profits

And rising personal savings warn that consumption is likely to fall.

Personal Savings

It all depends on how much money the Fed will print.

Fed Assets and Broad Money

S&P 500 bearish as Fed forced to expand

Juliet Declercq at JDI Research maintains that the normal business cycle has been replaced by a liquidity cycle, where market conditions are dictated by the ebb and flow of money from central banks. Risk will remain elevated for as long as natural price discovery is suppressed and risk-reward decisions are made in an artificial environment controlled by central bankers.

The Fed is again expanding its balance sheet (commonly known as QE) in response to the recent interest rate spike in repo markets.

Fed Assets and Excess Reserves on Deposit

Jeff Snider from Alhambra Partners maintains that the Dollar shortage has been signaled for some time. First by an inverted yield curve in Eurodollar futures, well ahead of in US Treasuries. Then in March 2019, the effective Fed Funds Rate (EFFR) stepped above the interest rate paid by the Fed on excess reserves (deposited by commercial banks at the Fed). According to Jeff, this showed that primary dealers were willing to pay a premium for liquidity. The likely explanation is that they anticipated a severe contraction in inter-bank markets, similar to 2008.

Effective Fed Funds Rate - Interest on Excess Reserves

When the spread spiked upwards in late September, the Fed finally woke up and started pumping money into the system, expanding their balance sheet by over $200 billion in the past few weeks.

Fed balance sheet expansion is normally welcomed by financial markets but broad money (MZM plus time deposits) is surging. Far from a reassuring sign, a similar surge occurred ahead of the last two recessions.

Broad Money

Bearish divergence between the S&P 500 and Trend Index on the daily chart warns of secondary selling pressure. An engulfing candle closed below 3000, strengthening the bear signal. Expect a test of secondary support at 2840.

S&P 500

Volatility (21-day) remains elevated. Volatility spikes at close to, or above, 2% normally accompany market down-turns signaled by arrows on the index chart. Note how rising troughs precede most down-turns and culminate in a trough above 1%. We are not there yet but Volatility above 1% is an amber-level warning.

S&P 500 Volatility

CEO Confidence is falling and normally precedes a fall in the S&P 500 index. What is more concerning is that confidence is at the same lows (right-hand scale) seen in 2001 and 2009.

CEO Confidence

Exercise caution. Probability of a down-turn is high and we maintain a reduced 34% exposure to international equities.

S&P 500 and Europe: New deal or a false dawn?

Donald Trump and is making noises about an interim trade deal with the CCP, while Boris Johnson appears to be making progress on a Brexit deal with Ireland premier Leo Varadkar.

Trump’s announcement is little more than a sham, intended to goose financial markets, with nothing yet committed to writing:

“Trump said the deal would take three to five weeks to write and could possibly be wrapped up and signed by the middle of November….”

…what could possibly go wrong?

The economy continues to tick along steadily, with unemployment and initial jobless claims near record lows.

Unemployment & Initial Jobless Claims

But high levels of uncertainty are likely to create a drag on consumer spending and stock earnings.

At the outset of Donal Trump’s presidency, value investor Seth Klarman, who runs the $30 billion Baupost Group hedge fund, predicted the impact that Trump would have on financial markets:

“The erratic tendencies and overconfidence in his own wisdom and judgment that Donald Trump has demonstrated to date are inconsistent with strong leadership and sound decision-making…..

The big picture for investors is this: Trump is high volatility, and investors generally abhor volatility and shun uncertainty…. Not only is Trump shockingly unpredictable, he’s apparently deliberately so; he says it’s part of his plan.”

In his letter, Mr Klarman warned: “If things go wrong, we could find ourselves at the beginning of a lengthy decline in dollar hegemony, a rapid rise in interest rates and inflation, and global angst.”

While not entirely prescient — we have low interest rates and low inflation — Klarman was right about the decline in dollar hegemony and the rise in global angst.

Markets are clearly in risk-off mode.

US Equity ETFs recorded a net outflow of $824m this week, compared to a net inflow of $2,104m into US Fixed Income. Year-to-date flows present a similar picture, with a 3.3% inflow into US Equity compared to 13.9% into US Fixed Income (Source: ETF.com).

ETF Flows YTD

Long tails on the S&P 500 candles indicate buying support. Expect another test of our long-term target at 3000. Volatility remains above 1%, however, indicating elevated risk. Breach of 2800 is unlikely at present but would offer a target of 2400.

S&P 500

According to Factset, the S&P 500 is likely to report a third quarter this year with a year-on-year decline in earnings.

S&P 500 Earnings

The Nasdaq 100 paints a similar picture, with another test of 8000 likely.

Nasdaq 100

It is becoming impossible to justify current heady earnings multiples when reported earnings are declining.

Europe

If Johnson’s “free trade zone” for Northern Ireland can break the Brexit impasse, then there may be room for optimism over the future UK – EU relationship.

Europe seems to be stirring. Trailing a distant third, to North America and Asia in terms of investment performance, there are some early encouraging signs. A higher trough indicates buying pressure and breakout above 400 on DJ Stoxx Euro 600 would signal a primary advance.

DJ Euro Stoxx 600

The Footsie shows similar early signs of a potential recovery. A higher trough on the trend Index indicates buying pressure. Breakout above 7600 would signal a primary advance.

FTSE 100

Let us hope that this is not a false dawn and the UK and EU are able to resolve their differences.

For the present, our outlook for the global economy remains bearish and equity exposure for International Growth is a low 34% of portfolio value.