S&P 500 fueled by the Fed

The S&P 500 continues, unwavering, in a strong up-trend.

S&P 500

But compare the growth in the S&P 500 index relative to growth in the money supply (M2). In relative terms, the S&P 500 appreciated only 29%, or 2.6% p.a., over the past decade. Most of the stellar performance over the past 10 years can be attributed to the Fed’s expansionary monetary policy.

S&P 500/M2 Money Supply

Dollar Index

The Dollar Index continues to test support at 90. A Trend Index peak below zero warns of strong selling pressure. Breach of support is likely and would signal another primary decline.

Dollar Index

The Chinese Yuan, however, has halted in its appreciation against the Dollar. Trend Index peak below the 7-week MA warns of secondary selling pressure. Breach of support at 15.4 US cents would warn of a correction.

CNYUSD

Conclusion

The S&P 500 is likely to continue rising for as long as the Fed expands the money supply. The Dollar, however, is expected to weaken for the same reason.

“Stocks rebound but sentiment soft”

From Bob Doll at Nuveen Investments. His weekly top themes:

1. We think the odds of a U.S. recession are low, but we also believe growth will remain soft for a couple of quarters. U.S. growth may bottom in the first half of 2019 following a relatively disappointing fourth quarter and the recent government shutdown. We expect growth will improve in the second half of the year.

Agreed, though growth is likely to remain soft for an extended period. The Philadelphia Fed Leading Index is easing but remains healthy at above 1.0% (December 2018).

Leading Index

2. Inflation remains low, but upward pressure is mounting. With unemployment under 4% and average hourly earnings rising to an annual 3.6% level, we may start to see prices rise. So far, better productivity growth has kept the lid on prices, but this trend bears watching.

Agreed. Average hourly earnings are rising and inflation may follow.

Hourly Earnings Growth

3. Trade issues remain a wildcard. The U.S./China trade dispute appears to be making progress, but the timeline is slipping and significant disagreement remains over tariff levels and intellectual property protections.

This is the dominant issue facing global markets. Call me skeptical but I don’t see a happy resolution. There is too much at stake for both parties. Expect a drawn out conflict over the next two decades.

4. We do not expect Brexit to cause widespread market issues. We think the risk of a hard Brexit is low, since no one wants to see that outcome. Some sort of soft separation or even a Brexit vote redo appears more likely.

Agreed. Hard Brexit is unlikely. Soft separation is likely, while no Brexit is most unlikely.

5. The health care sector may remain under pressure due to political rhetoric. Health care stocks in general, and managed care companies in particular, have struggled in light of talk about ending private health care coverage. We think Congress lacks the votes to enact such legislation. But this issue, as well as drug pricing policies, are likely to remain at the center of the political dialogue through the 2020 elections.

Health care is a political football and may take longer to resolve than the trade war with China.

6. Downward earnings revisions may present the largest risk for stocks. As recently as September 30, expectations for first quarter earnings growth were +7%. That slipped to +4% by January 1 and has since fallen to -3%.

A sharp fall in earnings would most likely spring from a steep rise in interest rates if the Fed had to combat rising inflation. That doesn’t seem imminent despite rising average hourly earnings. The Fed is maintaining money supply growth at close to 5.0%, around the same level as nominal GDP, keeping a lid on inflationary pressures.

Money Supply & Nominal GDP growth

7. Equity returns may be modest over the next decade compared to the last. Since the bull market began 10 years ago, U.S. stocks have appreciated over 400%. It’s nearly impossible to imagine that pace will be met again, but we feel confident that stocks will outperform Treasuries and cash over the next 10 years.

Expect modest returns on stocks, low interest rates, and low returns on bonds and cash.

Outlook for 2018

At this time of year we are usually inundated with projections for the year ahead, from predictions of imminent collapse to expectations of a record year.

We live in a world of uncertainty, where both extremes are possible, but neither is likely.

We are clearly in stage 3 (the final stage) of a bull market. Risk premiums are close to record lows. The yield spread between lowest investment-grade (Baa) bonds and equivalent risk-free Treasuries has crossed to below 2.0 percent, levels last seen prior to the 2008 global financial crisis. The VIX is also close to its record low, suggesting high levels of investor confidence.

Corporate Bond Spreads and VIX

Money supply continues to grow at close to 5.0 percent, reflecting an accommodative stance from the Fed. MZM, or Zero Maturity Money, is basically M1 plus travelers checks and money market funds.

Zero-Maturity Money

Inflationary forces remain subdued, with average hourly wage rates growing at below 2.5 percent per year. A rise above 3.0 percent, which would pressure the Fed to adopt a more restrictive monetary policy, does not appear imminent.

Average Hourly Wage Rates

Tax relief and higher commodity prices are likely to exert upward pressure on inflation in the year ahead. But the Fed’s stated intention of shrinking its balance sheet, with a reduction of $100 billion in the first 12 months, is likely to have an opposite, contractionary effect.

The Leading Index from the Philadelphia Fed gave a bit of a scare, dipping below 1.0 percent towards the end of last year. But data has since been revised and the index now reflects a far healthier outlook.

Philadelphia Fed Leading Index

A flattening yield curve has also been mooted as a potential threat, with a negative yield curve preceding every recession over the last 50 years.

Yield Differential 10-Year compared to 2-Year and 3-Month Treasuries

A yield differential, between 10-year and either 2-year or 3-month Treasuries, below zero would warn of a recession. When long-term yields fall below short-term yields financial markets stop working efficiently and bank lending tends to contract. Banks, who generally borrow at short-term rates and lend at long-term rates, find their margins are squeezed and become strongly risk-averse. Contracting lending slows the economy and normally leads to recession.

But we are some way from there. If we take the last cycle as an example, the yield curve started flattening in 2005 (when yield differentials fell below 1 percent) but a recession only occurred in 2008. The market could continue to thrive for several years before the impact of a negative yield curve is felt. To exit now would seem premature.

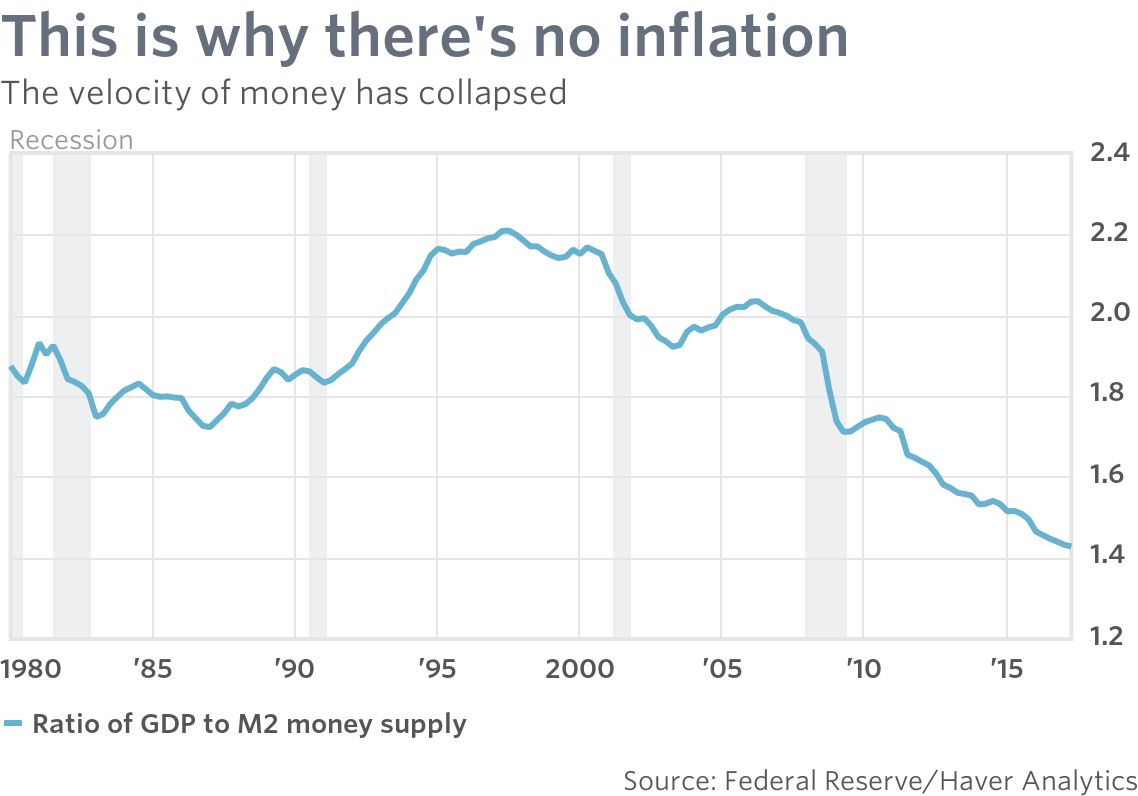
Should we Worry that Velocity of Money is plunging?

Some writers have attributed slow GDP growth in the US to the plunging velocity of money.

In layman’s terms, the velocity of money is the ratio between your bank balance and the amount you spend. For the economy as a whole, it is measured as the ratio of GDP (or national income) against the total stock of money (or money supply).

When the economy is hot, consumers have a higher propensity to spend — or invest in the latest hot stock — and the ratio normally rises. When the economy cools, the ratio falls.

If the ratio was fixed, the job of central bankers would be simple: print more money and GDP would rise.

M1 Money Supply and GDP Growth

Unfortunately that is not the case. GDP growth has remained slow, post-2007, despite a sharp boost in the money supply.

M1 is a narrow definition of money: cash in circulation plus travelers checks, demand deposits (at call) and check account balances.

The ratio of GDP to M1 money (or M1 Velocity) has almost halved, from a 2007 high of 10.7 to a current low of 5.5.

M1 Money Supply and GDP Growth

Does this mean that consumers are feverishly stuffing cash into mattresses as the economy goes into a death-dive or is there a more rational explanation?

Examine the above chart more closely and you will see a clear relationship until 1980 between the velocity of money and interest rates (in this case the Fed funds rate). When interest rates rise, the velocity of money rises. So when interest rates fall, as they have post-2007, to near zero, the velocity of money should fall. As it has done.

The anomaly is not the current fall in the velocity of money but the rise in velocity of money between 1990 and 2000, when interest rates were falling. There are two explanations that I can think of. One is the digital revolution, with the advent of online bank accounts and automated clearing of business checking accounts which enabled depositors to minimize balances in non-interest bearing accounts. Second, is the rapid growth of money market funds which fall outside the ambit of M1 and M2.

Velocity of money measured as GDP/MZM gives a clearer picture, with velocity rising when rates rise and falling when rates fall. MZM is M1 plus all savings deposits and money market funds that are redeemable (at par) on demand.

M1 Money Supply and GDP Growth

We should expect to see the velocity of money recover as interest rates rise. If that doesn’t happen, then it will be time to worry.

Strange as it may seem, we could witness something really unusual: if higher interest rates stimulate GDP.

Fed flunks econ 101?

Caroline Baum’s opinion on the Fed’s approach to inflation:

For all the sturm und drang about the Fed debasing the dollar and sowing the seeds of the next great inflation, the public’s demand for money has increased. The increased desire to hold cash and checkable deposits has risen to meet the increased supply. Velocity, or the rate at which money turns over, has plummeted.

The Fed has two choices. It can adopt the Dr. Strangelove approach and learn to stop worrying and live with low inflation and low unemployment. Or it can do something about it, which runs counter to its stated intention to raise the funds rate and reduce the size of its balance sheet.

Option #1 involves learning to live with a low, stable inflation rate about 0.5 percentage point below the Fed’s explicit 2% target.

Not only has the Fed has achieved price stability in objective terms, but it has also fulfilled former Fed Chairman Alan Greenspan’s subjective definition of price stability: a rate of inflation low enough that it is not a factor in business or household decision-making.

Option #2 means taking some additional actions to increase the money supply by lowering interest rates or resuming bond purchases. The Fed is taking the opposite approach. It began its balance sheet normalization this month, allowing $10 billion of securities to mature each month and gradually increasing the amount every quarter. And it has guided markets to expect another 25-basis-point rate increase in December….

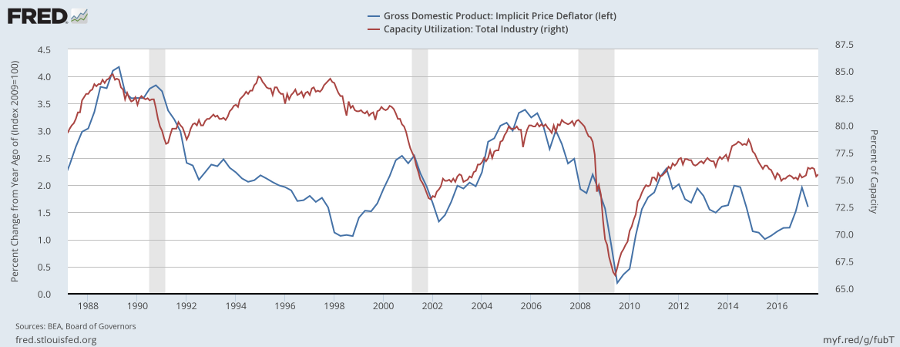
The Fed faces a delicate balancing act. Unemployment is low but capacity utilization is also low, indicating an absence of inflationary pressure.

Capacity Utilization

Janet Yellen understandably wants to normalize interest rates ahead of the next recession but she can afford to take her time. The economy is unlikely to tip into recession unless the Fed hikes rates too quickly, causing a monetary contraction.

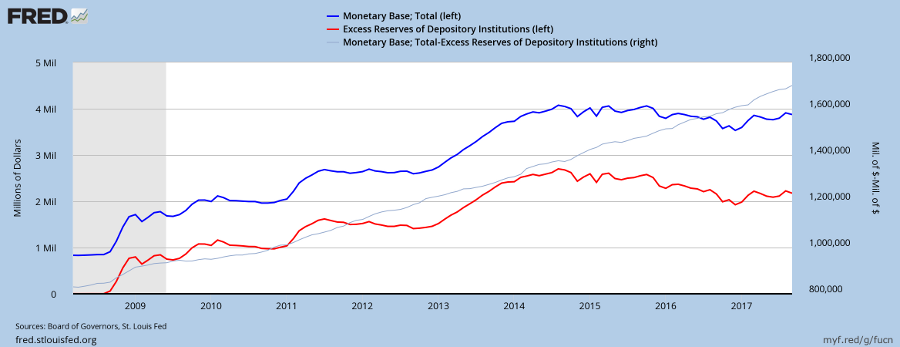
I believe the Fed chair is relying on the outflow from more than $2 trillion of excess reserves held by banks on deposit with the Fed to offset the contractionary effect of any rate hikes.

Capacity Utilization

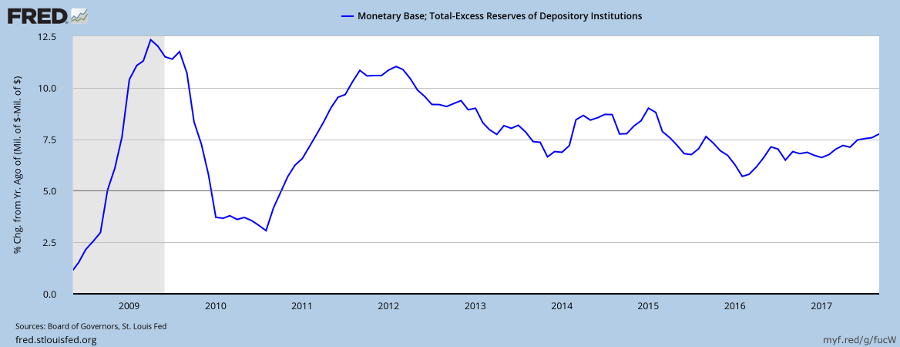
If pushed, the Fed could lower the interest rate paid on excess reserves in order to encourage banks to withdraw excess deposits. But so far this hasn’t been necessary. The attraction of higher interest rates in financial markets has been sufficient to encourage a steady outflow from excess reserves, keeping the monetary base (net of reserves) growing at a steady clip of close to 7.5% p.a. despite rate hikes so far.

Capacity Utilization

Makes you wonder why Donald Trump would even consider replacing the Fed chair when she is doing a great job of managing the recovery.

Source: Fed flunks econ 101: understanding inflation – MarketWatch

More evidence of a bull market, except in Australia

One of my favorite indicators of financial market stress is Corporate bond spreads. The premium charged on the lowest level of investment-grade corporate bonds, over the equivalent 10-year Treasury yield, is a great measure of the level of financial market stress.

Moodys 10-year BAA minus Treasury yields

Levels below 2 percent — not seen since 2004 – 2007 and 1994 – 1998 before that — are indicative of a raging bull market. The current level of 2.24 percent is slightly higher, reflecting some caution, but way below elevated levels around 3 percent.

The Financial Stress Index from St Louis Fed measures the degree of stress in financial markets. Constructed from 18 weekly data series: seven interest rate series, six yield spreads and five other indicators. The average value of the index is designed to be zero (representing normal market conditions); values below zero suggest low financial stress, while values above zero suggest high market stress.

St Louis Financial Stress Index

Current levels, below -1, also indicate unusually low levels of financial market stress.

Leading Index

The Leading Index from the Philadelphia Fed has declined slightly in recent years but remains healthy, at above 1 percent.

Philadelphia Fed Leading Index

Currency in Circulation

Most recessions are preceded by growth in currency in circulation falling below 5 percent, warning that the economy is contracting.

Currency in Circulation

Current levels, above 5 percent, reflect healthy financial markets.

Australia

On the other side of the Pacific, currency growth is shrinking, below 5 percent for the first time in 7 years. A sustained fall would warn that the economy is contracting.

Australia: Money Supply

Further rate cuts, to stimulate the economy, are unlikely. The ratio of Household Debt to Disposable Income is climbing and the RBA would be reluctant to add more fuel to the bonfire.

Australia: Household Debt

There is no immediate pressure on the RBA to raise interest rates, but when the time comes the impact on the housing market could be devastating.

US Job Growth, Wage Rates & Inflation

Payrolls jumped by a seasonally adjusted 235,000 jobs in February, setting the Fed on track for another rate rise next week.

US Job Growth

GDP growth is projected to lift in line with employment, wage rates and hours worked. At this stage, the Fed is still attempting to normalize interest rates rather than slow the economy to cool inflationary pressures.

Projected GDP

Wage rate growth remains muted, at close to 2.5 percent, so rate hikes are likely to proceed at a gradual pace.

Hourly Wage Rates and Money Supply

The need to tighten monetary policy is only likely to be seriously considered when wage rate growth [light green] exceeds 3.0 percent [dark green line]. Then you are likely to witness a dip in money supply growth [blue], as in 2000 and 2006, with bearish consequences for stocks.

*The dip in 2010 was a mistake by the Fed, taking its foot off the gas pedal too soon after the 2008 crash.

The Threat of Inflation

From the Trading Diary:

I received a message from a US reader suggesting I should “stay out of politics”.

I would love to stay out of politics. Frankly, I find it tiresome. Unfortunately, politics and the economy are so intertwined as to make the study of one meaningless without consideration of the other. I say “unfortunately” because a lot of the damage done to the economy is caused by the political system.

As for Donald Trump, I am a conservative but do not support him. He is not another Reagan who can lead from the center and inspire his country. If anything he is a polarizing force, more ego-driven than Nixon and just as unpredictable.

I hope I am wrong. Trump has many sound policies and has made some solid appointments to his team. Don’t believe everything you read from a hostile media. They could do a lot of good. Provided they are able to manage the elephant in the lifeboat — the destabilizing side of Trump’s nature.

Now that I have offended at least half of all US readers — slightly less than half if you listen to bleating about the majority vote — let me explain why politics and economics are so intertwined.

Apart from trade wars, which I will discuss at a later date, I see the main threat to the US economy as inflation.

Before I start, let me say that these dangers are not immediate and the present boom is likely to continue for the next 12 to 18 months. But they could quickly materialize, bringing the boom to a premature end, so it is best to keep a weather eye on them.

Inflation

Earlier this week I discussed why the inflation outlook is so important to stock market performance:

From Tim Wallace at The Sydney Morning Herald:

Nine years on from the start of the financial crisis, the US recovery may be overheating, Legal & General Investment Management economist James Carrick has warned.

He has predicted a series of interest rate hikes will tip the US into a 2018 recession.”Every recession in the US has been caused by a tightening of credit conditions,” he said, noting inflation is on the rise and the US Federal Reserve is discussing plans for higher interest rates.

Officials at the Fed have only raised interest rates cautiously, because inflation has not taken off, so they do not believe the Fed needs to take the heat out of the economy.

But economists fear the strong dollar and low global commodity prices have restricted inflation and disguised domestic price rises. Underneath this, they fear the economy is already overheating.

As a result, they expect inflation to pick up sharply this year, forcing more rapid interest rate hikes.

That could cause a recession next year, they say. In their models, the signals are that this could take place in mid-2018.

Harvard scholar Paul Schmelzing points out that inflation is starting to rear its head in both China and Germany, with producer prices rising. This may in part be a result of the falling value of the Yuan and Euro against the Dollar, resulting in higher domestic commodity prices.

The opposite, however, is true for the US, with a rising Dollar lowering import prices and acting as a headwind against inflation.

The consumer price index (CPI) is rising because of higher crude oil prices but core CPI (excluding food & energy) has remained fairly constant, around the 2.0 percent target, over the last five years.

Core CPI and CPI

So why the concern?

Well the Fed is more concerned about underlying inflation, best reflected by hourly wage rates, than the headline CPI figure.

A sharp rise in hourly earnings rates would force the Fed to respond with tighter monetary policy to take the heat out of the economy.

The chart below shows how the Fed slams on the brakes whenever average hourly earning rates grow above 3.0 percent. Each surge in hourly earnings is matched by a dip in the currency growth rate as the Fed tightens the supply of money to slow the economy and reduce inflationary pressure. And tighter monetary normally leads to recession.

Hourly Earnings Growth compared to Currency in Circulation

Two anomalies on the above chart warrant explanation. First, is the sharp upward spike in currency growth in 1999/2000 when the Fed reacted to the LTCM crisis with monetary stimulus despite high inflationary pressures. Second, is the sharp dip in 2010 when the Fed took its foot off the gas pedal too soon after the financial crisis of 2008/2009, mistaking it for a regular recession.

Hourly earnings growth is currently at 2.5 percent, so the Fed has some wiggle room and is only likely to react with tighter monetary policy when the figure reaches 3.0 percent.

Recent rate rises are more about normalizing interest rates — not taming inflation — and are not cause for alarm.

But Paul Schmelzing warns that the combination of a tight labor market and fiscal stimulus could fuel inflation and lead to a bear market in bonds similar to the 1960s.

That is exactly where Donald Trump is headed with a major infrastructure program likely to hit the ground next year. In a tightening labor market, the Fed would be forced to tighten monetary policy, slowing the economy and leading to another bear market in stocks as well as bonds.

Politics is tricky; it cuts both ways. Every time you make a choice, it has unintended consequences.

~ Stone Gossard

China’s credit boom: How long will it last?

Where All The Commodity Gains Have Come From

Tyler Durden:

Trading in futures on everything from steel reinforcement bars and hot-rolled coils to cotton and polyvinyl chloride has soared this week, prompting exchanges in Shanghai, Dalian and Zhengzhou to boost fees or issue warnings to investors. Eventually, the excesses will need to be curbed and maybe that starts a new phase of risk-off within China.

As Bloomberg reports, While the underlying products may be anything but glamorous, the numbers are eye-popping: contracts on more than 223 million metric tons of rebar changed hands on Thursday, more than China’s full-year production of the material used to strengthen concrete.

The frenzy echoes the activity that fueled China’s stock market last year before a rout erased $5 trillion, and follows earlier bubbles in property to garlic and even certain types of tea. China’s army of investors is honing in on raw materials amid signs of a pickup in demand and as the nation’s equities fall the most among global markets and corporate bond yields head for the steepest monthly rise in more than a year. Hao Hong, chief China strategist at Bocom International Holdings Co. in Hong Kong, says the improvement in fundamentals and the availability of leverage to bet on commodities is making them irresistible to traders. “These guys are going nuts,” Hong said. “Leverage exaggerates the move of the way up, but also on the way down – much like what margin financing did to stocks in 2015.”

China’s fresh boom nears peak just as amateurs pile in

Tyler highlights the “irrational exuberance” in commodities futures markets but Ambrose Evans-Pritchard at The Telegraph nails the cause:

China’s reflation drive has been explosive. New home sales jumped 64pc in March from a year earlier. House prices have risen 28pc in Beijing, 30pc in Shanghai, and 63pc in the commercial hub of Shenzhen. The rush to buy has spread to the Tier 2 cities such as Hefei – up 9pc in a single month.

“The housing market is on fire,” said Wei Yao, from Societe Generale. “In the first quarter, increases in total credit exploded to 7.5 trilion yuan, up 58pc year-on-year. There is no bigger policy lever than this kind of credit injection.”

“This looks like an old-styled credit-backed investment-driven recovery, which bears an uncanny resemblance to the beginning of the “four trillion stimulus” package in 2009. The consequence of that stimulus was inflation, asset bubbles and excess capacity. We still think that this recovery will not last very long,” she said.

China Property Starts

Yang Zhao from Nomura …. said the law of diminishing returns is setting in as the economy nears credit exhaustion. The ‘incremental credit-output ratio” has deteriorated to 5.0 from 2.3 in 2008. Loans are losing traction and the quality of investment is falling.

“Be careful. We are nearing the point where things are as good as they get for the first half of 2016. We recommend taking some money off the table,” said Wendy Liu and Vicky Fung, the bank’s equity strategists.

….Michelle Lam from Lombard Street Research said Beijing has retreated from reform and resorted to pump-priming again. “This may last for one or two quarters. But how much longer can Beijing go on creating debt at a breakneck pace?” she said.

China Money and Credit Growth

Their actions reveal desperation at the PBOC. Faced with the unpalatable choice between running down foreign reserves at the rate of more than $50 billion a month, to support the dollar peg, or devaluing the Yuan which would fuel even greater capital flight, the central bank opted to inject a further round of credit stimulus to ease the immediate pressure. There are no free lunches: further credit expansion pushes China’s economy ever closer to a financial crisis.

We are in for a volatile year. Make that a decade…..

Source: The Stunning Chart Showing Where All The Commodity Gains Have Come From | Zero Hedge

Source: China’s fresh boom nears peak just as amateurs pile in | Ambrose Evans-Pritchard

Joseph Stiglitz: We have to shift our focus from money to credit | The IMF Blog

Joseph Stiglitz writes:

This might seem obvious. But a focus on the provision of credit has neither been at the center of policy discourse nor of the standard macro-models. We have to shift our focus from money to credit. In any balance sheet, the two sides are usually going to be very highly correlated. But that is not always the case, particularly in the context of large economic perturbations. In these, we ought to be focusing on credit.

This approach should be obvious to bankers who stand astride the two sides of their balance sheet: loan assets (credit) and deposit liabilities (money). Deposit liabilities may at times grow faster than loan assets but not vice versa.

Read more at The Lessons of the North Atlantic Crisis for Economic Theory and Policy | iMFdirect – The IMF Blog.