Fed flunks econ 101?

Caroline Baum’s opinion on the Fed’s approach to inflation:

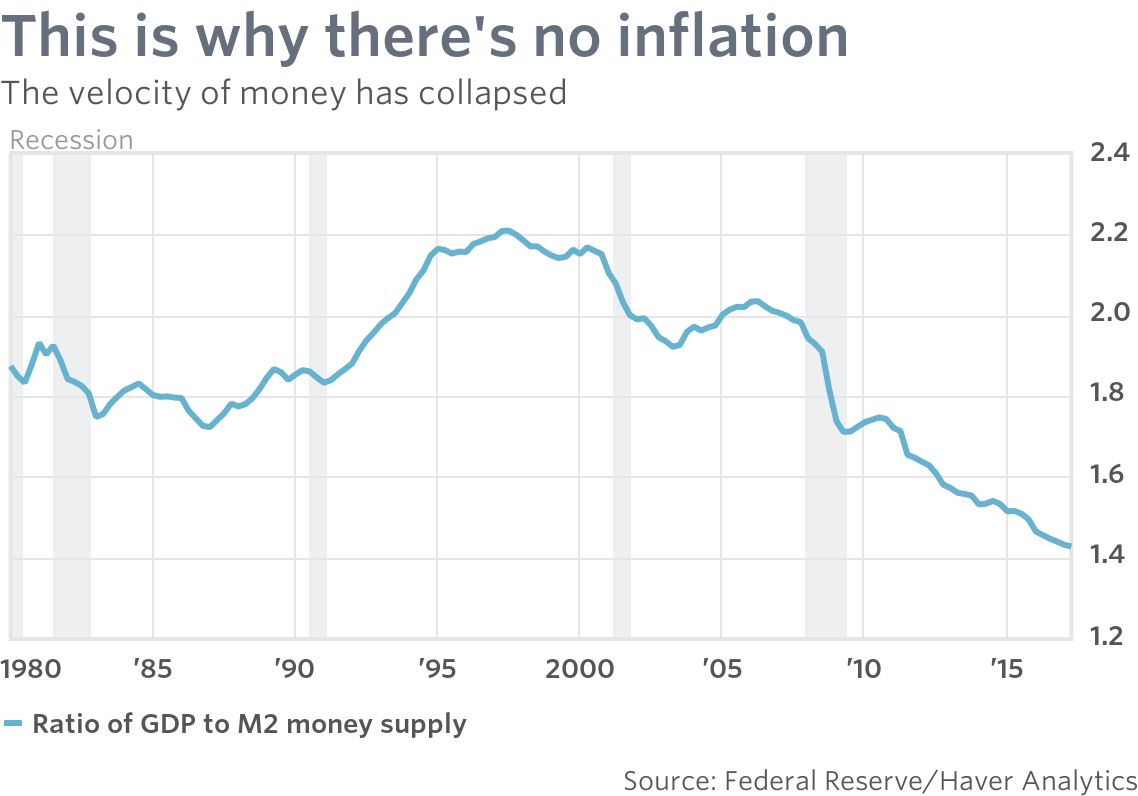
For all the sturm und drang about the Fed debasing the dollar and sowing the seeds of the next great inflation, the public’s demand for money has increased. The increased desire to hold cash and checkable deposits has risen to meet the increased supply. Velocity, or the rate at which money turns over, has plummeted.

The Fed has two choices. It can adopt the Dr. Strangelove approach and learn to stop worrying and live with low inflation and low unemployment. Or it can do something about it, which runs counter to its stated intention to raise the funds rate and reduce the size of its balance sheet.

Option #1 involves learning to live with a low, stable inflation rate about 0.5 percentage point below the Fed’s explicit 2% target.

Not only has the Fed has achieved price stability in objective terms, but it has also fulfilled former Fed Chairman Alan Greenspan’s subjective definition of price stability: a rate of inflation low enough that it is not a factor in business or household decision-making.

Option #2 means taking some additional actions to increase the money supply by lowering interest rates or resuming bond purchases. The Fed is taking the opposite approach. It began its balance sheet normalization this month, allowing $10 billion of securities to mature each month and gradually increasing the amount every quarter. And it has guided markets to expect another 25-basis-point rate increase in December….

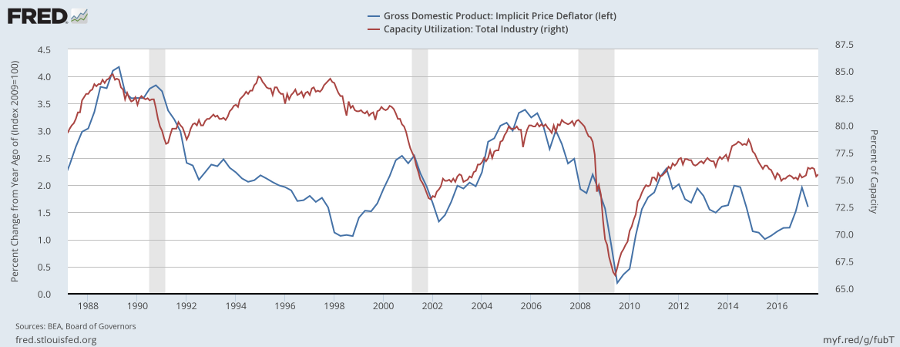
The Fed faces a delicate balancing act. Unemployment is low but capacity utilization is also low, indicating an absence of inflationary pressure.

Capacity Utilization

Janet Yellen understandably wants to normalize interest rates ahead of the next recession but she can afford to take her time. The economy is unlikely to tip into recession unless the Fed hikes rates too quickly, causing a monetary contraction.

I believe the Fed chair is relying on the outflow from more than $2 trillion of excess reserves held by banks on deposit with the Fed to offset the contractionary effect of any rate hikes.

Capacity Utilization

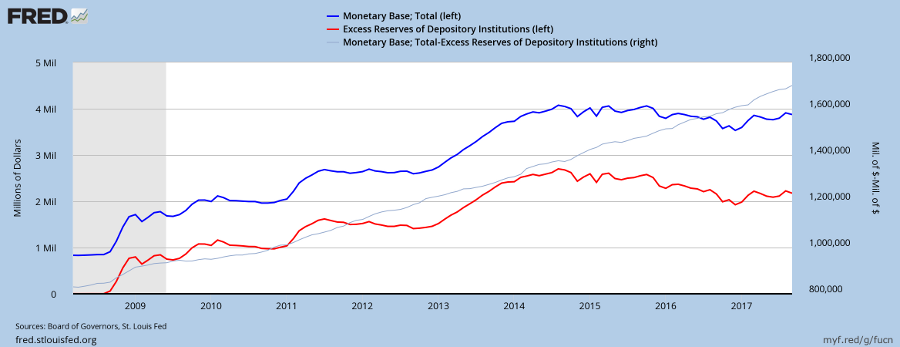
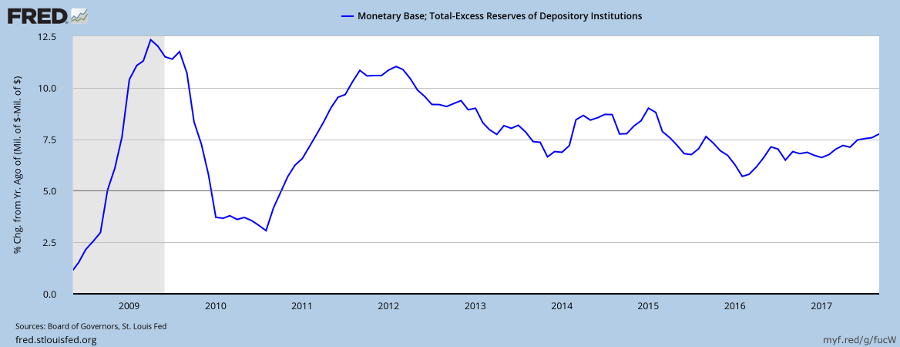
If pushed, the Fed could lower the interest rate paid on excess reserves in order to encourage banks to withdraw excess deposits. But so far this hasn’t been necessary. The attraction of higher interest rates in financial markets has been sufficient to encourage a steady outflow from excess reserves, keeping the monetary base (net of reserves) growing at a steady clip of close to 7.5% p.a. despite rate hikes so far.

Capacity Utilization

Makes you wonder why Donald Trump would even consider replacing the Fed chair when she is doing a great job of managing the recovery.

Source: Fed flunks econ 101: understanding inflation – MarketWatch

Nasdaq and S&P500 meet resistance

July labor stats are out and shows the jobless rate fell to a 16-year low at 4.3%. Unemployment below the long-term natural rate suggests the economy is close to capacity and inflationary pressures should be building.

Unemployment below the long-term natural rate

Source: St Louis Fed, BLS

But hourly wage rates are growing at a modest pace, easing pressure on the Fed to raise interest rates.

Hourly Wage Rates

Source: St Louis Fed, BLS

Fed monetary policy remains accommodative, with the monetary base (net of excess reserves) growing at a robust 7.5% a year.

Hourly Wage Rates

Source: St Louis Fed, FRB

Our forward estimate of real GDP — Nonfarm Payroll * Average Weekly Hours — continues at a slow but steady annual pace of 1.79%.

Real GDP compared to Nonfarm Payroll * Average Weekly Hours

Source: St Louis Fed, BLS & BEA

The Nasdaq 100 has run into resistance at 6000. No doubt readers noticed Amazon [AMZN] and Alphabet [GOOG] both retreated after reaching the $1000 mark. This is natural. Correction back to the rising trendline would take some of the heat out of the market and provide a solid base for further gains. Selling pressure, reflected by declining peaks on Twiggs Money Flow, appears secondary.

Nasdaq 100

The S&P 500 is also running into resistance, below 2500. Bearish divergence on Twiggs Money Flow warns of moderate selling pressure but this again seems to be secondary — in line with a correction rather than a reversal.

S&P 500

Target 2400 + ( 2400 – 2300 ) = 2500

Monetary Base and deflation

The Monetary Base consists of currency in circulation and commercial bank deposits at the Federal Reserve. Currency in circulation includes notes and coins both in circulation and held in the vaults of commercial banks. Commercial bank deposits at the Fed can be further broken down into required reserves and excess reserves. Excess reserves on deposit have soared — since late 2008 when the Fed started paying interest on reserves — to a level of $2.6 Trillion.

By varying the interest rate payable on excess reserves the Fed can manipulate the amount of currency in circulation. It is no longer reliant solely on Treasury and MBS purchases and sales to increase or decrease the money supply: these are merely one tool in the monetary tool-kit. So announcing that QE (security purchases) have ended does not mean that currency in circulation and the working monetary base (excluding excess reserves) will stop growing or will contract. That would cause deflationary pressure similar to the European experience. Growth, instead, is likely to continue provided that excess reserves are drawn down to compensate for cessation of QE.

US Monetary Base minus Excess Reserves and Currency in Circulation ROC

Deflationary pressures are unlikely to surface provided currency in circulation and the working monetary base continue to grow at above 5% a year. Only if real GDP grew at a faster pace (a problem we would like to have) would we encounter a problem.

Australia has similarly been keeping on the right side of 5% growth since early 2012. Provided this continues we should keep out of trouble.

Australia Monetary Base and Currency in Circulation ROC

Will the stock market collapse when QE is withdrawn?

This chart in Westpac’s Northern Exposure chart summary implies that US stocks rely on Fed balance sheet expansion (QE) for support.

Fed Securities Held Outright v. S&P 500

The curve shows an almost perfect fit. There are just two things wrong with it. First, the scales on the left and right sides of the chart are not proportionate: the scale on the left compares a 9 times increase to a 3 times increase on the right. Second, while the Fed has expanded its balance sheet to more than $4 Trillion, a large percentage of that money has washed straight back to the Fed — deposited by banks as excess reserves.

Fed Total Assets and Excess Reserves

The impact on the working monetary base (monetary base adjusted for excess reserves) is far smaller: a rise of 66% (or $544 billion) over the past 7 years.

Fed Total Assets minus Excess Reserves compared to Working Monetary Base

A chart since 1985 shows nominal GDP (GDP before adjustment for inflation) normally expanded between 5% and 7.5% a year outside of recessions. But NGDP has not recovered above 5% after 2008. This may be partly attributable to lower inflation, but the Fed would clearly want to see NGDP above 5% — roughly 3% real growth and 2% inflation.

Working Monetary Base Growth compared to NGDP

We can also see that growth of below 5% in the working monetary base is often precursor to a recession, 1995/1996 being one exception. The second is when the Fed took their foot off the gas pedal too early, after QE1 in 2010, but were able to resume in time to head off a major contraction. They have been far more circumspect the second time and are likely to maintain monetary base growth North of 5%. Too sharp a slow-down would be cause for concern.

When we calculate the ratio of total US stock market capitalisation to the working monetary base [blue line] it is apparent that market response to the increase in monetary base is far more cautious than it was in 1998/1999.

Working Monetary Base Growth compared to NGDP

With Forward Price to Earnings Ratios for the S&P 500 and Nasdaq close to their long-term average (Westpac Northern Exposure, Page 118), I consider the likelihood of the QE taper precipitating a major market collapse to be remote.

Cause of the 2007/8 crash and threatened double-dip in 2010

Here is the smoking gun. Note the sharp contraction in the US monetary base before the last two recessions and again in 2010. Monetary base (M0) is plotted net of excess bank reserves on deposit with the Fed, which are not in circulation. The Fed responded after the contraction had taken place, instead of anticipating it.

Monetary Base minus Excess Reserves

The long-term problem is that the monetary base should not be expanding at 10 percent a year. More like 3% to 5% — in line with real GDP growth.

Why QE is not working

Lars Christensen, Chief Analyst at Danske Bank, quotes David Beckworth in this lengthy but excellent 2011 paper on Market Monetarism — The Second Monetarist Counter-­revolution:

“…..Declines in the money multiplier and velocity have both been pulling down nominal GDP. The decline in the money multiplier reflects: (1) the problems in the banking system that have led to a decline in financial intermediation as well as (2) the interest the Fed is paying on excess bank reserves. The decline in the velocity is presumably the result of an increase in real money demand created by the uncertainty surrounding the recession. This figure also shows that the Federal Reserve has been significantly increasing the monetary base, which should, all else equal, put upward pressure on nominal spending. However, all else is not equal as the movements in the money multiplier and the monetary base appear to mostly offset each other. Therefore, it seems that on balance it has been the fall in velocity (i.e. the increase in real money demand) that has driven the collapse in nominal spending.”

Beckworth continues:

“[the] sharp decline in velocity appears to be the main contributor to the collapse in nominal spending in late 2008 and early 2009 as changes in the monetary base and the money multiplier largely offset each other. It is striking that the largest run-­ups in the monetary base occurred in the same quarters (2008:Q3, 2008:Q4) as the largest drops in the money multiplier. If the Fed’s payment on excess reserves were the main reason for the decline in the money multiplier and if the Fed used this new tool in order to allow for massive credit easing (i.e. buying up troubled assets and bringing down spreads) without inflation emerging, then the Fed’s timing was impeccable. Unfortunately, though, it appears the Fed was so focused on preventing its credit easing programme from destabilising the money supply that it overlooked, or least underestimated, developments with real money demand (i.e. velocity). As a consequence, nominal spending crashed.”

Christensen concludes:

Subsequent events have clearly proven Beckworth right and it is very likely that had the Federal Reserve not introduced interest on excess reserves then the monetary shocks would have been significantly smaller.

From Market Monetarism – The Second Monetarist Counter-­revolution