Long-tailed candles: North America

Stocks are recovering from their recent soft patch and breakout above resistance is likely, signaling further gains.

The S&P 500 is testing medium-term resistance at 2120. Breakout would signal an advance to 2200*. Three weekly candles with long tails reflect medium-term buying pressure, while a 13-week Twiggs Money Flow trough high above zero indicates long-term pressure. Retracement that respects the new support level at 2100 would further strengthen the bull signal.

S&P 500 Index

* Target calculation: 2120 + ( 2120 – 2040 ) = 2200

CBOE Volatility Index (VIX) at 12 indicates low risk typical of a bull market.

S&P 500 VIX

Dow Jones Industrial Average is testing resistance at 18300. Buying pressure appears similar to the S&P 500 and breakout would offer a target of 19000*.

Dow Jones Industrial Average

* Target calculation: 18300 + ( 18300 – 17600 ) = 19000

Canada’s TSX 60 found support at 870. 13-Week Twiggs Momentum holding above zero continues to indicate a primary up-trend. Breakout above 900 would offer a long-term target of 1000*.

TSX 60 Index

* Target calculation: 900 + ( 900 – 800 ) = 1000

Stocks hesitant

The S&P 500 found short-term support at 2050, but declining 21-day Twiggs Money Flow indicates medium-term selling pressure. Breach of support would signal a correction to test the band of primary support between 1970 and 2000. Recovery above 2080 is less likely at present, but would indicate another test of 2120.

S&P 500 Index

* Target calculation: 2100 + ( 2100 – 2000 ) = 2200

Long-term, the S&P 500 remains bullish and CBOE Volatility Index (VIX) continues to indicate low risk typical of a bull market.

S&P 500 VIX

Dow Jones Industrial Average also retreated and is testing medium-term support at 17500/17600 on the weekly chart. Declining 13-week Twiggs Money Flow indicates moderate selling pressure. Breach of 17500 would test primary support at 17000, while recovery above 18000 would signal another primary advance — confirmed if there is follow-through above 18300.

Dow Jones Industrial Average

* Target calculation: 18000 + ( 18000 – 17000 ) = 19000

Europe

Germany’s DAX encountered resistance at 12000, but selling pressure looks weak. Rising 13-week Twiggs Money Flow indicates long-term buying pressure. Expect support at 11500. Recovery above 12000 would suggest an advance to 12500*.

DAX

* Target calculation: 10000 + ( 10000 – 7500 ) = 12500

The Footsie retreated from 7000. Declining 13-Week Twiggs Money Flow indicates medium-term selling pressure. Breach of support at 6700 would warn of a correction to test primary support at 6150/6200, while respect of support at 6700 would be a bullish sign. Breakout above 7000 would offer a long-term target of 8000*.

FTSE 100

* Target calculation: 7000 + ( 7000 – 6000 ) = 8000

Asia

China’s Shanghai Composite Index continues its primary advance. Recovery of 13-week Twiggs Money Flow above its descending trendline strengthens the signal. Retracement to test the new support level at 3400 remains likely, but expected to be weak.

Shanghai Composite Index

* Target calculation: 3400 + ( 3400 – 2400 ) = 4400

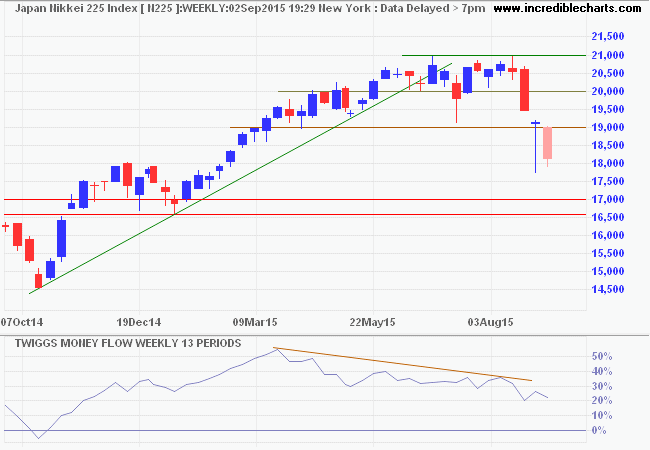
Japan’s Nikkei 225 Index is retracing. Breach of support at 19000 would signal a correction to test 18000, but respect is more likely and recovery above 19500 would indicate another attempt at the long-term target of 20000*. Rising 13-week Twiggs Momentum indicates long-term buying pressure.

Nikkei 225 Index

* Target calculation: 18000 + ( 18000 – 16000 ) = 20000

India’s Sensex is faltering at resistance at 30000. Reversal of 13-week Twiggs Money Flow below zero warns of strong selling pressure. Breach of primary support at 26500/27000 would signal a reversal. Respect of the primary trendline, however, would establish a sound base for further advances.

SENSEX

Australia

The ASX 200 continues to hesitate at 6000. Declining 13-week Twiggs Money Flow indicates moderate (medium-term) selling pressure. Reversal below 5750 is unlikely, but would warn of a correction to 5500. Breakout above 6000 would offer a (medium-term) target of 6250*.

ASX 200

* Target calculation: 6000 + ( 6000 – 5750 ) = 6250


More….

Gold hesitant response to weak Dollar

Crude consolidates

Footsie breaks 15-year high

The measure of who we are is what we do with what we have.

~ Vince Lombardi

DAX surges ahead while others retreat

The DAX is headed for its long-term target of 12000 while most markets (other than Japan) undergo a correction.

The S&P 500 broke support at 2080, indicating a correction to test 2000. Breach of primary support is unlikely and another 13-week Twiggs Money Flow trough above zero would signal another advance.

S&P 500 Index

* Target calculation: 2100 + ( 2100 – 2000 ) = 2200

Dow Jones Industrial Average is similarly correcting to test primary support at 17000.

Dow Jones Industrial Average

CBOE Volatility Index continues to indicate low risk typical of a bull market.

S&P 500 VIX

Europe

Germany’s DAX broke resistance at 11500 and is headed for a test of the long-term target at 12000*. Expect further resistance, possibly a correction, at this level. Rising 13-week Twiggs Momentum indicates a strong up-trend.

DAX

* Target calculation: 11000 + ( 11000 – 10000 ) = 12000

The Footsie retreated from a test of its December 1999 high of 6950. 13-Week Twiggs Momentum oscillating around zero indicates further consolidation. Expect a test of support at 6500.

FTSE 100

* Target calculation: 7000 + ( 7000 – 6000 ) = 8000

Asia

China’s Shanghai Composite Index is consolidating between 3050 and 3400. Declining 13-week Twiggs Money Flow warns of medium-term selling pressure. Reversal below 3050 would warn of a decline to test the primary trendline at 2700. Breakout above 3400 is less likely, but would signal another primary advance.

Shanghai Composite Index

Breach of support at 24000 on Hong Kong’s Hang Seng Index warns of further weakness in China. Follow-through below 23000 would indicate a primary down-trend — and a stronger bear signal (for China).

Hang Seng Index

Japan’s Nikkei 225 Index is retracing to test new support at its 2007 high of 18000/18300. Rising 13-week Twiggs Momentum indicates a strong up-trend. Respect of support is likely and would signal an advance to 20000* — confirmed by follow-through above 19000.

Nikkei 225 Index

* Target calculation: 18000 + ( 18000 – 16000 ) = 20000

India’s Sensex faces stiff resistance at 30000. Bearish divergence on 13-week Twiggs Momentum warns the primary-trend is weakening, but not necessarily a reversal. This could be a mid-point consolidation. Retreat below 29000 indicates a correction. Follow-through below 28000 would test primary support at 26500/27000. Respect of the primary trendline would establish a solid base for further advances.

SENSEX

Australia

The ASX 200 found support at 5750. Recovery above 5850 would suggest the correction is over. Follow-through above 6000 would confirm another advance, with a target of 6250*. Declining 21-day Twiggs Money Flow indicates mild selling pressure. Breach of 5750 is less likely, but would warn of a correction to 5500.

ASX 200

* Target calculation: 6000 + ( 6000 – 5750 ) = 6250


More….

Another downward leg for crude?

Gold falls as Dollar soars

Deflation in Australia?

CPI unwinds as the Fed runs out of “patience”

Dad’s Army fumbles housing affordability | Macrobusiness

When good news is bad news

Crude in contango

Life is a school of probability.

~ Walter Bagehot (hat tip to Barry Ritholz)

Dow, Nasdaq advance

Broadening wedges are not patterns on which I place a great deal of reliance, but you can depend on them to generate false signals — in both directions. Dow Jones Industrial Average broke resistance at 17300 and has now penetrated the upper border of the broadening wedge. Follow-through above 17600 would confirm a primary advance with a target of 19000*. Rising 13-week Twiggs Money Flow indicates long-term buying pressure. Reversal below 17000 is unlikely, but would warn of another test of primary support and the rising trendline at 16000.

Dow Jones Industrial Average

* Target calculation: 17500 + ( 17500 – 16000 ) = 19000

The Nasdaq 100 offers a target of 4500*, having broken resistance at 4100. 13-Week Twiggs Money Flow drifting sideways reflects a lack of enthusiasm, but recovery above 35% would flag renewed buying pressure. Reversal below 4000 is unlikely.

Nasdaq 100

* Target calculation: 4100 + ( 4100 – 3700 ) = 4500

Dow and S&P 500 make new highs

  • US stocks have reaffirmed their bull market
  • European stocks are recovering
  • China and Japan signal up-trends
  • ASX is rising
  • Gold is falling

The new reporting season is under way and fund managers are now looking for opportunities rather than selling off under-performers.

Dow Jones Industrial Average made a new high, above 17300, signaling a primary advance. Reversal below 17000 and the rising trendline is most unlikely, but would warn of another correction. Target for the advance is 18000*.

Dow Jones Industrial Average

* Target calculation: 17000 + ( 17000 – 16000 ) = 18000

The S&P 500 similarly made a new high, signaling a fresh advance. Rising 13-week Twiggs Money Flow (above zero) indicates medium-term buying pressure. Target for the advance is 2150*. Reversal below 2000 and the rising trendline is unlikely, but would signal another correction.

S&P 500 Index

* Target calculation: 2000 + ( 2000 – 1850 ) = 2150

CBOE Volatility Index (VIX) at 14 indicates low risk typical of a bull market.

S&P 500 VIX

Dow Jones Euro Stoxx 50 continues to advance above its former primary support level at 3000. Long tails on the weekly candlesticks and recovery of 13-week Twiggs Money Flow above zero indicate buying pressure. Expect another test of 3300. Reversal below 3000 is less likely, but would signal a primary down-trend.

Dow Jones Euro Stoxx 50

* Target calculation: 3000 – ( 3300 – 3000 ) = 2700

China’s Shanghai Composite Index rallied above its recent high at 2400, confirming a primary up-trend. Target for the new advance is 2500*. and the rising trendline, warning of a correction. Rising 13-week Twiggs Money Flow trough (above zero) indicates medium-term buying pressure; completion of a trough high above zero would signal trend strength.

Shanghai Composite Index

* Target calculation: 2400 + ( 2400 – 2300 ) = 2500

Japan’s Nikkei 225 Index broke resistance at 16300, signaling an advance with a long-term target of 18000*. Reversal below 16000 is unlikely, but would warn of another correction.

Nikkei 225 Index

* Target calculation: 16000 + ( 16000 – 14000 ) = 18000

The ASX 200 is headed for a test of resistance at 5660. Brief retracement at 5440 and rising 21-day Twiggs Money Flow (above zero) both indicate medium-term buying pressure. Reversal below 5440 is unlikely, but would indicate a test of 5250. I have lowered the target to 6000* because of constant back-filling in recent months.

ASX 200

* Target calculation: 5650 + ( 5650 – 5300 ) = 6000

Dow and S&P 500 make new highs

  • US stocks have reaffirmed their bull market
  • European stocks are recovering
  • China and Japan signal up-trends
  • ASX is rising

The new reporting season is under way and fund managers are now looking for opportunities rather than selling off under-performers.

Dow Jones Industrial Average made a new high, above 17300, signaling a primary advance. Reversal below 17000 and the rising trendline is most unlikely, but would warn of another correction. Target for the advance is 18000*.

Dow Jones Industrial Average

* Target calculation: 17000 + ( 17000 – 16000 ) = 18000

The S&P 500 similarly made a new high, signaling a fresh advance. Rising 13-week Twiggs Money Flow (above zero) indicates medium-term buying pressure. Target for the advance is 2150*. Reversal below 2000 and the rising trendline is unlikely, but would signal another correction.

S&P 500 Index

* Target calculation: 2000 + ( 2000 – 1850 ) = 2150

CBOE Volatility Index (VIX) at 14 indicates low risk typical of a bull market.

S&P 500 VIX

Dow Jones Euro Stoxx 50 continues to advance above its former primary support level at 3000. Long tails on the weekly candlesticks and recovery of 13-week Twiggs Money Flow above zero indicate buying pressure. Expect another test of 3300. Reversal below 3000 is less likely, but would signal a primary down-trend.

Dow Jones Euro Stoxx 50

* Target calculation: 3000 – ( 3300 – 3000 ) = 2700

China’s Shanghai Composite Index rallied above its recent high at 2400, confirming a primary up-trend. Target for the new advance is 2500*. and the rising trendline, warning of a correction. Rising 13-week Twiggs Money Flow trough (above zero) indicates medium-term buying pressure; completion of a trough high above zero would signal trend strength.

Shanghai Composite Index

* Target calculation: 2400 + ( 2400 – 2300 ) = 2500

Japan’s Nikkei 225 Index broke resistance at 16300, signaling an advance with a long-term target of 18000*. Reversal below 16000 is unlikely, but would warn of another correction.

Nikkei 225 Index

* Target calculation: 16000 + ( 16000 – 14000 ) = 18000

The ASX 200 is headed for a test of resistance at 5660. Brief retracement at 5440 and rising 21-day Twiggs Money Flow (above zero) both indicate medium-term buying pressure. Reversal below 5440 is unlikely, but would indicate a test of 5250. I have lowered the target to 6000* because of constant back-filling in recent months.

ASX 200

* Target calculation: 5650 + ( 5650 – 5300 ) = 6000

Dow & Nasdaq buying pressure

Dow Jones Industrial Average penetrated its descending trendline, suggesting that the correction is over. Recovery above 17000 would signal an advance to 18000* — confirmed if follow-through above resistance at 17300. Rising 21-day Twiggs Money Flow indicates medium-term buying pressure. Respect of resistance at 17000 is unlikely, but would warn of another test of 16350.

Dow Jones Industrial Average

* Target calculation: 17000 + ( 17000 – 16000 ) = 18000

The Nasdaq 100 recovered above its descending trendline and resistance at 4000, signaling an advance to 4500*. Follow-through above 4100 would confirm. Recovery of 13-week Twiggs Money Flow above 35% would flag buying pressure. Reversal below 4000 is unlikely, but would warn of a test of another test of the rising trendline.

Nasdaq 100

* Target calculation: 4100 + ( 4100 – 3700 ) = 4500

October sell-off: Drawing to a close?

  • DAX and FTSE find support, but remain in a down-trend
  • China is bullish, but Japan bearish
  • US stocks find support and continue to indicate a bull market
  • ASX respects primary support

The S&P 500 found support at 1820 and is testing resistance at 1900. Breach of resistance would suggest that the correction is over. 21-Day Twiggs Money Flow below zero, however, continues to warn of medium-term selling pressure. Respect of resistance is more likely, indicating another test of support at 1800*.

S&P 500 Index

* Target calculation: 1900 – ( 2000 – 1900 ) = 1800

CBOE Volatility Index (VIX) retreated to 22, indicating moderate risk, but nowhere near the 30+ levels typical of a bear market.

S&P 500 VIX

Dow Jones Industrial Average recovered above resistance (the former support level) at 16300, the long tail indicating short-term buying pressure. Follow-through above the descending trendline would signal that the correction is over. Recovery above the recent highs at 25% on 13-week Twiggs Money Flow would suggest that buyers have regained control.

Dow Jones Industrial Average

Germany’s DAX is retracing to test resistance at 9000. Respect would confirm a primary down-trend. 13-Week Twiggs Momentum below zero strengthens the bear signal. Target for the decline is 8000*. Recovery above 9000 remains unlikely, but would warn of a bear trap.

Dow Jones Euro Stoxx 50

* Target calculation: 9000 – ( 10000 – 9000 ) = 8000

The Footsie displays a similar long tail, indicating buying pressure. Recovery above 6500 is unlikely, but would warn of a bear trap. Respect of resistance would offer a target of 6000*.

FTSE 100 Index

* Target calculation: 6400 – ( 6800 – 6400 ) = 6000

China’s Shanghai Composite Index is testing support at 2340/2350. Breach would warn of a correction. But the primary up-trend remains and rising 13-week Twiggs Money Flow signals medium-term buying pressure.

Shanghai Composite Index

Japan’s Nikkei 225 Index plunged through support at 14800, warning of a test of primary support at 13900/14000. Reversal of 13-week Twiggs Money Flow below zero indicates (long-term) selling pressure.

Nikkei 225 Index

The ASX 200 recovered above resistance at 5250 and the descending trendline, suggesting that the correction is over. Bullish divergence and a rising 21-day Twiggs Money Flow (above zero) indicates medium-term buying pressure. Recovery above 5350 would confirm that buyers are back in control, while reversal below 5250 would indicate another test of 5000/5050.

ASX 200

* Target calculation: 5350 – ( 5650 – 5350 ) = 5050

ASX 200 VIX remains below 20, indicating low risk typical of a bull market.

ASX 200 VIX

US stocks: Broad selling pressure

The S&P 500 broke through support at 1900, offering a target of 1800*. Decline of 21-day Twiggs Money Flow below zero warns of medium-term selling pressure. Recovery above 1910 is unlikely at present, but would suggest a bear trap.

S&P 500

* Target calculation: 1900 – ( 2000 – 1900 ) = 1800

CBOE Volatility Index (VIX) broke above 20%, but still indicates moderate risk. A break above 30% would suggest elevated risk.

VIX Index

Dow Jones Industrial Average is testing support at 16300. Breach would indicate a test of the (primary) rising trendline. Bearish divergence on 13-week Twiggs Money Flow continues to warn of selling pressure. Recovery above 16500 is less likely, but would suggest another rally.

Dow Jones Industrial Average

The Nasdaq 100 broke support at 3850. Follow-through below 3750 would confirm a target of primary support at 3400*. Divergence on 13-week Twiggs Money Flow indicates selling pressure. Respect of support at 3750 is unlikely, but recovery above 3850 would suggest another rally.

Nasdaq 100

* Target calculation: 3750 – ( 4100 – 3750 ) = 3400