Skip to content
the patient investor

the patient investor

  • Market Analysis
  • Managing Risk
    • Bull/Bear Market Indicator
    • Stock Market Valuation
  • Mega Trends
    • Global population
    • Environmental damage
    • Decarbonization
      • Energy: The coming crisis
      • Lithium
    • Internet
    • Digital communication
    • Automation
    • Health care and medical science
    • Debt & Inflation
    • Globalization
    • Geopolitics and great power conflict
  • About
    • Colin Twiggs
    • Terms of Use
    • Privacy Policy
    • Contact Us
  • Subscribe
  • Login

Tag: current account

Posted on January 24, 2024January 25, 2024

The shell game

An interesting discussion with Prof. Percy Allan from University of Technology, Sydney regarding what caused declining economic growth in recent decades. The chart below shows how real GDP growth in the US declined over the past sixty years — from a 10-year average above 4.0% to a low of 2.2% over the most recent decade.

Real GDP Growth

The primary cause is the decline in capital investment, with 10-year average capital formation declining from between 3.5% and 3.6% in the 1970s and early 1980s to between 2.2% and 2.3% in the past decade. You need new investment in capital equipment in order to improve the efficiency of labor (productivity) — increasing output (GDP) at a faster rate than labor input.

Capital Formation

One possible argument for the decline is that productivity (blue) has grown at a faster rate than average hourly earnings (red) since the mid-1980s. This means that workers receive a smaller share of output (GDP) and are likely to consume less. Lower consumption will in turn lead to lower investment as there is no domestic market for the additional output1.

GDP/Payroll & Average Hourly Earnings

But that argument does not hold true for the US, where personal consumption has grown as a percentage of GDP since the mid-1960s.

Personal Consumption

The increase in consumption was funded by an increase in debt. The ratio of non-financial debt to GDP doubled from 1.32 in 1960 to 2.64 in Q3 of last year.

NonFinancial Debt/GDP

The increase in debt occurred in three steps: 1980-1990; 2000-2009; and 2019 -2020. These steps coincide with three massive surges in the current account deficit below, when Japan, Germany and China (the largest three exporters to the US since the 1980s) exported surplus output to the US by manipulating their capital account.

Current Account/GDP

If China, for example, exports goods to the US and does not import a corresponding amount of goods and services, it will have a current account surplus. The flow of Dollars to China in payment will drive up the Yuan exchange rate, making Chinese goods more expensive and restoring the trade balance. But exporters like Japan, China and Germany manipulate their exchange rate by investing in US Dollar securities and assets. The outflow on their capital account then offsets the inflow on current account2 and prevents their exchange rate from rising to restore the balance in trade.

Conclusion

US workers share of GDP has fallen since the mid-1980s, causing rising inequality and political tensions. But the impact on their standard of living was cushioned by the shell game run by US political leaders and foreign trading partners. Personal consumption climbed despite workers’ smaller share of output, enabled through increased availability of cheap debt — funded by foreign trade partners through a growing current account deficit.

The result was a strong Dollar as foreign capital flowed into the US. Wall Street were big cheerleaders of the policy because it gave them access to huge volumes of cheap debt.

The combination of cheap debt and inflation also exacerbated rising inequality between workers and owners of capital. The wealthy were able to to profit from inflation, using their balance sheets to borrow at cheap rates and buy real assets as a hedge against inflation. Workers — with weak balance sheets and no access to leverage — bore the brunt of rising prices.

The downside to the strong Dollar policy is that it made US manufacturers uncompetitive, both in export markets and against imports in domestic markets. The result was an erosion of US  manufacturing jobs (below) and increased reliance on foreign imports which both the Trump and Biden administrations have tried to reverse.

Manufacturing Jobs

Efforts to weaken the US Dollar and reduce the current account deficit are laudable. They may well spur an increase in capital investment over time which could revive economic growth. But the days of cheap debt, funded by US trading partners, are likely over.

Long-term interest rates are expected to rise in 2025. So are wage rates. Workers — emboldened by a tight labor market and facing higher interest rates — are expected to demand a larger share of productivity gains than in the past. Inflation is likely to prove persistent.

Acknowledgements

  • Prof. Percy Allan, The Conversation: There are 4 economic scenarios for the rest of the decade – I’ve reluctantly picked one

Notes

    1. The growth model used by Japan, Germany and China is an exception to this, where additional output is exported via a surplus on current account.
    2. The sum of flows on capital account and current account is always equal to zero, with inflows on one account offset by outflows on the other.
Colin Twiggs

Colin Twiggs is a former investment banker with almost 40 years of experience in financial markets. He co-founded Incredible Charts and writes the popular Trading Diary and Patient Investor newsletters.

Using a top-down approach, Colin identifies key macro trends in the global economy before evaluating selected opportunities using a combination of fundamental and technical analysis.

Focusing on interest rates and financial market liquidity as primary drivers of the economic cycle, he warned of the 2008/2009 and 2020 bear markets well ahead of actual events.
He founded PVT Capital (AFSL No. 546090) in May 2023, which offers investment strategy and advice to wholesale clients.

Posted on June 4, 2022

The globalization trap

On March 8, 2000, President Bill Clinton made a persuasive pitch to Washington’s foreign policy elite, Congress and the international community, on the merits of China’s accession to the World Trade Organization:

“Membership in the WTO, of course, will not create a free society in China overnight or guarantee that China will play by global rules. But over time, I believe it will move China faster and further in the right direction……..We have a far greater chance of having a positive influence on China’s actions if we welcome China into the world community instead of shutting it out.”

That was little more than a decade after the Beijing government massacred thousands of students participating in pro-democracy demonstrations in Tiananmen Square, June 1989. Twenty years have passed since China’s 2002 accession to the World Trade Organization. Let’s review how that is working out.

Zero progress toward a free society

Xi Jinping reversed any progress, towards a more open society, made under Hu Jintao. Xi revoked the term limit on his leadership as General Secretary of the Chinese Communist Party; increased censorship and mass surveillance; imprisoned minorities; suppressed news of the COVID outbreak in early 2020, causing a global pandemic; he shredded the one-country-two-systems agreement with the UK and cracked down on the pro-democracy movement in Hong Kong; while threatening democratic Taiwan with invasion.

Malign influence on democratic institutions

Rather than opening up China to Western influence, an open Western society proved highly susceptible to Chinese influence operations. Efforts to suppress free speech include infiltration of universities through establishment of Confucius Institutes and research grants; the Belt-and-Road initiative to increase control over fledgling democracies in the Asia-Pacific and Africa; and growing control over appointments in UN bodies. North Korea, for example, has been appointed as the current Chair of the UN Conference on Nuclear Disarmament.

Growing geopolitical challenge

Trade with the West has empowered China’s development of a powerful nuclear ICBM force, including hypersonic weapons; seizure and militarization of disputed shoals in the South China Sea, flouting international conventions; and development of a blue-water navy to expand its influence far beyond its shores.

Negative economic impact on the US.

Ignore the flowery speeches about democracy and freedom from the former President, the primary purpose of China’s admission was to enrich US corporations. When President Clinton described China’s admission as a “win-win”, you can be sure that US multinationals understood this to mean increased profit margins and new markets. China was also meant to benefit economically, to the extent that workers’ standard of living would need to rise so that they could consume more mass-produced Western goods.

It didn’t work out as planned.

Corporate profit margins rose to new highs, post-2002, as employee compensation fell.

Corporate Profits as Percentage of Value Added

The price was destruction of millions of manufacturing jobs as US companies shifted factories to Asia, where labor costs were a fraction of those in the US. Initially the erosion started with low-skill, menial jobs but soon expanded to high technology sectors as China’s industrial base grew.

Manufacturing Jobs

Industrial production in the US stalled after the 2008 crash, losing an entire decade of growth.

Industrial Production

Current account deficits ballooned as Chinese exports flowed into the US, supported by massive capital outflows from China to maintain their currency peg against the US Dollar. Capital outflows prevented the Yuan from appreciating against the Dollar — which would have eroded China’s pricing advantage in international markets.

Current Account

The US slipped from being a net creditor in the 1980s to the world’s biggest debtor, with a negative net international investment position (NIIP) of more than $18 trillion.

Net International Investment Position

Federal debt climbed to a precarious 128% of GDP in 2021 as the government ran ever-larger deficits to support the economy and offset the massive current account hemorrhage.

Federal Debt/GDP

The traditional relationship between government deficits and unemployment started to break down in the late 1980s. Unemployment (RHS) is on an inverted scale below, so high unemployment is near the bottom and low figures are near the top of the chart. Before the late 1980s, deficits were relatively small , increasing to between 4% and 6% of GDP when unemployment spiked during a recession. But deficits were kept close to 3% of GDP in the Reagan-Bush (HW) era, even when employment had recovered (blue circle). The hoped-for boost to GDP failed to materialize but the experiment was nevertheless repeated, even more aggressively, by Trump in 2016-2020, cutting corporate taxes in the hope that this would boost growth. But GDP growth again remained low.

Fiscal Deficit/GDP & Unemployment (inverted scale)

The Fed started expanding its balance sheet after the 2008 global financial crisis, in order to support a massive fiscal deficit of 10% of GDP, and an even larger 15% deficit in 2020. The effect was self-reinforcing as QE discouraged foreign investors from purchasing Treasuries — out of fear that the Dollar was being debased — forcing the Fed to inject ever-larger amounts of QE to make up for the absence of foreign funding. Money supply (M2) spiked upwards as a percentage of GDP, adding to debasement fears.

M2/GDP

There was one win, however, from globalization that the Fed was quick to claim. Low inflation is mistakenly attributed to Fed skill in managing the economy rather than the real reason: erosion of the US industrial base which undermined wages growth, particularly in the manufacturing sector.

CPI & Average Hourly Earnings - Manufacturing

Conclusion

Admission of China to the World Trade Organization in 2002 was an unmitigated disaster, unleashing a massive deflationary shock that destabilized the global financial system. Despite being a developing economy, China become a major exporter of capital, as well as goods, upsetting the level playing field of international exchange rates. This helped to suppress the Yuan, giving Chinese manufacturers an advantage over Western competitors, and caused the loss of millions of manufacturing jobs in the West. The Western response was to run larger deficits, causing public debt to balloon to precarious levels, while central banks efforts to support growing fiscal debt destabilized the global financial system.

Central Bank Total Assets

The recent surge in inflation exposed central banks inability to protect their currencies, without causing a global recession, undermined by precarious public debt levels and bloated central bank balance sheets.

Sir James Goldsmith — interviewed here in 1994 by Charlie Rose — was on the money when he referred to breach of the social contract between capital and labor, that ensured political stability in the West, and the betrayal of trust between political leaders and their electorate.

The present course is unsustainable in the long run and we anticipate an era of de-globalization as nations on-shore critical supply chains. There is no other currency that can compete with the Dollar’s status as global reserve currency but the system is likely to evolve towards a multi-polar world, with several separate trading/currency systems backed by commodities such as Gold, Silver and Base Metals. Oil would be ideal, as energy is central to the global economy, but storage is cumbersome; so a fixed exchange rate between oil and gold/base metals is more likely.

Colin Twiggs

Colin Twiggs is a former investment banker with almost 40 years of experience in financial markets. He co-founded Incredible Charts and writes the popular Trading Diary and Patient Investor newsletters.

Using a top-down approach, Colin identifies key macro trends in the global economy before evaluating selected opportunities using a combination of fundamental and technical analysis.

Focusing on interest rates and financial market liquidity as primary drivers of the economic cycle, he warned of the 2008/2009 and 2020 bear markets well ahead of actual events.
He founded PVT Capital (AFSL No. 546090) in May 2023, which offers investment strategy and advice to wholesale clients.

Posted on May 14, 2022May 14, 2022

Current turmoil and its impact on Gold

Michael Every from Rabobank is bearish on Gold in his recent video:

“I can’t see the case for Gold while the Fed is hiking — you don’t get a correlation with the Fed hiking aggressively and Gold going up…..If you want to buy into the Gold argument you are buying into the end of the US system. You are implicitly backing a New World Order and Commodity-backed currencies.”

Several readers have written, asking if this changes our view on Gold.

The short answer is NO, for three reasons:

1. The Fed can only hike rates until something breaks

Michael qualifies his view: he is bearish on Gold while the Fed hikes interest rates.

The Fed is expected to tighten — but only until something breaks. Not stocks, which they are unlikely to support, but the bond market. Credit is the lifeblood of the economy. When it stops flowing, the Fed is forced to inject liquidity into financial markets to maintain the flow.

Bank credit still grows at a healthy rate.

Bank Credit & Fed Funds Rate

The ratio of Copper/Gold (orange below), however, is a good indication of the economic cycle. When the economy is growing — and long-term interest rates (blue) are increasing — industrial metals, like Copper, rise faster than Gold and the ratio rises. When the economy contracts, the ratio falls.

Copper/Gold going sideways at present warns that the global economy is stalling. It is highly unlikely that the Fed would continue to tighten if the economy starts to contract — which would be signaled by a falling Copper/Gold ratio.

Copper-Gold Ratio & 10-Year Treasury Yield

Consumer sentiment (blue, inverted scale below) also gives a recession warning, at levels normally associated with high unemployment (red).

Unemployment & Consumer Sentiment (inverted scale)

Investment grade corporate bond issuance (green below) is still within its normal range, albeit on the low side, but high yield (light blue) has slowed to near its March 2020 low, warning that we are close to an economic contraction.

Investment Grade & High Yield Corporate Bond Issuance

A fall of investment grade issuance below $50 billion (the Dec 2020 low) would be cause for concern.

2. A strong Dollar is destroying US industry

The US has been running twin deficits for several decades, supporting the US Dollar as global reserve currency and offering US Treasuries as the global reserve asset.

Foreign Debt & Current Account

This has allowed the Financial sector to grow to a point where it dominates the US economy.

Market Capitalization: Financial/Non-Financial Sector

Wall Street may be reluctant to relinquish their “exorbitant privilege” of cheap debt but it has come at a huge cost to the US economy.

In order to supply international financial markets with sufficient Dollars, the US has to run large trade deficits. But every foreign exchange transaction has to have a buyer and a seller, so the large outflow of Dollars on current account is balanced by an equal and opposite inflow on the capital account.

Trade Deficit

The resulting trade imbalance boosts the Dollar exchange rate to the point that US manufacturers find it difficult to compete against foreign manufacturers in export markets and against foreign imports in domestic markets.

The strong Dollar decimated the manufacturing sector which has shed almost 7 million jobs over the past four decades.

Manufacturing Jobs & Current Account

The inflow of surplus capital also encourages malinvestment in nonproductive areas — dressed up to look attractive through leverage and artificially low interest rates — as in the sub-prime crisis. The ratio of GDP (output) to private non-financial debt has declined by more than 50% since the 1960s.

GDP/Non-financial Debt

Cheap debt also enabled the federal government to run large deficits at low cost, spending more than they raised in taxes and softening the impact of the growing trade imbalance.

The largest portion of capital inflows was invested in Treasuries. As the Current account balance plunged, federal debt held by foreign investors ballooned to almost $8 trillion.

Foreign Held Federal Debt & Current Account Balance

3. US debt above 120% of GDP would destroy the bond market

Overall federal debt climbed to more than 120% of GDP, well above the sustainable level of 70% to 80% of GDP posited by Dr Cristina Checherita and Dr Philip Rother in their ECB study of highly indebted economies.

Earlier research by Carmen Reinhart and Ken Rogoff (This Time is Different, 2008) suggested that states where sovereign debt exceeds 100% of GDP almost inevitably default.

That doesn’t mean that the US is about to default but it does mean that the federal government is precariously close to the point of no return, where it can no longer service the interest on its debt and is forced to capitalize it, compounding the problem.

Federal Debt/GDP

The only viable alternative is inflation. If the borrower suppresses interest rates below the rate of inflation, then GDP is likely to grow faster than the debt. This is already evident on the chart above, where US debt-to-GDP fell in the past 12 months. Federal debt (yellow) increased, but nominal GDP (blue) grew faster because of inflation.

Federal Debt & GDP growth

Current turmoil

The global financial system — with a US Dollar reserve currency and US Treasuries as the global reserve asset –appears increasingly fragile as global geopolitical conflict escalates.

China & the Dollar

After China’s admission to the World Trade Organization (WTO), it rapidly accumulated foreign reserves — mostly US Dollars — as it built up its industrial base, reaching $4 trillion by 2014.

China: Foreign Reserves

China maintained a strict peg against the Dollar until 2014, only allowing it to gradually rise in response to US pressure. But in 2014, a surging Dollar — in response to falling CPI and a shrinking deficit — started to cause problems.

Trade Weighted Dollar

The peg to a strong Dollar started to hurt Chinese exports; so in 2014 the authorities allowed the yuan to weaken, easing capital controls. Capital outflows and a falling Yuan attracted speculators like Hayman Capital who shorted the currency, forcing the PBOC to step in to support the currency in 2017.

China: Yuan

In 2018, the Yuan again fell when Donald Trump imposed tariffs on China’s exports to the United States, setting off a trade war.

The third major fall, in 2022, is the result of China’s debt crisis. An over-leveraged economy threatens to contract — triggered by rising US interest rates, a strong Dollar, rising energy prices, and an ongoing pandemic — while regulators attempt to shore up the financial system.

The Belt-and-Road initiative

In 2013 the PBOC were unhappy with the Fed’s program of quantitative easing (QE) which could be seen as currency debasement at the expense of foreign creditors (China).

China’s response was the Belt-and-Road initiative (BRI). This loaned US Dollars to emerging market governments in exchange for lucrative construction contracts, secured against the underlying infrastructure assets. Africa was a prime target.

China: Foreign Reserves

The capital inflow was diverted from US Treasuries — funding the federal deficit — and into the BRI. By 2022, BRI loans — denominated in Dollars to maintain the Yuan’s trade advantage over the Dollar — amounted to close to $5 trillion.

Funding the federal deficit

China’s BRI left Treasury with a problem with funding the US deficit, So far, the gap has been filled by Fed QE and, to a lesser extent, commercial banks.

Externally Held US Treasuries - Major Holders

But QE is not a long-term solution. The twin deficits supporting the US Dollar status as global reserve currency are now broken. And US Treasuries are no longer attractive to foreign investors as the global reserve asset.

The US is faced with a difficult choice:

  1. Allow the Fed to continue its easy monetary policy in the hope that inflation will bail Treasury of its serious debt problem, lowering federal debt to between 70% and 80% of GDP. The risk is that foreign investors will increasingly shun Treasuries, threatening its status as the global reserve asset and driving up long-term interest rates in the USA.
  2. Encourage the Fed to adopt a hawkish stance, shrinking its balance sheet (QT) and raising interest rates. Lower inflation and a stronger Dollar would restore investor confidence in Treasuries. But the risk is that the US plunges into recession which would make the debt problem even worse. Tax revenues would fall during a recession, increasing the fiscal deficit.

It appears that the Fed are attempting to walk a fine line between the two options at present, talking tough but delaying action for as long as possible, but later this year, they will be forced to show their hand.

China

Rising US interest rates and the strong Dollar are a major problem for China. Not only is the strong Dollar undermining Chinese businesses who borrowed in USD at cheap rates, but the strong Dollar also threatens to collapse China’s $5 trillion Belt-and-Road initiative which is funded by USD-denominated loans. Despite official statistics, the country is in a heap of pain. The private sector has never fully-recovered from the initial COVID-19 pandemic and is now being dragged down by Xi Jinping’s zero-Covid policy lockdowns. Ports are in gridlock.

Chinese Ports

Falling natural gas consumption warns of an economic contraction, promising further disruption to commodity producers and supply chains around the world.

Chinese LNG Demand

Team USA

This may be an over-simplification but “team USA” — to use Michael Every’s expression — is primarily split into two camps:

  1. Wall Street and the Federal Reserve, who want to maintain the US Dollar position as the global reserve currency; and
  2. The Department of Defense (DOD) and the manufacturing sector, who recognize the damage done by the Dollar reserve currency, with erosion of the US industrial base and offshoring of critical supply chains.

Weaponizing the Dollar against Russia, by seizing their foreign reserves, was apparently a DOD initiative, with the Fed not even consulted. The outcome is likely to be long-term damage to the Dollar’s reserve currency status, with non-aligned states — including China and India — increasingly reluctant to hold reserve assets in Dollars.

There are no ready alternatives to the Dollar — as Michael Every points out — but other asset classes, including Gold and Commodities, are likely to play an increasingly larger role.

Conclusion

Credit markets are tightening and warn of a recession. The Fed is unlikely to continue its hawkish stance if credit markets dry up or employment falls.

It is not in the US interest to continue running large current account deficits to support the Dollar’s reserve status. The economy has suffered long-term damage from its “exorbitant privilege” with the US Dollar as reserve currency. Support for the Dollar’s reserve status, from Wall Street, faces growing opposition from the DOD and manufacturing sector.

The US faces a tough choice between debt and inflation. A hawkish Fed may lower inflation but is likely to cause a recession, making the debt situation even worse. A dovish Fed, on the other hand, with higher inflation, may alleviate the debt problem but is likely to undermine foreign investor confidence in the Dollar and Treasuries.

The situation is further exacerbated by current market turmoil. The strong Dollar threatens to damage China’s economy and its Belt-and-Road initiative, raising tensions with the US. Weaponization of the Dollar in sanctions against Russia also threatens to undermine the Dollar’s reserve currency status.

Rising interest rates and a strong Dollar are bearish for Gold, but there are a number of developments that suggest the opposite. We remain overweight on Gold.

Acknowledgements

  • Tom Mclellan for the Unemployment/Consumer Sentiment comparison
  • Frankoz for the BRI insight
Colin Twiggs

Colin Twiggs is a former investment banker with almost 40 years of experience in financial markets. He co-founded Incredible Charts and writes the popular Trading Diary and Patient Investor newsletters.

Using a top-down approach, Colin identifies key macro trends in the global economy before evaluating selected opportunities using a combination of fundamental and technical analysis.

Focusing on interest rates and financial market liquidity as primary drivers of the economic cycle, he warned of the 2008/2009 and 2020 bear markets well ahead of actual events.
He founded PVT Capital (AFSL No. 546090) in May 2023, which offers investment strategy and advice to wholesale clients.

Posted on August 6, 2021August 6, 2021

Australian economy: Gold medal or wooden spoon?

A quick health check from the RBA chart pack:

Our trade balance is in robust good health.

Australia: Current Account

Boosted by record high iron ore prices. Sadly, this is nearing an end.

Australia: Exports

On the domestic front, we have a decent chance of a bronze medal placing for the biggest housing bubble. But Canada, UK and NZ are vying for gold.

Australia: Housing

While on the business front, we are competing for the wooden spoon, with the lowest investment rate since the early ’90s.

Australia: Current Account

Conclusion

Economic policy is completely cock-eyed. We are driving up prices in an already over-heated housing market — in an attempt to generate short-term jobs — a ponzi scheme that puts the entire financial system at risk. And starving the one sector that has the potential to generate jobs and grow GDP, ensuring long-term stability.

Colin Twiggs

Colin Twiggs is a former investment banker with almost 40 years of experience in financial markets. He co-founded Incredible Charts and writes the popular Trading Diary and Patient Investor newsletters.

Using a top-down approach, Colin identifies key macro trends in the global economy before evaluating selected opportunities using a combination of fundamental and technical analysis.

Focusing on interest rates and financial market liquidity as primary drivers of the economic cycle, he warned of the 2008/2009 and 2020 bear markets well ahead of actual events.
He founded PVT Capital (AFSL No. 546090) in May 2023, which offers investment strategy and advice to wholesale clients.

Posted on March 27, 2018June 11, 2019

Trump’s Trade War

First, let me correct the implication that this is a trade war started by Donald Trump. It is not. His is only the first significant response by the US in a trade war initiated by China more than a decade ago, in the early 2000s.

In 2011 I warned of the danger of a trade war in Five Challenges facing President Obama:

…1. Stop importing capital and exporting jobs.
Japan and China have effectively maintained a trade advantage against the US by investing more than $2.3 trillion in US Treasuries. The inflow of funds on capital account acts to suppress their exchange rate, effectively pegging it against the greenback. Imposition of trade penalties would result in tit-for-tat retaliation that could easily escalate into a trade war….

In Mega-trends and their impact in 2012:

Trade wars
In addition to competition for scarce resources, we are also likely to see increased competition for international trade. Resistance to further currency manipulation — initiated by Japan in the 1980s and perpetuated by China in the last decade — is likely to rise. US Treasury holdings by China and Japan currently sit at more than $2.3 Trillion, the inflows on capital account being used to offset outflows on current account and maintain a competitive trade advantage by suppressing their exchange rate.

In China’s Export Dilemma 2014:

…China has been buying US Treasuries as a form of vendor financing, allowing them to export to the US while preventing the RMB from appreciating to its natural, market-clearing level against the Dollar. The fact that they are attempting to disguise this manipulation, using third parties, means that Congress is unlikely to tolerate further suppression of the RMB against the Dollar and will be forced to take action.

And in 2015, Sectoral Imbalances: Where Have All the Jobs Gone?

A second threat is foreign capital inflows… which commenced in earnest with Japanese purchases of US Treasuries in the 1980s but reached a ‘nuclear’ scale when China joined the party in the early 2000s. While it may appear fairly benign, with foreign investors stepping in to lend Uncle Sam a helping hand, the damage is insidious… these capital inflows were intended to undermine the competitiveness of US manufacturers in both domestic and export markets through currency manipulation.

Foreign Direct Investment in US

To understand how currency manipulation works, we need to examine the foreign surplus in more detail. There are two parts to currency flows between nations: the current (income) account and the capital account. The current account comprises the trade surplus or deficit (the net sum of all trade flows between the two nations) and the smaller net income flow from investments.

Current Account Balance

The capital account reflects all capital flows, whether investment or loans, between the two countries. Again, the sum of the two is always zero. If there is a deficit on the current account (money flowing out), there must be a surplus on the capital account (loans and investments flowing in) to restore the balance. If not, and Japan/China had to increase their exports to the US without a reciprocal flow of capital, the value of the dollar would plummet against the yen/yuan until the trade balance was restored.

Think of it this way. If an importer in the US buys goods from China, they must purchase yuan to pay for the goods. If there are more imports than exports, the demand for yuan will be higher than demand for dollars; so the yuan will rise against the dollar until demand matches supply. But what currency manipulators do is invest money via capital account (mainly in US Treasuries), purchasing dollars to soak up the shortfall so that their currency doesn’t appreciate despite the massive trade surplus with the US.

The impact of this is two-fold. First US manufacturers shed jobs as they lose market share in both domestic and export markets. That cuts into the household surplus as unemployment rises and real wages fall. Second, the US government runs bigger deficits to make up for the demand shortfall in order to buoy economic growth. The end result is that US taxpayers grow poorer — as the size of the public debt millstone increases — while currency manipulators grow richer. The debt binge that led to the GFC was largely fueled by foreign capital inflows. The fact that this imbalance has been allowed to continue is a damning indictment of political leadership in Washington. There is no way that they can be unaware of the damage being caused to US manufacturers, households and to public finances. Change is long overdue.

Why has it taken this long to respond?

The last incumbent in the White House refused to confront the rising menace. A risk-averse culture led to micro-management and Obama’s mantra of “Don’t do stupid sh*t” frequently translated into “Don’t do anything”.

On Obama’s watch the US abdicated its global leadership, leaving the door open for scoundrels like Vladimir Putin and Xi Jinping to step into the void. His legacy is a series of brewing crises that risk a major global confrontation in the next few decades. Taiwan and the South China Sea, India and Pakistan, North Korea, Iran and Saudi Arabia, Yemen, Syria, Ukraine, the Balkans, and the Baltic States. All of these hotspots have the potential to spark a major conflict. It needs just a single miscalculation from an emboldened aggressor accustomed to being able to bully their neighbors into acquiescence.

All this seems eerily familiar. As Winston Churchill long ago warned:

An appeaser is one who feeds a crocodile, hoping it will eat him last.

But back to Donald Trump.

To his credit Trump correctly identified the need to confront the growing threat.

Unfortunately he is not up to the task.

His confrontational style may have worked well when nailing down contractors on construction contracts, or even negotiating media contracts for his show, but is totally unsuited for the role of a leader of the free world.

Trump’s campaign style has left a fiercely divided political landscape, with little support in the mainstream media and even a large swathe of Republicans shocked and embarrassed by his behavior. He has zero chance of uniting the country behind him in confronting these major challenges. His erratic behavior means the Republican party is likely lose control of the House of Representatives at the upcoming mid-term elections, leaving Trump as a lame duck President.

What he does not seem to realise is that belittling treatment of senior officials in his own administration diminishes him in the eyes of subordinates and demoralises his remaining team. It also makes it exceedingly difficult for him to attract new talent.

Internationally, Trump has managed to offend many of America’s traditional allies and is also unlikely to receive much support or understanding from that quarter.

Fortunately the President has been unable to derail the US economy which I suspect will be able to weather the current storm as it has many others. The political mess will continue while the economy keeps on going.

When it comes to stocks, the S&P 500 index is headed for a test of primary support between 2500 and 2550. Breach would signal a primary down-trend but Twiggs Volatility Index is currently in the amber zone, between 1% and 2%, suggesting that the correction is secondary in nature.

S&P 500

From Market Volatility and the S&P 500 in February 2018:

The key is not to wait for Volatility to spike above 2%. By then it is normally too late. An alternative strategy would be to scale back positions when the market remains in an elevated range, between 1% and 2%, over several months. Many traders would argue that this is too early. But the signal does indicate elevated market risk and I am reasonably certain that investors with large positions would prefer to exit too early rather than too late.

My current policy is to maintain 30% cash in our model portfolio (this may not suit investors with different risk profiles) and I am only likely to increase this for US investments if there is a fall below 2500 or Twiggs Volatility remains elevated (above 1%) for at least 3 months. But I am likely to review our cash position for Australian investments in the weeks ahead.

When liberty exceeds intelligence, it begets chaos, which begets dictatorship.

~ Will Durant

Colin Twiggs

Colin Twiggs is a former investment banker with almost 40 years of experience in financial markets. He co-founded Incredible Charts and writes the popular Trading Diary and Patient Investor newsletters.

Using a top-down approach, Colin identifies key macro trends in the global economy before evaluating selected opportunities using a combination of fundamental and technical analysis.

Focusing on interest rates and financial market liquidity as primary drivers of the economic cycle, he warned of the 2008/2009 and 2020 bear markets well ahead of actual events.
He founded PVT Capital (AFSL No. 546090) in May 2023, which offers investment strategy and advice to wholesale clients.

Posted on February 23, 2018

Why is the Dollar falling?

The broad, trade-weighted US Dollar index has been declining since early 2017.

US Dollar Index - Broad and Major Trading Partners

This is the best explanation I have found for current US Dollar weakness. From Bank of Montreal, BMO Nesbitt Burns:

The relationship isn’t perfect, but as a general rule of thumb, the USD declines in years when global growth is above potential. In such years, strong global growth causes commodity prices to rise, which lifts commodity currencies. In addition, strong global growth normally triggers a flood of investment out of developed economies and into emerging economies. As emerging central banks intervene to slow the appreciation of their currencies from these two factors, they sell the USD against EUR and other alternative reserve currencies, thereby causing the USD to decline against both developed and emerging currencies. That dynamic helps explains the USD depreciation in 2017 as well as the 2004-2007 period. The 10Y average of the IMF’s World GDP growth rate is 3.4% and we think that is roughly potential growth. The IMF estimates that global growth will come in at about 3.6% for 2017 and accelerate to 3.7% in 2018.

In addition, the US’s twin deficit fundamental (sum of the current account deficit and fiscal or federal budget deficit as shares of GDP) is another factor that is negative for the USD. Turns in the twin deficit normally precede turns in the USD by 1-2 years and then trends match thereafter. The US’s twin deficit fundamental has been deteriorating for the past two years and is likely to deteriorate further in 2018 and beyond due in part to the tax cuts. When looking at all these factors together with the fact that USD phases tend to last 5-7 years, we feel that we have to forecast a continuation of broad USD weakness—albeit at a slower pace. We project that the broad USD index will fall 1.5% in Q1 and then 1.0% per quarter in each of the remaining three quarters of 2018.

Hat tip to David Llewellyn-Smith at Macrobusiness.

The fall in the Dollar may also be self-reinforcing, as Enda Curran at Bloomberg highlights:

…..On top of the boost already coming from robust global GDP growth, the dollar’s fall over the past year may add over 3 percent to the level of world trade, according to Gabriel Sterne, global head of macro research at Oxford Economics Ltd. Tipping further dollar weakness, the risks are skewed to the upside for Oxford’s baseline forecast for 5 percent growth in world trade in 2018.

“Falls in the value of the dollar oil the wheels of the global financial system, boosting global liquidity by strengthening balance sheets and alleviating currency mismatches,” Sterne wrote in a note. “One important channel is variation in the differential between the cost of raising dollars onshore and offshore. Dollar weakness reduces the cross-currency basis, increases cross-border lending and boosts bank equities.”

The biggest winners will likely be emerging economies given the weaker dollar will lower the value of their dollar-denominated debt, taking pressure off their balance sheets and from credit conditions more generally…..

Finally, from Deutsche Bank (again hat tip to David):

How can it be that US yields are rising sharply, yet the dollar is so weak at the same time? The answer is simple: the dollar is not going down despite higher yields but because of them. Higher yields mean lower bond prices and US bonds are lower because investors don’t want to buy them. This is an entirely different regime to previous years.

Dollar weakness ultimately goes back to two major problems for the greenback this year. First, US asset valuations are extremely stretched. As we argued in our 2018 FX outlook a combined measure of P/E ratios for equities and term premia for bonds is at its highest levels since the 1960s. Simply put, US bond and equity prices cannot continue going up at the same time. This correlation breakdown is structurally bearish for the dollar because it inhibits sustained inflows into US bond and equity markets.

The second dollar problem is that irrespective of asset valuations the US twin deficit (the sum of the current account and fiscal balance) is set to deteriorate dramatically in coming years. Not only does the additional fiscal stimulus recently agreed by Congress push the fair value of bonds even lower via higher issuance and inflation risk premia effects, but the current account that also needs to be financed will widen via import multiplier effects. When an economy is stimulated at full employment the only way to absorb domestic demand is higher imports. Under conservative assumptions the US twin deficit is set to deteriorate by well over 3% of GDP over the next two years.

US Current Account Deficit

In summary:

  1. Rising global growth boosts commodity prices and emerging markets
  2. Central banks in emerging markets then sell Dollars to slow appreciation of their local currency
  3. Fiscal stimulus, such as US tax cuts and infrastructure spending, lifts inflation
  4. Higher inflation causes a bond bear market
  5. Fiscal stimulus also widens the current account deficit
  6. Central bank selling, higher inflation, a bond bear market and wider current account deficits all cause a weaker Dollar
Colin Twiggs

Colin Twiggs is a former investment banker with almost 40 years of experience in financial markets. He co-founded Incredible Charts and writes the popular Trading Diary and Patient Investor newsletters.

Using a top-down approach, Colin identifies key macro trends in the global economy before evaluating selected opportunities using a combination of fundamental and technical analysis.

Focusing on interest rates and financial market liquidity as primary drivers of the economic cycle, he warned of the 2008/2009 and 2020 bear markets well ahead of actual events.
He founded PVT Capital (AFSL No. 546090) in May 2023, which offers investment strategy and advice to wholesale clients.

Posted on October 22, 2015

How we got here

If we don’t learn from the mistakes of the past we will be destined to repeat them (George Santayana). Looking back over the last three decades gives an inkling as to what went wrong and to the level of economic mismanagement.

International trade is a zero sum game: what one country exports, another must import. Likewise, current accounts between nations are a zero-sum game: if one country runs a surplus, another will experience a deficit. Fortunately currency exchange rates act as an automatic stabilizer. If one country exports more than another, its currency will strengthen to the point that balance is restored in the level of trade between the two nations.

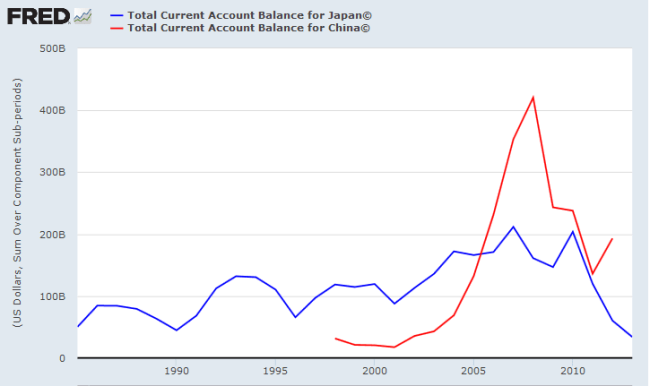
At least that is how it is supposed to work. Over the last three decades, Japan followed by China, has been rorting the system [translation: engage in a sharp practice (Australian/NZ)]. Accumulation of massive foreign reserves (e.g. by buying US Treasuries) prevented their currencies from appreciating and allowed them to maintain massive current account imbalances.

Current Accounts China & Japan

These beggar-thy-neighbor policies built up massive imbalances within the US economy.

Current Account USA

Which led to the global financial crisis, the Great Recession, the sovereign debt crisis in Europe, the subsequent emerging markets crisis and extended slow recovery we are now experiencing.

North America

The S&P 500 continues to test support at 2000. Failure would warn of another test of support at 1870, but respect is more likely and would indicate another test resistance at the high of 2130. Troughs above zero on 13-week Twiggs Money Flow indicate continued buying pressure. The overall trend remains bearish, however, having broken primary support at 2000. Respect of resistance at 2130 would warn of another test of support at 1870.

S&P 500 Index

* Target calculation: 2000 + ( 2000 – 1870 ) = 2130

The CBOE Volatility Index (VIX) has declined to below 20. A peak below this level (20) would confirm that market risk is easing.

S&P 500 VIX

NYSE short sales remain subdued.

NYSE Short Sales

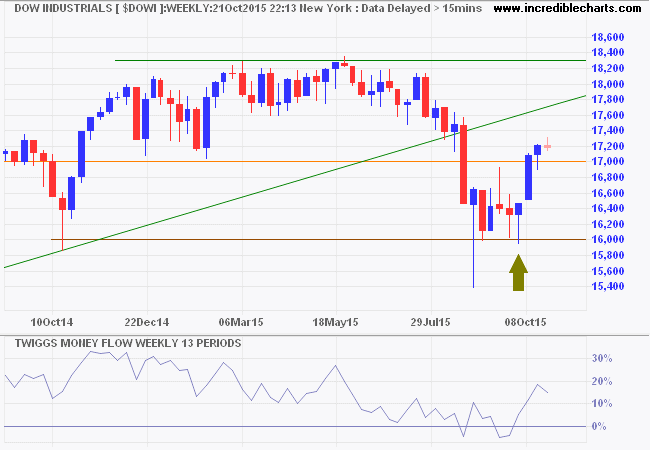
Dow Jones Industrial Average is similarly testing support at 17000, with 13-week Twiggs Money Flow holding above zero.

Dow Jones Industrial Average

Canada’s TSX 60 is testing support at 800. Breach would warn of another decline, while follow-through below 775 would confirm. Weak 13-week Twiggs Momentum, below zero, indicates the market remains bearish.

TSX 60 Index

* Target calculation: 775 – ( 825 – 775 ) = 725

Europe

Germany’s DAX respected support at 10000 and 13-week Twiggs Money Flow recovered above zero. Recovery above 10500 is likely and would indicate a bear rally to 11000.

DAX

The Footsie continues to test support at 6250. Respect is more likely and recovery above the descending trendline and resistance at 6500 would suggest another test of 7000. 13-Week Twiggs Money Flow holding above zero indicates long-term buying pressure. Reversal below 6000 is unlikely, but would confirm the primary down-trend.

FTSE 100

Asia

The Shanghai Composite Index respected resistance at 3500 and is likely to re-test government-backed support at 3000.

Dow Jones Shanghai Index

Hong Kong’s Hang Seng Index is expected to retrace to test support at 22500 after a similar bear rally. Rising 13-week Twiggs Money Flow indicates medium-term buying pressure. Respect of 22500 would indicate another test of 24000, but breach of support is as likely and would warn of another test of primary support at 21000.

Hang Seng Index

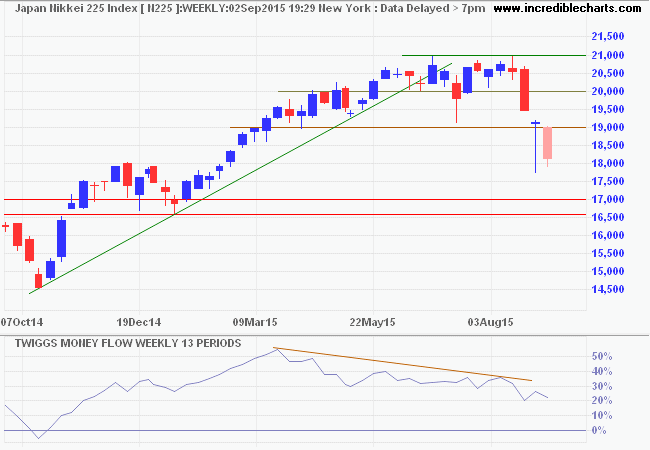
Japan’s Nikkei 225 also signals medium-term buying pressure on 13-week Twiggs Money Flow. Breakout above resistance at 18500 would suggest an advance to 21000; follow-through above 19000 would confirm.

Nikkei 225 Index

* Target calculation: 19000 + ( 19000 – 17000 ) = 21000

India’s Sensex displays the strongest buying pressure, with rising 13-week Twiggs Money Flow troughs above zero. Respect of support at 26500 indicates continuation of the rally. Penetration of the descending trendline would suggest an advance to 30000; follow-through above 28500 would confirm. Reversal below 26000 remains unlikely, but would confirm a primary down-trend.

SENSEX

Australia

The ASX 200 threatens to break resistance at 5300, with rising 13-week Twiggs Money Flow indicating medium-term buying pressure. Breakout above 5300 would signal a test of the descending trendline. The bear market, however, continues despite recent support and breach of 5000 would confirm a primary down-trend.

ASX 200

* Target calculation: 5000 – ( 5400 – 5000 ) = 4600

The biggest mistake in investing is believing the last three years is representative of what the next three years is going to be like.

~ Ray Dalio, Bridgewater Associates

Posted on September 3, 2015April 18, 2024

The illusion of unstoppable Chinese growth

Throughout history, from Dutch tulips to South Sea investments, investors experiencing a bubble have refused to believe that it will end. Forecasters with the temerity to suggest otherwise were attacked and ridiculed. Denial is a powerful emotion.

The last three decades have been no different, as we moved through a succession of bubbles: from Japan in 1989/90, to the 1997/98 Asian crisis, to the Dotcom crash in 2000/01, and the GFC in 2007/08. All had the same primary cause: state interference with two major pricing mechanisms that allow markets to clear. Central bank suppression of interest rates fueled rapid debt growth and forced investors to assume greater risk in order to achieve a viable return, building huge imbalances within the economy. Suppression of exchange rates through accumulation of vast foreign reserves, primarily foreign debt, has also been used by emerging economies such as China to boost exports and maintain a current account surplus. But this ignores the inevitable feedback loop that results.

China’s and other emerging markets current account surpluses caused the US to suffer a persistent current account deficit.

US Current Account Deficit

The effect on the US is twofold. First, a persistent current account deficit hurts economic growth. Second, foreign purchases of US debt suppress long-term interest rates. Like most central banks, the Fed preferred to address the symptoms (falling growth and rising unemployment) rather than address the underlying cause (if your only tool is a hammer then every problem starts to resemble a nail). Fed suppression of interest rates created a wash of easy money looking for a return. A large chunk of this flowed into China and other emerging markets — primarily as credit to domestic borrowers — taking advantage of low interest rates in the US and higher yields in these rapidly growing economies, while enjoying the protection of a currency pegged to the Dollar.

Now that the Fed is making noises about raising interest rates, margins are likely to be squeezed and the currency peg appears vulnerable. Recent capital outflows forced China to devalue the Yuan. But devaluation is likely to fuel further outflows. Supporting the currency — purchasing Yuan using China’s more than $4 trillion of foreign reserves — may appear a simple solution but that contracts the amount of money in circulation, threatening deflation.

Attempts to stem the outgoing tide are likely to sap confidence and exacerbate the problem. China and other emerging markets can expect a hard landing. US and European markets survived the crises of 1989/90 and 1997/98 but global economies are now far more intertwined. I prefer to err on the side of caution.

North America

The S&P 500 respected the new resistance level at 2000, suggesting that the rally has failed. Wednesday’s blue harami candle offers feint hope of a reversal, but the overriding trend is downward. Rising short sales warn of increased selling pressure. Recovery above 2000 is unlikely but would offer hope of a relieving rally. Breach of short-term support at 1900 would suggest another decline, while failure of 1870 would confirm.

S&P 500 Index

* Target calculation: 1900 – ( 2000 – 1900 ) = 1800

The CBOE Volatility Index (VIX) continues to indicate elevated market risk.

S&P 500 VIX

Dow Jones Industrial Average is in a similar position to the S&P 500. Breach of support at 16000 would confirm a primary down-trend. Recovery above 17000 is less likely, but would signal buying pressure.

Dow Jones Industrial Average

Canada’s TSX 60 rallied above resistance at 800 but has since reversed. Follow-through below say 790 would confirm the primary down-trend. Declining 13-week Twiggs Momentum below zero continues to warn of a down-trend. Recovery above 820 is less likely but would indicate buying pressure.

TSX 60 Index

* Target calculation: 800 – ( 900 – 800 ) = 700

Europe

Germany’s DAX recovered above support at 10000. Follow-through above last week’s candle at 10500 would indicate a rally to test the descending trendline. Respect of the zero line by 13-week Twiggs Money Flow indicates medium-term buying pressure. Reversal below 10000 is less likely, but would warn of a primary down-trend.

DAX

The Footsie is testing primary support at 6100. Reversal below that level would confirm a primary down-trend, while recovery above 6250 would indicate a rally to test 6500. Respect of the zero line by 13-week Twiggs Money Flow again indicates medium-term support.

FTSE 100

Asia

Chinese markets are closed Thursday and Friday for the World War II 70th Anniversary. The Shanghai Composite index is testing support at 3000. Intervention to support the market is unlikely to succeed. Reversal of 13-week Twiggs Money Flow below zero would confirm a primary down-trend.

Dow Jones Shanghai Index

Hong Kong’s Hang Seng Index gives a clearer picture of investor sentiment without government intervention. Breach of support at 22500 and declining 13-week Twiggs Money Flow (below zero) both signal a primary down-trend. Failure of the next level of support at 21000 further strengthens the signal.

Dow Jones Shanghai Index

* Target calculation: 440 – ( 550 – 440 ) = 330

Japan’s Nikkei 225 retreated below support at 19000 and is likely to test primary support at 17000. The gradual decline of 13-week Twiggs Money Flow indicates medium-term selling pressure — more a secondary correction than a primary reversal.

Nikkei 225 Index

* Target calculation: 19000 – ( 21000 – 19000 ) = 17000

India’s Sensex retreated below 26000, confirming a primary down-trend. Reversal of 13-week Twiggs Money Flow below zero would further strengthen the signal.

SENSEX

* Target calculation: 27000 – ( 30000 – 27000 ) = 24000

Australia

The ASX 200 is testing key support at 5000. Respect of the zero line (from below) on 21-day Twiggs Money Flow indicates selling pressure. Breach of 5000 is likely and would confirm a primary down-trend. Respect is unlikely, but would indicate another test of medium-term resistance at 5300.

ASX 200

* Target calculation: 5000 – ( 5400 – 5000 ) = 4600


More….

NYSE short selling rises

If we don’t understand both sides of China’s balance sheet, we understand neither | Michael Pettis

Volatile crude

China: It just got worse

S&P 500: Dead cat bounce?

China’s conundrum: Capital flight or deflation

There is a theory which states that if ever anyone discovers exactly what the Universe is for and why it is here, it will instantly disappear and be replaced by something even more bizarre and inexplicable.

There is another theory which states that this has already happened.

~ Douglas Adams: Hitchhiker’s Guide to the Galaxy

Posted on August 22, 2015

George Soros: Regulation of global financial markets

It is time to recognize that financial markets are inherently unstable. Imposing market discipline means imposing instability, and how much instability can society take? …. To put it bluntly, the choice confronting us is whether we will regulate global financial markets internationally or leave it to each individual state to protect its interests as best it can. The latter course will surely lead to the breakdown of the gigantic circulatory system, which goes under the name of global capitalism.

~ George Soros: The Crisis of Global Capitalism (1998)

Posted on August 22, 2015

China’s dangerous currency manipulation

I am surprised at John Mauldin’s view in his latest newsletter Playing the Chinese Trump Card:

….This whole myth that China has purposely kept their currency undervalued needs to be completely excised from the economic discussion. First off, the two largest currency-manipulating central banks currently at work in the world are (in order) the Bank of Japan and the European Central Bank. And two to four years ago the hands-down leading manipulator would have been the Federal Reserve of the United States.

John is correct that China has in recent years engaged in less quantitative easing than Japan, Europe and the US. And these activities are likely to weaken the respective currencies. But what he ignores is that these actions are puny compared to the $4.5 Trillion in foreign reserves that China has accumulated over the last decade. That is almost 2 years of goods and services imports — far in excess of the 3 months of imports considered prudent to guard against trade shocks. Arthur Laffer highlights this in his recent paper Currency Manipulation and its Distortion of Free Trade:

Foreign Reserves

Accumulation of excessive foreign reserves is the favored technique employed by China, and Japan before that, to suppress currency appreciation over the last three decades. Dollar outflows through capital account, used to purchase US Treasuries and other quality government and quasi-government debt, are used to offset dollar inflows from exports. This allows the exporting state to maintain a prolonged trade imbalance without substantial appreciation of their currency. And forces the target (US) to sustain a prolonged trade deficit to offset the capital inflows. Laffer sums up currency manipulation as:

….. when a country either purchases or sells foreign currency with the intent to move the domestic currency away from equilibrium or to prevent it from moving towards equilibrium.

Even Paul Krugman (whose views I seldom agree with) has been wise to the problem for at least 5 years:

…..economist Paul Krugman and a group of senators led by New York Democrat Chuck Schumer wanted to impose a 25% tariff on Chinese imports.

Prolonged current account imbalances cause instability in global financial markets. A sustained US current account deficit was one of the primary weaknesses cited by Nouriel Roubini in his forecasts of the 2008 financial crisis (the other side of the equation was a sustained Chinese surplus). But currency manipulation is not only dangerous, it is also short-sighted. International trade is a zero-sum game. For every dollar of goods, services, capital or interest that goes out, a dollar of goods, services, capital or interest must come in. For every country that runs a current account surplus, another must run a deficit. Without international regulation, each country will try to engineer a trade surplus in order to boost their domestic economy at the expense of their trade partners. An endless game of beggar-thy-neighbor.

Participants will suffer long-term consequences. The power of financial markets is unstoppable. Central banks attempt to hold back the tide, distorting price signals and shoring up surpluses (or deficits), at their peril. The market will have its way and restore equilibrium in the long term. As Japan in the 1990s and Switzerland recently experienced, the further you move markets away from equilibrium the more powerful the opposing backlash will be. The scale of China’s market manipulation is unprecedented, and caused large-scale distortions in the US. The end result forced the Fed to embark on unprecedented quantitative easing which, in turn, is now impacting back on China.

The impact will not only be felt by China, as John points out:

The low rates and massive amounts of money created by quantitative easing in the US showed up in emerging markets, pushing down their rates and driving up their currencies and markets. Just as [governor of the Central Bank of India, Raghuram Rajan] (and I) predicted, once the quantitative easing was taken away, the tremors in the emerging markets began, and those waves are now breaking on our own shores. The putative culprit is China, but at the root of the problem are serious liquidity problems in emerging markets. China’s actions just heighten those concerns.

Chinese hopes for a soft landing are futile.

Posts pagination

Page 1 Page 2 Next page

Login for the latest Market Analysis

  • ASX Weekly Market Indicators
  • US Weekly Market Indicators
  • ASX Weekly Market Indicators
  • Blow-off or buy the dip?
  • Gold bear trap
  • ASX Weekly Market Snapshot
  • US Weekly Market Snapshot
  • Give War a Chance | Edward Luttwak
  • ASX Weekly Market Snapshot
  • US Weekly Market Snapshot
  • Inflation, the third certainty
  • Fed sits tight as economic outlook darkens
  • Gold rises to a new high while Dow and ASX 200 retreat
  • Bear market confirmed
  • Loaded for bear
  • How tariffs could break America
  • Why Australian CPI is understated
  • Regime change in America
  • ASX Weekly Market Snapshot
  • Strong uptrends in stocks and gold
  • Big Picture reading: Ukraine
  • Gold headed for $3,000
  • Inflation spooks Treasuries and stocks
  • US Weekly Market Snapshot
  • Gold riding high as the Dollar weakens
  • Japanese inflation bullish for US stocks
  • Threat of a US-China trade war boosts gold
  • Tariff Pause
  • Fed takes a pause
  • The long game: The Dollar, Gold and US Treasuries

Topics

Disclaimer

Everything contained in this web site, related newsletters, emails, discussions, training videos and conferences (collectively referred to as the “Material”) is intended for the purpose of teaching analysis, trading and investment techniques. Advice in the Material is provided for the general information of readers and viewers (collectively referred to as “Reader/s”) and does not have regard to any particular person’s investment objectives, financial situation or needs. Accordingly, no Reader should act on the basis of any information in the Material without properly considering its applicability to their financial circumstances. If not properly qualified to do this for themselves, Readers should seek professional advice.

Investing and trading involves risk of loss. Past results are not necessarily indicative of future results.

The decision to invest or trade is for the Reader alone. We expressly disclaim all and any liability to any person, with respect of anything, and of the consequences of anything, done or omitted to be done by any such person in reliance upon the whole or any part of the Material.

© Copyright 2016 - 2025 The Patient Investor Pty Ltd. All rights reserved.
Powered by WordPress / WordPress Maintenance Service By Website Helper