Is GDP doomed to low growth?

GDP failed to rebound after the 2008 Financial Crisis, sinking into a period of stubborn low growth. Economic commentators have advanced many explanations for the causes, while the consensus seems to be that this is the new normal, with the global economy destined to decades of poor growth.

Real GDP Growth

This is a classic case of recency bias. Where observers attach the most value to recent observations and assume that the current state of affairs will continue for the foreseeable future. The inverse of the Dow 100,000 projections during the Dotcom bubble.

Real GDP for Q1 2018 recorded 2.9% growth over the last 4 quarters. Not exactly shooting the lights out, but is the recent up-trend likely to continue?

Real GDP Growth and estimate based on Private Sector Employment and Average Weekly Hours Worked

Neils Jensen from Absolute Return Partners does a good job of summarizing the arguments for low growth in his latest newsletter:

The bear story

Putting my (very) long-term bearishness on fossil fuels aside for a moment, there is also a bear story with the potential to unfold in the short to medium-term, but that bear story is a very different one. It is a story about GDP growth likely to suffer as a consequence of the oil industry’s insatiable appetite for working capital, which is presumably a function of the low hanging fruit having been picked already.

In the US today, the oil industry ties up 31 times more capital per barrel of oil produced than it did in 1980, when we came out of the second oil crisis. ….Such a hefty capital requirement is a significant tax on economic growth. Think of it the following way. Capital is a major driver of productivity growth, which again is a key driver of economic growth. Capital tied up by the oil industry cannot be used to enhance productivity elsewhere, i.e. overall productivity growth suffers as more and more capital is ‘confiscated’ by the oil industry.

I am tempted to remind you (yet again!) of one of the most important equations in the world of economics:

∆GDP = ∆Workforce + ∆Productivity

We already know that the workforce will decline in many countries in the years to come; hence productivity growth is the only solution to a world drowning in debt, if that debt is to be serviced. Why? Because we need economic growth to be able to service all that debt.

Now, if productivity growth is going to suffer for years to come, all this fancy new stuff that we all count on to save our bacon (advanced robotics, artificial intelligence, etc.) may never be fully taken advantage of, because the money needed to make it happen won’t be there. It is not a given but certainly a risk that shouldn’t be ignored.

….For that reason, we need to retire fossil fuels as quickly as possible. Ageing of society (older workers are less productive than their younger peers) and a global economy drowning in debt (servicing all that debt is immensely expensive, leaving less capital for productivity enhancing purposes) are widely perceived to be the two most important reasons why productivity growth is so pedestrian at present.

I am not about to tell you that those two reasons are not important. They certainly are. However, the adverse impact the oil industry is having on overall productivity should not be underestimated.

I tend to take a simpler view, where I equate changes in GDP to changes in hours worked and in capital investment:

∆GDP = ∆Workforce + ∆Capital

Workers work harder if they are motivated or if there is a more efficient organizational structure, but these are a secondary influence on productivity when compared to capital investment.

The chart below compares net capital formation by the corporate sector (over GDP) to real GDP growth. It is evident that GDP growth rises and falls in line with net capital formation (or investment as it is loosely termed) by corporations.

Net Capital Formation by the corporate sector/GDP compared to Real GDP Growth

A quick primer (with help from Wikipedia):

  • Capital Formation measures net additions to the capital stock of a country.
  • Capital refers to physical (or tangible) assets and includes plant and equipment, computer software, inventories and real estate. Any non-financial asset used in the production of goods or services.
  • Capital does not include financial assets such as bonds and stocks.
  • Net Capital Formation makes allowance for depreciation of the existing capital stock due to wear and tear, obsolescence, etc.

Net Capital Formation peaked at around 5.0% from the mid-1960s to the mid-1980s, made a brief recovery to 4.0% during the Dotcom bubble and has since struggled to make the bar at 3.0%. Rather like me doing chin-ups.

Net Capital Formation Declining in the Corporate Sector

There are a number of factors contributing to this.

Intangible Assets

Capital formation only measures tangible assets. The last two decades have seen a massive surge in investment in intangible assets. Look no further than the big five on the Nasdaq:

Stock Symbol Price ($) Book Value ($) Times Book Value
Amazon AMZN 1582.26 64.85 24.40
Microsoft MSFT 95.00 10.32 9.21
Facebook FB 173.86 26.83 6.48
Apple AAPL 169.10 27.60 6.12
Alphabet GOOGL 1040.75 235.46 4.42

Currency Manipulation

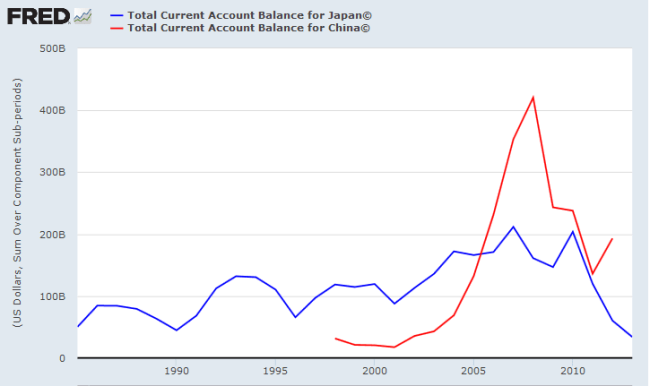
Capital formation first fell off the cliff in the 1980s. This coincides with the growth of currency manipulation by Japan, purchasing excessive US foreign reserves to suppress the Yen and establish a trade advantage over US manufacturers. China joined the party in the late 1990s, exceeding Japan’s current account surplus by 2006. Currency suppression creates another incentive for corporations to offshore or outsource manufacturing to Asia.

China & Japan Current Account Surpluses

Tax on Offshore Profits

Many large corporations took advantage of low tax rates in offshore havens such as Ireland, avoiding US taxes while the funds were held offshore. This created an incentive for large corporations to invest retained earnings offshore rather than in the USA.

The net effect has been that retained earnings are invested elsewhere, while new capital formation in the USA is almost entirely funded by debt.

Net Capital Formation by the corporate sector/GDP compared to Corporate Debt Growth/GDP

Donald Trump’s tax deal will make a dent in this but will not undo past damage. The horse has already bolted.

Offshore Manufacturing

Apart from tax incentives, lower labor costs (enhanced by currency manipulation) led large corporations to set up or outsource manufacturing to Asia and other developing countries. In effect, offshoring capital formation and — more importantly — GDP growth to foreign destinations.

Offshoring Jobs

Along with manufacturing plants, blue-collar jobs also moved offshore. While this may improve the company bottom-line for a few years, the long-term, macro effects are devastating.

Think of it this way. If you build a manufacturing plant offshore rather than in the USA you may save millions of dollars a year in labor costs. Great for the bottom line and executive bonuses. But one man’s wage is another man/woman’s income (when he/she spends it). So, from a macro perspective, the US loses GDP equal to the entire factory wages bill plus the wage component of any input costs. A far larger figure than the company’s savings. As more companies offshore jobs, sales growth in the USA is affected. In the end this is likely to more than offset the savings that justified the offshore move in the first place.

Stock Buybacks

Stock buybacks accelerate EPS (earnings per share) growth and are great for boosting stock prices and executive bonuses. But they create the illusion of growth while GDP stands still. There is no new capital formation.

Can GDP Growth Recover?

Yes. Restore capital formation and GDP growth will recover.

How to do this:

Trump has already made an important move, revising tax laws to encourage corporations to repatriate offshore funds.

But more needs to be done to create a level playing field.

Stop currency manipulation and theft of technology by developing countries, especially China. Trump has also signaled his intention to tackle this thorny issue.

Repatriating offshore manufacturing and jobs is a much more difficult task. You can’t just pack a factory in a box and ship it home. There is also the matter of lost skills in the local workforce. But manufacturing jobs are being lost globally at an alarming rate to new technology. In the long-term, offshore manufacturing plants will be made obsolete and replaced by new automated, high-tech manufacturing facilities. Incentives need to be created to encourage new capital formation, especially high-tech manufacturing, at home.

Stock buybacks, I suspect, will always be around. But remove the incentive to boost stock prices by targeting the structure of executive bonuses. It would be difficult to isolate benefits from stock buybacks and tax them directly. But removing tax on dividends — in my opinion far simpler and more effective than the dividend imputation system in Australia — would remove the incentive for stock buybacks and make it difficult for management to justify this action to investors.

We already seem to be moving in the right direction. The last two points are relatively easy when compared to the first two. If Donald Trump manages to pull them (the first two) off, he will already move sharply upward in my estimation.

Judge a tree by the fruit it bears.

~ Matthew 7:15–20

Why the establishment were clean-bowled by Trump

Forget private email servers and sex tapes. Forget men versus women. This election was decided on the following three issues:

1. Globalization.

Currency manipulation by emerging economies like China and consequent offshoring of blue-collar jobs has gutted the US manufacturing sector. Accumulation of $4 trillion of foreign reserves enabled China to suppress appreciation of the Yuan and maintain a competitive advantage against US manufacturers.

China Foreign Reserves ex-Gold

Container imports and exports at the Port of Los Angeles (FY 2016) highlight the problem. More than 57% of outbound containers are empty. Container shipping represents mainly manufactured goods, rather than bulk imports or exports, and the dearth of manufactured exports reflects the trade imbalance with Asia. Even the container statistic understates the problem as many outbound containers contained scrap metal and paper rather than manufactured goods, for processing in Asia.

Port of Los Angeles (FY 2016) Container Traffic

Manufacturing job losses were tolerated by the political establishment, I suspect, largely because corporate profits were boosted greatly by offshoring jobs and low-cost imports. And corporations are the biggest political donors. Corporate profits as a percentage of GDP almost doubled over the last two decades.

Corporate profits as a percentage of GDP

2. Immigration

This is a similar issue to that highlighted by the UK/Brexit vote. Blue collar workers, losing jobs to globalization, felt threatened by high levels of immigration which, among other problems, stepped up competition for increasingly-scarce jobs.

3. Wall Street

Wall Street bankers with their million-dollar bonuses were blamed for the global financial crisis and collapse of the housing market, the primary store of wealth for middle-class families. While there is no doubt Wall Street had their snouts in the trough, the seeds of the GFC were laid years earlier when Bill Clinton repealed the Glass-Steagall Act with backing from a Republican congress. Failure to prosecute or otherwise punish even the worst offenders of the sub-prime mortgage debacle was seen by the public as collusion.

The Democrats in 2015 recognized that Hillary had been damaged by the private email server controversy and did their best to maneuver the election into a Trump-Clinton stand-off. Their view was that Hillary would be beaten by either Rubio or Kasich. Even the reviled Ted Cruz was seen as a threat. Hillary was seen as having the best chance against a flawed Trump who would struggle to unite the Republican party behind him.

Hillary Clinton and Donald Trump

Hillary Clinton was presented as the ‘safe’ candidate in the election, representing the status quo and stability. But that set her up for a fall as their strategy underestimated the anger of American voters and the risks they were prepared to take to bring about change.

While I am relieved that we can “close the history book on the Clintons”, to use Trump’s words, I viewed him as a lame-duck candidate, too flawed to hold the office of President. Fortunately there are many checks and balances in the US political system. It survived Nixon and should be able to survive this too. Especially if Trump takes a hands-off approach, along the lines of Reagan who was reputed to doze off in cabinet meetings. A lot will depend on his appointees and the next few months will be critical in setting the direction for his presidency. Expect financial markets to remain volatile until they have grown accustomed to the change. It could take a year or even longer.

China’s export dilemna

Growth in value of exports from China has slowed to single figures since 2012. It will be difficult sustain current GDP growth if this trend continues.

China Exports

The Harper Petersen index of shipping rates for container vessels, the Harpex, remains near its 2010 low, reflecting continued weakness in Asian manufactured goods exports (a rise in exports from Europe or North America would be absorbed by the high percentage of containers returned empty to Asia on the round trip).

US Imports from China

Rising Australian bulk commodity exports reflect the disconnect between Chinese imports and exports, with vast investment in infrastructure and rising stockpiles of raw materials used to sustain economic growth. But diminishing marginal returns on further infrastructure and housing investment mean failed recovery of manufactured goods exports would lead to a hard landing.

Australian Bulk Commodity Exports

A key factor will be the strength of the RMB against the US Dollar. Ambrose Evans-Pritchard suggests that China will meet strong resistance in its attempts to export its deflation to the West. Treasury’s forex report to Congress (April 2014) highlight’s sensitivity toward further exchange rate manipulation:

In China, the RMB appreciated during 2013 on a trade-weighted basis, but not as fast or by as much as is needed, and large-scale intervention resumed. The RMB appreciated by 2.9 percent
against the dollar in 2013. However, as a result of the depreciation of the yen and many emerging market currencies, the RMB strengthened more on a trade-weighted basis, with the RMB’s nominal and real effective exchange rates rising 7.2 and 7.9 percent, respectively. For most of 2013 the RMB exchange rate was at, or very near, the most appreciated edge of the daily trading band, suggesting continuous pressure for greater RMB appreciation. During 2014, however, the exchange rate has reversed direction, depreciating by a marked 2.68 percent year to date.

There are a number of continuing signs that the exchange rate adjustment process remains incomplete and the currency has further to appreciate before reaching its equilibrium value. China continues to generate large current account surpluses and attracts large net inflows of foreign direct investment; China’s current account surplus plus inward foreign direct investment in 2013 exceeded $446 billion. The reduction in the current account surplus as a share of China’s GDP has largely been the reflection of the unsustainably rapid pace of investment growth. Finally, China has continued to see rapid productivity growth, which suggests that continuing appreciation is necessary over time to prevent the exchange rate from becoming more undervalued. All of these factors indicate a RMB exchange rate that remains significantly undervalued. Further exchange rate appreciation would help to smoothly rebalance the Chinese economy away from investment toward consumption.

The Chinese authorities have been unwilling to allow an appreciation large enough to bring the currency to market equilibrium, opting instead for a gradual adjustment which has now been partially reversed . The expectation that the RMB would continue to appreciate over time resulted in large and increasing capital inflows in 2013. The PBOC’s policy of gradual adjustment triggered expectations of continued appreciation, and resulted in large-scale foreign exchange intervention. China’s foreign exchange reserves increased sharply in 2013, by $509.7 billion, which was a record for a single year. China has continued large-scale purchases of foreign exchange in the first quarter of this year, despite having accumulated $3.8 trillion in reserves, which are excessive by any measure. This suggests continued actions to impede market determination.

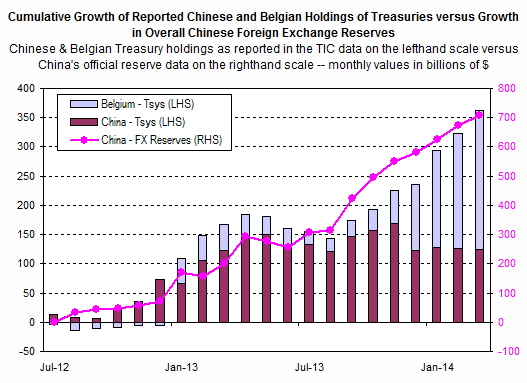
In short, China has been buying US Treasurys as a form of vendor financing, allowing them to export to the US while preventing the RMB from appreciating to its natural, market-clearing level against the Dollar. The fact that they are attempting to disguise this manipulation, using third parties, means that Congress is unlikely to tolerate further suppression of the RMB against the Dollar and will be forced to take action.

Is China hiding its FX reserves in...Belgium?

Feared sales of US Treasury investments by China, leading to a collapse of the Dollar, are most unlikely and would be a death knell for Chinese exports. Reversal of capital flows would cause rapid appreciation of the RMB against the Dollar, up-ending China’s former competitive advantage and boosting US exports.

Even without a reduction of existing Treasury holdings, appreciation of the RMB against the Dollar and Euro appears inevitable. This would be disastrous for China, causing them to forfeit their competitive advantage in export markets. And without access to the level of technology and global branding enjoyed by their Western counterparts, Chinese exporters are likely to struggle to hold existing markets, let alone achieve further growth. With diminishing returns on infrastructure and housing investment, China could soon run out of options to stimulate its economy. And its path as a global economic powerhouse may well follow that of its predecessor, Japan.

China’s export dilemna

Growth in value of exports from China has slowed to single figures since 2012. It will be difficult sustain current GDP growth if this trend continues.

China Exports

The Harper Petersen index of shipping rates for container vessels, the Harpex, remains near its 2010 low, reflecting continued weakness in Asian manufactured goods exports (a rise in exports from Europe or North America would be absorbed by the high percentage of containers returned empty to Asia on the round trip).

US Imports from China

Rising Australian bulk commodity exports reflect the disconnect between Chinese imports and exports, with vast investment in infrastructure and rising stockpiles of raw materials used to sustain economic growth. But diminishing marginal returns on further infrastructure and housing investment mean failed recovery of manufactured goods exports would lead to a hard landing.

Australian Bulk Commodity Exports

A key factor will be the strength of the RMB against the US Dollar. Ambrose Evans-Pritchard suggests that China will meet strong resistance in its attempts to export its deflation to the West. Treasury’s forex report to Congress (April 2014) highlight’s sensitivity toward further exchange rate manipulation:

In China, the RMB appreciated during 2013 on a trade-weighted basis, but not as fast or by as much as is needed, and large-scale intervention resumed. The RMB appreciated by 2.9 percent
against the dollar in 2013. However, as a result of the depreciation of the yen and many emerging market currencies, the RMB strengthened more on a trade-weighted basis, with the RMB’s nominal and real effective exchange rates rising 7.2 and 7.9 percent, respectively. For most of 2013 the RMB exchange rate was at, or very near, the most appreciated edge of the daily trading band, suggesting continuous pressure for greater RMB appreciation. During 2014, however, the exchange rate has reversed direction, depreciating by a marked 2.68 percent year to date.

There are a number of continuing signs that the exchange rate adjustment process remains incomplete and the currency has further to appreciate before reaching its equilibrium value. China continues to generate large current account surpluses and attracts large net inflows of foreign direct investment; China’s current account surplus plus inward foreign direct investment in 2013 exceeded $446 billion. The reduction in the current account surplus as a share of China’s GDP has largely been the reflection of the unsustainably rapid pace of investment growth. Finally, China has continued to see rapid productivity growth, which suggests that continuing appreciation is necessary over time to prevent the exchange rate from becoming more undervalued. All of these factors indicate a RMB exchange rate that remains significantly undervalued. Further exchange rate appreciation would help to smoothly rebalance the Chinese economy away from investment toward consumption.

The Chinese authorities have been unwilling to allow an appreciation large enough to bring the currency to market equilibrium, opting instead for a gradual adjustment which has now been partially reversed . The expectation that the RMB would continue to appreciate over time resulted in large and increasing capital inflows in 2013. The PBOC’s policy of gradual adjustment triggered expectations of continued appreciation, and resulted in large-scale foreign exchange intervention. China’s foreign exchange reserves increased sharply in 2013, by $509.7 billion, which was a record for a single year. China has continued large-scale purchases of foreign exchange in the first quarter of this year, despite having accumulated $3.8 trillion in reserves, which are excessive by any measure. This suggests continued actions to impede market determination.

In short, China has been buying US Treasurys as a form of vendor financing, allowing them to export to the US while preventing the RMB from appreciating to its natural, market-clearing level against the Dollar. The fact that they are attempting to disguise this manipulation, using third parties, means that Congress is unlikely to tolerate further suppression of the RMB against the Dollar and will be forced to take action.

Feared sales of US Treasury investments by China, leading to a collapse of the Dollar, are most unlikely and would be a death knell for Chinese exports. Reversal of capital flows would cause rapid appreciation of the RMB against the Dollar, up-ending China’s former competitive advantage and boosting US exports.

Even without a reduction of existing Treasury holdings, appreciation of the RMB against the Dollar and Euro appears inevitable. This would be disastrous for China, causing them to forfeit their competitive advantage in export markets. And without access to the level of technology and global branding enjoyed by their Western counterparts, Chinese exporters are likely to struggle to hold existing markets, let alone achieve further growth. With diminishing returns on infrastructure and housing investment, China could soon run out of options to stimulate its economy. And its path as a global economic powerhouse may well follow that of its predecessor, Japan.