China is up 2 million barrels a day but oil is not going anywhere. It appears there is “ample supply in the market for us to not have a big impact from China coming back.”
Base case: global recession
The Treasury yield curve is flattening, with the 10-year/3-month yield differential plunging sharply, to a current 0.24%. Another 75 basis point rate hike at the next FOMC meeting is expected to drive the 3-month T-Bill discount rate above the 10-year yield, the negative spread warning of a deep recession in the next 6 to 18 months (subsequent reversal to a positive spread would signal that recession is imminent).

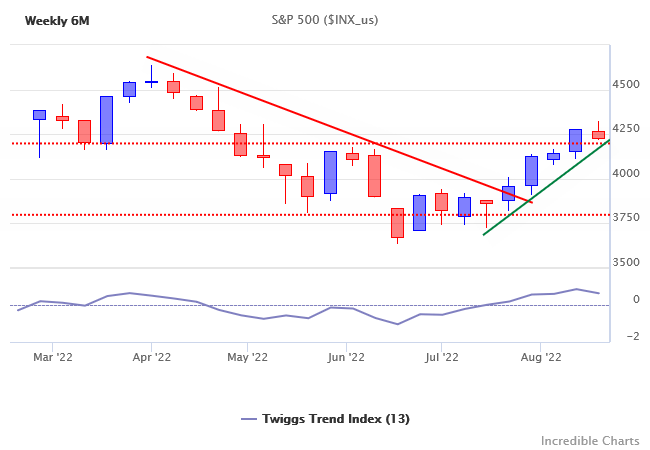
The S&P 500 is retracing to test short-term support at 4200. Breach would warn of another decline, while follow-through below 3650 would signal the second downward leg of a bear market.

21-Day Volatility troughs above 1% (red arrows) continue to warn of elevated risk.

Dow Jones Industrial Metals Index is in a primary down-trend, warning of a global recession.

Supported by a similar primary down-trend on Copper, the most prescient of base metals.

Brent crude below $100 also warns of an economic contraction. Goldman Sachs project that crude oil will reach $135 per barrel this Winter, while Ed Morse at Citi says that WTI Light Crude will likely remain below $90 per barrel. Obviously, the former foresees an economic recovery, while the latter sees an extended contraction. Of the two, Morse has the best track in the industry.

Natural gas prices are climbing.

Especially in Europe, where Russia is attempting to choke the European economy.

Causing Germany’s producer price index to spike to 37.2% (year-on-year growth).

Conclusion
Our base case is a global recession. A soft landing is unlikely unless the Fed does a sharp pivot, Russia stops trying to throttle European gas, and China goes all-in on its beleaguered property sector. That won’t address any of the underlying problems but would kick the can down the road for another year or two.
Global recession warning
Copper broke primary support at $9,000 per metric ton, signaling a bear market. Known as “Dr Copper” because of its prescient ability to predict the direction of the global economy, copper’s sharp fall warns of a global recession dead ahead.

The Dow Jones Industrial Metals Index broke support at 175, confirming the above bear signal. A Trend Index peak at zero warns of strong selling pressure across base metals.

Iron ore retreated below $125 per metric ton, warning of another test of $90. Further sign of a slowing global economy.

The Australian Dollar is another strong indicator of the commodity cycle. After breaking primary support at 70 US cents, follow-through below support at 68.5 confirms a bear market. A Trend Index peak at zero warns of selling pressure.

Brent crude remains high, however, propped up by shortages due to sanctions on Russian oil. Penetration of the secondary trendline (lime green) is likely, as signs of a slowing economy accumulate. Breach of support at $100 per barrel is less likely, but would confirm a global recession.

Long-term interest rates are falling, with the 10-year Treasury yield reversing below 3.0%, as signs of a US contraction accumulate.

ISM new orders fell to their lowest level since May 2020, in the midst of the pandemic.

The Atlanta Fed’s GDPNow forecast for Q2 dropped sharply, to an annualized real GDP growth rate of -2.08%.

Conclusion
We would assign probability of a global recession this year as high as 70%.
The S&P 500 and Plan B
The S&P 500 penetrated its rising trendline, warning of a re-test of support at 3000. But selling pressure on the Trend Index appears to be secondary.

Transport bellwether Fedex retreated below long-term support at 150 on the monthly chart — on fears of a slow-down in international trade. Follow-through below 140 would strengthen the bear signal, offering a target of 100. The bear-trend warns that economic activity is contracting.

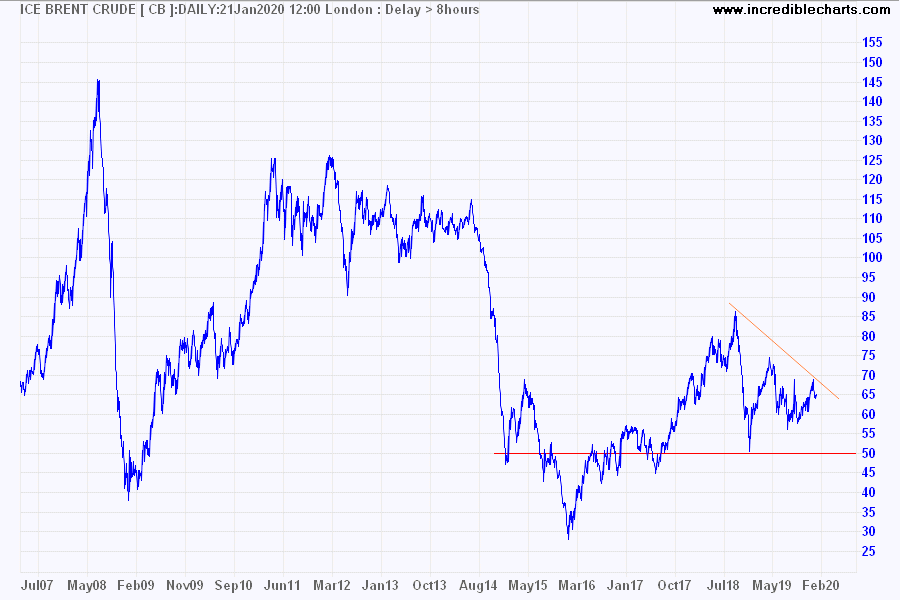
Brent crude dropped below $60/barrel on fears of a global slow-down. Expect a test of primary support at 50.

Dow Jones – UBS Commodity Index broke primary support at 76 on the monthly chart, also anticipating a global slow-down.

South Korea’s KOSPI Index is a good barometer for global trade. Expect a re-test of primary support at 250.

While Dr Copper, another useful barometer, warns that the patient (the global economy) is in need of medical assistance.

The Fed can keep pumping Dollars into financial markets but at some point, the patient is going to stop responding. In which case you had better have a Plan B.
Commodities & Global Growth
Commodity prices warn that the global economy is still in a slump.
The Dow Jones – UBS Commodity Index remains at one-third of its 2007 peak, with no sign of recovery.

The fall in crude prices hasn’t been as severe, but Brent Crude is again weakening and looks set for another test of $50/barrel.

Shipping rates for dry bulk goods, such as iron ore and coal, have fallen, with the Baltic Dry Index close to long-term support at 500.

Supply interruptions to iron ore production in Brazil have cushioned Australian producers from a sharp down-turn in iron ore prices. But coal exporters are feeling the pinch.

Recovery of Brazilian production over the next two years is expected to add downward pressure to iron ore prices.
The only positive appears to be container shipping rates. The Harpex Index rose steeply in 2019, reflecting increased demand for container shipping of finished goods.

Somewhat surprising, since this coincided with US-China trade tensions and tariff increases. The answer may lie with importers on both sides of the Pacific attempting to front-run the imposition of tariffs and build inventories in case of supply interruptions and to allow time to adapt their supply chain. Expect the index to retreat in the early part of 2020.
It looks like low global growth will continue.
The ‘black swan event’ that could send oil to $US25 a barrel | Business Insider
From Elena Holodny | May 24, 2016, 10:13 AM
Both WTI crude and Brent crude were around $US48 per barrel on Monday, well above their lows below $US30 per barrel earlier this year. But all of that may come crashing down if one “black swan event” transpires, argued a Bank of America Merrill Lynch global commodities research team.
From their recent note to clients (emphasis ours): “Global GDP in US dollar terms at market exchange rates is stagnant. Continued US dollar strength could force Saudi Arabia either to cut oil production modestly and push Brent back to $50 or de-peg the Saudi riyal, our black swan event, which could lead Brent to collapse to $25/bbl.”
While this certainly sounds ominous for the oil market, it’s worth noting that analysts and financiers are split on whether the Saudis will actually de-peg their currency and undo the current fixed exchange rate with the US dollar….
Source: The ‘black swan event’ that could send oil to $US25 a barrel | Business Insider
Gold-Oil ratio says “Sell”
Spot Gold recently recovered above $1100, suggesting a short rally fueled by concern over China. The gold-oil ratio, however, soared to 33, signaling that gold is highly overbought relative to Brent Crude. Last time the gold-oil ratio reached 30 was 1988 — when the Iraq-Iran ceasefire eased global crude shortages — and before that when the Saudis substantially hiked crude oil production in 1985. Any gold rally is likely to be short-lived — with stubborn resistance at $1200/ounce — and followed by a test of support at $1000/ounce*.

* Target calculation: 1100 – ( 1200 – 1100 ) = 1000
The last time (2008) that Brent Crude reached these lows, gold fell to $700/ounce.
Will Iran deal nuke crude?
The nuclear deal with Iran is likely to increase supply of crude oil, especially in European markets, driving down prices.

Brent crude August 2015 contract (CBQ15 above) is testing support at $56 per barrel. Narrow consolidation suggests continuation of the down-trend. Breach of $56 would signal a test of primary support at $53.

Nymex (WTI) Light Crude August 2015 contract (CLQ15) is in a similar pattern, with medium-term support at $51 and primary support at $49 per barrel.
Crude dives below $58
Nymex Light Crude closed below support at $58 per barrel, signaling retracement to test medium-term support at $53. Respect of $53 would suggest an advance to $68/barrel, while failure would warn of a test of primary support at $44.

June 2020 futures broke support, at $70/barrel, suggesting a test of $50/barrel*.

* Target calculation: 70 – ( 90 – 70 ) = 50
Crude: Where next?
Nymex Light Crude plotted against CPI gives an historical perspective on current crude prices: high prior to China’s entry into the global energy market, but low relative to prices since then. Expect strong support at the 2008 low.

Has fracking permanently suppressed oil prices, or will production dwindle over time in response to lower prices? Oil well efficiency is rising as marginal wells are mothballed.
Chart: Rising oil well efficiency in the US – pic.twitter.com/5w54OqyxKJ
— SoberLook.com (@SoberLook) June 15, 2015
Production forecasts are rising.
US shale still refuses to buckle. Not sure OPEC really winning here. From Deutsche Bank's latest pic.twitter.com/Z7wHxv3yrl
— A Evans-Pritchard (@AmbroseEP) June 16, 2015
Causing oil futures to fall. June 2020 Light Crude broke support at $70/barrel, offering a target of $55/barrel.

* Target calculation: 70 – ( 85 – 70 ) = 55
Spot prices (Nymex Light Crude) continue to range between $58 and $61 per barrel. Reversal below $58 would signal retracement to test medium-term support at $54. Breakout above $61 is unlikely at present, but would signal a rally to $68/barrel.


