Throughout history, from Dutch tulips to South Sea investments, investors experiencing a bubble have refused to believe that it will end. Forecasters with the temerity to suggest otherwise were attacked and ridiculed. Denial is a powerful emotion.
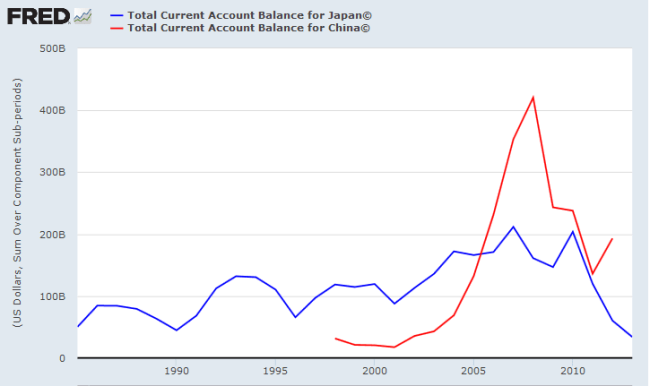
The last three decades have been no different, as we moved through a succession of bubbles: from Japan in 1989/90, to the 1997/98 Asian crisis, to the Dotcom crash in 2000/01, and the GFC in 2007/08. All had the same primary cause: state interference with two major pricing mechanisms that allow markets to clear. Central bank suppression of interest rates fueled rapid debt growth and forced investors to assume greater risk in order to achieve a viable return, building huge imbalances within the economy. Suppression of exchange rates through accumulation of vast foreign reserves, primarily foreign debt, has also been used by emerging economies such as China to boost exports and maintain a current account surplus. But this ignores the inevitable feedback loop that results.
China’s and other emerging markets current account surpluses caused the US to suffer a persistent current account deficit.

The effect on the US is twofold. First, a persistent current account deficit hurts economic growth. Second, foreign purchases of US debt suppress long-term interest rates. Like most central banks, the Fed preferred to address the symptoms (falling growth and rising unemployment) rather than address the underlying cause (if your only tool is a hammer then every problem starts to resemble a nail). Fed suppression of interest rates created a wash of easy money looking for a return. A large chunk of this flowed into China and other emerging markets — primarily as credit to domestic borrowers — taking advantage of low interest rates in the US and higher yields in these rapidly growing economies, while enjoying the protection of a currency pegged to the Dollar.
Now that the Fed is making noises about raising interest rates, margins are likely to be squeezed and the currency peg appears vulnerable. Recent capital outflows forced China to devalue the Yuan. But devaluation is likely to fuel further outflows. Supporting the currency — purchasing Yuan using China’s more than $4 trillion of foreign reserves — may appear a simple solution but that contracts the amount of money in circulation, threatening deflation.
Attempts to stem the outgoing tide are likely to sap confidence and exacerbate the problem. China and other emerging markets can expect a hard landing. US and European markets survived the crises of 1989/90 and 1997/98 but global economies are now far more intertwined. I prefer to err on the side of caution.
North America
The S&P 500 respected the new resistance level at 2000, suggesting that the rally has failed. Wednesday’s blue harami candle offers feint hope of a reversal, but the overriding trend is downward. Rising short sales warn of increased selling pressure. Recovery above 2000 is unlikely but would offer hope of a relieving rally. Breach of short-term support at 1900 would suggest another decline, while failure of 1870 would confirm.

* Target calculation: 1900 – ( 2000 – 1900 ) = 1800
The CBOE Volatility Index (VIX) continues to indicate elevated market risk.

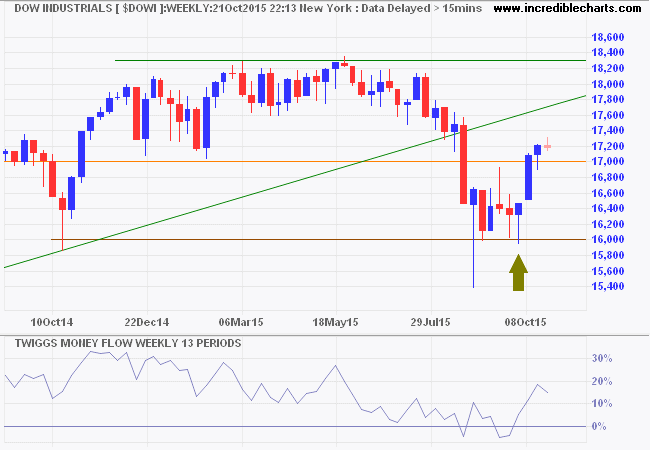
Dow Jones Industrial Average is in a similar position to the S&P 500. Breach of support at 16000 would confirm a primary down-trend. Recovery above 17000 is less likely, but would signal buying pressure.

Canada’s TSX 60 rallied above resistance at 800 but has since reversed. Follow-through below say 790 would confirm the primary down-trend. Declining 13-week Twiggs Momentum below zero continues to warn of a down-trend. Recovery above 820 is less likely but would indicate buying pressure.

* Target calculation: 800 – ( 900 – 800 ) = 700
Europe
Germany’s DAX recovered above support at 10000. Follow-through above last week’s candle at 10500 would indicate a rally to test the descending trendline. Respect of the zero line by 13-week Twiggs Money Flow indicates medium-term buying pressure. Reversal below 10000 is less likely, but would warn of a primary down-trend.

The Footsie is testing primary support at 6100. Reversal below that level would confirm a primary down-trend, while recovery above 6250 would indicate a rally to test 6500. Respect of the zero line by 13-week Twiggs Money Flow again indicates medium-term support.

Asia
Chinese markets are closed Thursday and Friday for the World War II 70th Anniversary. The Shanghai Composite index is testing support at 3000. Intervention to support the market is unlikely to succeed. Reversal of 13-week Twiggs Money Flow below zero would confirm a primary down-trend.

Hong Kong’s Hang Seng Index gives a clearer picture of investor sentiment without government intervention. Breach of support at 22500 and declining 13-week Twiggs Money Flow (below zero) both signal a primary down-trend. Failure of the next level of support at 21000 further strengthens the signal.

* Target calculation: 440 – ( 550 – 440 ) = 330
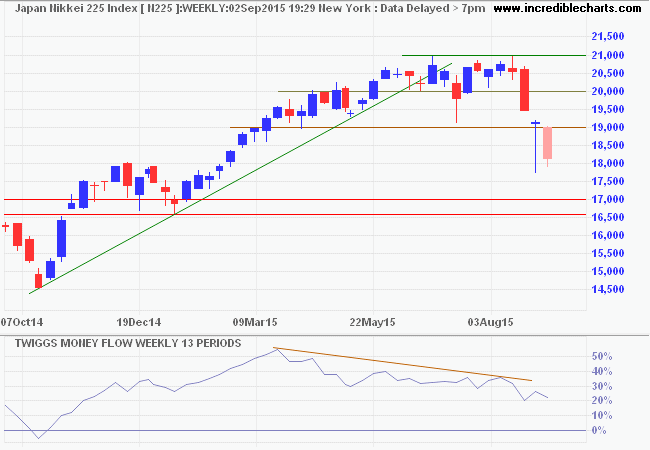
Japan’s Nikkei 225 retreated below support at 19000 and is likely to test primary support at 17000. The gradual decline of 13-week Twiggs Money Flow indicates medium-term selling pressure — more a secondary correction than a primary reversal.

* Target calculation: 19000 – ( 21000 – 19000 ) = 17000
India’s Sensex retreated below 26000, confirming a primary down-trend. Reversal of 13-week Twiggs Money Flow below zero would further strengthen the signal.

* Target calculation: 27000 – ( 30000 – 27000 ) = 24000
Australia
The ASX 200 is testing key support at 5000. Respect of the zero line (from below) on 21-day Twiggs Money Flow indicates selling pressure. Breach of 5000 is likely and would confirm a primary down-trend. Respect is unlikely, but would indicate another test of medium-term resistance at 5300.

* Target calculation: 5000 – ( 5400 – 5000 ) = 4600
There is a theory which states that if ever anyone discovers exactly what the Universe is for and why it is here, it will instantly disappear and be replaced by something even more bizarre and inexplicable.
There is another theory which states that this has already happened.
~ Douglas Adams: Hitchhiker’s Guide to the Galaxy


