ASX Technology stocks fall

The ASX 200 continues to test its February 2020 high at 7200. Narrow consolidation below resistance is a bullish sign but we need to keep a weather eye on the US and China.

ASX 200

Financial Markets

Bond ETFs, in a sideways consolidation, indicate that long-term interest rates are holding steady. Inflation remains muted and the RBA is following through on their stated intention to suppress long-term yields.

Australian Bond ETFs

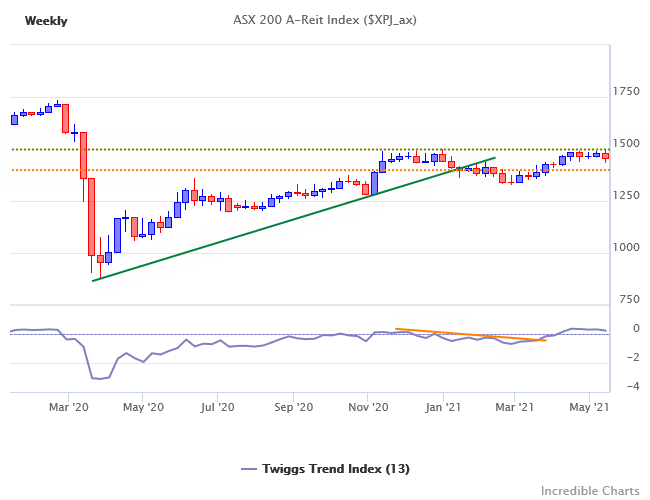
A-REITs are testing resistance at 1500. Reversal below 1340 is unlikely but would warn of a double-top reversal.
ASX 200 REITs

Financials are testing resistance at 6500. A rising 13-week Trend Index — with troughs above zero — flags buying pressure, suggesting that a breakout is likely.

ASX 200 Financials

Health Care, Discretionary & Technology

Health Care is testing resistance at 42500. The rising Trend Index is bullish but failure to cross above zero would confirm long-term selling pressure. Breach of 40000 would complete a bull-trap (a bear signal for investors) and warn of another test of primary support at 37500.

ASX 200 Health Care

Technology broke support at 1900 to signal a primary down-trend, imitating the pattern in US markets. Breach offers a medium-term target of 14001.

ASX 200 IT

Consumer Discretionary is testing its rising trendline. We expect a test of support at 2900 as the impact of government stimulus fades.

ASX 200 Discretionary

Mining

Iron ore retreated slightly, to $210/metric ton. Chinese steel mills are stockpiling — due to rising tensions with Australia and anticipated production curbs in China (to reduce pollution levels). The boom is only expected to last as long as stockpiling continues. Then prices are likely to fall steeply as mills run down stockpiles. Reversal below support at $175-$180 would warn of a sharp decline.

Iron Ore

The ASX 300 Metals & Mining found resistance at 6000. A tall shadow on this week’s candle warns of short-term selling pressure. Another test of support at 5000 is likely.

ASX 300 Metals & Mining

The All Ordinaries Gold Index (XGD) continues to test its new support level at 7000. Follow-through below recent lows would warn of another test of 6000, while recovery above 7300 would signal a fresh advance. Breakout above the long-term descending trendline would strengthen the bull signal. Gold bullishness is fueled by rising inflation fears.

All Ordinaries Gold Index

The Gold price, in Australian Dollars, is testing its descending trendline and resistance at 2400. Breakout above the two would deliver a strong bull signal.

Gold in AUD

Conclusion

Technology stocks have commenced a primary down-trend. Metals & Mining look highly-priced and susceptible to a sharp reversal. They have looked that way for months but sooner or later we are bound to see a rapid re-pricing.

Steady long-term interest rates and a buoyant housing market are lifting REITs and Financials respectively. Health Care and Consumer Discretionary look hesitant, while Gold stocks are making a tentative rally.

Notes

  1. Target for XIJ is its 2400 peak extended below 1900.

Westpac: US Dollar capped by dovish Fed (video)

Elliot Clarke - Video

Good short video from Elliot Clarke & Richard Franulovich at Westpac IQ about Aussie/US Dollar prospects and the outlook for the US economy.

Rising yields are lifting the Dollar but the Fed’s dovish stance is expected to cap the Dollar going forward, with the Aussie likely to strengthen above 80 US cents.

The Biden stimulus is likely to help the US economic recovery this year but will wear off by year-end. There are many obstacles to passing a major infrastructure bill but that would be the best way to lift growth prospects over 2022/3 and beyond and help the US keep pace with growth in Asia, where there are more development opportunities.

Markets that are likely to outperform in 2021

There is no reliable benchmark for assessing performance of different markets (stocks, bonds, precious metals, commodities, etc.) since central banks have flooded financial markets with more than $8 trillion in freshly printed currency since the start of 2020. The chart below from Ed Yardeni shows total assets of the five major central banks (Fed, ECB, BOC, BOE and BOJ) expanded to $27.9T at the end of November 2020, from below $20T at the start of the year.

Central Banks: Total Assets

With no convenient benchmark, the best way to measure performance is using relative strength between two prices/indices.

Measured in Gold (rather than Dollars) the S&P 500 iShares ETF (IVV) has underperformed since mid-2019. Respect of the red descending trendline would confirm further weakness ahead (or outperformance for Gold).

S&P 500 iShares ETF/Gold

But if we take a broad basket of commodities, stocks are still outperforming. Reversal of the current up-trend would signal that he global economy is recovering, with rising demand for commodities as manufacturing output increases. Breach of the latest, sharply rising trendline would warn of a correction to the long-term rising trendline and, most likely, even further.

S&P 500 iShares ETF/DJ-UBS Commodity Index

Commodities

There are pockets of rising prices in commodities but the broader indices remain weak.

Copper shows signs of a recovery. Breakout above -0.5 would signal outperformance relative to Gold.

Copper/Gold

Brent crude shows a similar rally. Breakout above the declining red trendline would suggest outperformance ahead.

Brent Crude/Gold

But the broad basket of commodities measured by the DJ-UBS Commodity Index is still in a down-trend.

DJ-UBS Commodity Index/Gold

Precious Metals

Silver broke out of its downward trend channel relative to Gold. Completion of the recent pullback (at zero) confirms the breakout and signals future outperformance.

Silver/Gold

Stock Markets

Comparing major stock indices, the S&P 500 has outperformed the DJ Stoxx Euro 600 since 2010. Lately the up-trend has accelerated and breach of the latest rising trendline would warn of reversion to at least the long-term trendline. More likely even further.

S&P 500 iShares ETF/Euro Stoxx 600

The S&P 500 shows a similar accelerating up-trend relative to the ASX 200. Breach of the latest trendline would similarly signal reversion to the LT trendline and most likely further.
S&P 500 iShares ETF/ASX 200

Reversion is already under way with India’s Nifty 50 (NSX), now outperforming the S&P 500.

S&P 500 iShares ETF/Nifty 50

S&P 500 performance relative to the Shanghai Composite plateaued at around +0.4. Breakout would signal further gains but respect of resistance is as likely.

S&P 500 iShares ETF/Shanghai Composite

Growth/Value

Looking within the Russell 1000 large caps index, Growth stocks (IWF) have clearly outperformed Value (IWD) since 2006. Breach of the latest, incredibly steep trendline, however, warns of reversion to the mean. We are likely to see Value outperform Growth in 2021.

Russell 1000 Value/Growth

Bonds

The S&P 500 has made strong gains against Treasury bonds since March (iShares 20+ Year Treasury Bond ETF [TLT]) but is expected to run into resistance between 1.3 and 1.4. Rising inflation fears, however, may lower bond prices, spurring further outperformance by stocks.

S&P 500 iShares ETF/Long_term Bond ETF (TLT)

Currencies

The US Dollar is weakening against a basket of major currencies. Euro breakout above resistance at $1.25 would signal a long-term up-trend.

Euro/Dollar

China’s Yuan has already broken resistance at 14.6 US cents, signaling a long-term up-trend.

Yuan/Dollar

India’s Rupee remains sluggish.

Indian Rupee/Dollar

But the Australian Dollar is surging. The recent correction that respected support at 70 US cents suggests an advance to at least 80 cents.

Australian Dollar/Dollar

Gold, surprisingly, retraced over the last few months despite the weakening US Dollar. But respect of support at $1800/ounce would signal another primary advance.

Spot Gold/Dollar

Conclusion

Silver is expected to outperform Gold.
Gold is expected to outperform stocks.
Value stocks are expected to outperform Growth.
India’s Nifty 50 is expected to outperform other major indices. This is likely to be followed by the Stoxx Euro 600 and ASX 200 but only if they break their latest, sharply rising trendlines. That leaves the S&P 500 and Shanghai Composite filling the minor placings.
Copper and Crude show signs of a recovery but the broad basket of currencies is expected to underperform stocks and precious metals.
The Greenback is expected to weaken against most major currencies, while rising inflation is likely to leave bond investors holding the wooden spoon.

COVID19: The new normal

COVID19 looks like it will be with us for some time. The US has to guard against a second wave, destroying any hard-won gains.

Daily Cases

Especially with the upsurge in daily cases in Mexico.

Daily Cases

Australia has been fortunate to catch the outbreak early.

Daily Cases

But international travel is likely to remain restricted for a long time. When you have new outbreak hotspots like Brazil….

Daily Cases

and Pakistan appearing on the radar.

Daily Cases

Bailout time

Boeing has applied to the Federal government for a $60 billion bailout. The troubled aircraft manufacturer is in need of rescuing but has indulged in $54.9 billion of stock buybacks in support of its stock price.

Former UN ambassador and ex-South Carolina governor, Nikki Halley resigned from Boeing’s board, saying that she opposes federal support for Boeing. Smart political move. Public anger is growing.

Twitter post
Twitter post
Twitter post
Twitter post
Twitter post

Many corporations used stock buybacks to boost earnings per share after earnings growth slowed in 2014/15. Boeing was no exception.

Stock Buybacks and LT Debt

The company had a reputation for engineering fine aircraft but in recent years that focus has shifted to financial engineering and cost-cutting to boost earnings per share. Free cash flow was squandered on stock buybacks, dividends and executive bonuses. No reserves were accumulated for a rainy day.

Well, a rainy day finally arrived in 2018. The Boeing 737 MAX airliner, which began service in 2017, was involved in two fatal accidents, Lion Air on October 29, 2018, and Ethiopian Airlines on March 10, 2019, caused by a malfunction of the aircraft’s new MCAS automated control system. The aircraft was grounded by airline authorities around the world and Boeing suspended production in December 2019. After a software bug was discovered in January, the return to service was delayed. Despite an outstanding issue over non-compliant wiring bundles the FAA has indicated that they expect the 737 Max to return to service in the second half of 2020.

The company had to raise almost $10 billion in bonds to help it weather the setback. CEO Dennis Muilenburg was ousted in late 2019 but still walked away with a golden parachute of up to $50 million.

A hit from the 2020 Coronavirus outbreak has put the company into difficulties, with the stock getting pounded. Boeing has been forced to apply for a government bailout.

Stock Buybacks and LT Debt

The company is a strategic asset of the United States and should be protected.

But rewarding bad behavior would promote moral hazard on a wide scale. To give management and stockholders a free ride would encourage risk-taking by other companies — with the expectation that they will be bailed out if something goes wrong.

Support the company but hurt the stockholders

Management and existing stockholders need to feel the pain.

Offer support in the form of $60 billion of convertible bonds or preference shares, ranking behind creditors but ahead of stockholders. Conversion into ordinary shares should be in 10 years time but at the current stock price of $100. Stockholders and management awards will take a huge hit,  while taxpayers can look forward to a sizeable gain when the company recovers.

Support should be non-voting (bonds or prefs) to keep political interference to a minimum.

Buybacks

Preventing future buybacks is a completely separate issue that should be addressed on a national basis and not by placing restrictions on individual companies. For the record, we are against buybacks because they can be used to artificially support stock prices. Companies that need to return capital to stockholders should declare a special dividend.

Avoid a Domino-effect

There are a string of companies lining up with bailout requests. It is important to put emotions aside and save those that are still viable businesses and not just strategic assets like Boeing. Millions of jobs are at stake. And disruption to credit markets could have a Lehman-like domino effect.

Just ensure that it is on terms that favor the taxpayer, so that stockholders will think twice about future profligacy.

ASX catches a virus

It’s not a pretty sight. The ASX 200 fell close to 10% in a single week. The severity of the fall suggests that sellers are committed and buyers are scarce. Breach of support at 6400 is highly likely and would offer a target of 5400 (a 25% draw-down).

ASX 200

A V-shaped recovery is unlikely.

The ASX 300 Metals & Mining index broke primary support at 4100, completing a double-top reversal with a target of 3400.

ASX 300 Metals & Mining

The Aussie Dollar is also getting smashed, headed for a target of 64 cents after breaking support at 67.

AUDUSD

The ASX 300 Banks index is headed for a test of 7250/7300. Breach is likely and would offer a test of 6750.

ASX 300 Banks

Our conclusion hasn’t changed from last week:

Threats continue to outweigh opportunities in our view and we retain a bearish view on the global and domestic economies. Our focus remains on defensive and contra-cyclical (gold) stocks.

ASX 200 retracement likely

A short candle with a tall shadow on the ASX 200 weekly chart warns of short-term selling pressure. Expect retracement to test the new support level at 6800.

ASX 200

Weakness has been driven by the Resources sector, with a gravestone candle on the ASX 300 Metals & Mining index warning of selling pressure at resistance at 4800 and a likely reversal to test support at 4450.

ASX 300 Metals & Mining

A short candle on the ASX 300 Banks index warns of increased short-term selling pressure. Respect of the descending trendline would signal another decline; breach of support at 7250 would confirm. Penetration of the trendline is less likely but would suggest that a bottom is forming.

ASX 300 Banks

We continue to hold a bearish view on the domestic economy but recognize that the temporary tailwind from resources (iron ore) may partly alleviate this. IT and Healthcare sectors are, in our view, over-priced and we maintain our focus on defensive and contra-cyclical (gold) stocks.

ASX 200 lifted by resources

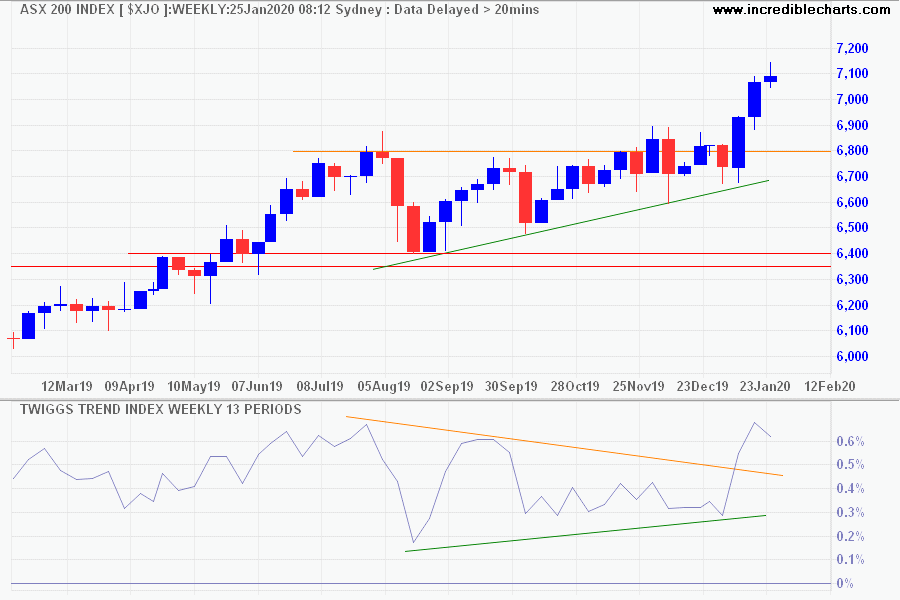
The ASX 200 is advancing towards its medium-term target of 7200 after breaking resistance at 6800. A high trend index trough signals buying pressure.

ASX 200

Primary driver of the advance is Resources. Signing of phase one of the US-China trade deal lifted iron ore, which is  testing resistance at 95. Consolidation at/below 95 is likely, however, given that the mid-2019 peak was caused by supply disruption in Brazil.

Iron Ore

The ASX 300 Metals & Mining index is headed for a test of resistance at 4800.

ASX 300 Metals & Mining

Financials are weak, but the ASX 300 Banks index found support at 7250. Respect of the descending trendline would warn of another decline, with a short-term target of 7000. Penetration of the trendline is less likely but would warn that a bottom is forming.

ASX 300 Banks

The ASX 200 REITs index is testing resistance at 1680, reflecting the investor demand for yield.

ASX 200 REITs

A weakening Australian Dollar may lift exports slightly but reflects concerns over the phase one US-China trade deal and the impact substantive purchase commitments made by China will have on other energy and commodity suppliers. Breach of 68.50 would offer a short-term target of 67 US cents.

AUDUSD

We continue to hold a bearish view on the domestic economy but recognize that the tailwind from resources may partly alleviate this. IT and Healthcare sectors are, in our view, over-priced and we maintain our focus on defensive and contra-cyclical (gold) stocks.

ASX Leading Sectors

The ASX 200 broke resistance at 6800, signaling a fresh advance. Expect retracement to test the new support level. Respect would strengthen the bull signal, confirming a fresh advance.

ASX 200 Quarterly

At the same time, fundamentals are distinctly bearish, with falling retail sales and dwindling GDP growth. So, what sectors are driving the index?

A comparison of the ASX 200 sector indices shows that the advance is led by Healthcare and Information Technology sectors, while the laggards are Financials, Utilities and Telecommunications.

ASX Sector Comparison

Top performers in Healthcare (with forward price-earnings ratio where available) are:

  • Polynovo (PNV) – negative eps
  • Clinuvel (CUV) – 79
  • Pro Medicus (PME) – 137
  • Nanosonics (NAN) – 158
  • Resmed (RMD) – 55
  • CSL (CSL) – 49
  • Fisher & Paykel Health (FPH) – 55

ASX 200 Healthcare Top Performers

In Information Technology, top performers are:

  • Afterpay (APT) – negative eps (forward pe 476)
  • Nearmap (NEA) – negative eps
  • Bravura (BVS) – 37
  • Appen (APX) – 58
  • Xero (XRO) – 5998 (forward pe 270)
  • Altium (ALU) – 63

ASX 200 Information Technology Top Performers

The graph below compares PE Ratios on the y-axis to required Annual Growth in earnings on the x-axis. The curve plots the compound annual growth (CAGR) required for a 20-year income stream to deliver a 12.5% return on investment.

PE Ratio compared to Expected Growth

What this illustrates is that PE Ratios above 50 should be treated with caution as they assume the ability to maintain high CAGR in earnings (e.g. above 20%) for long periods. Even when growing off a low base that can be difficult to achieve.

Bottom line: many stocks in these sectors (Healthcare and IT) are highly-priced and vulnerable to strong draw-downs.

Australia: Bearish apart from mining

Household disposable income lifted in response to the recent tax cuts but households remain risk-averse, with consumption still falling and extra income going straight to debt repayment — reflected by a jump in the Saving ratio below.
Australia Household Saving

Housing prices are recovering despite high levels of mortgage stress in the outer suburbs but building approvals for new housing continue to fall. Construction expenditure is likely to follow.

Australia Building Approvals

GDP growth is falling, while corporate profits (% of GDP) remain in the doldrums apart from the mining sector.

Australia Corporate Profits

Low household disposable income and corporate profit growth in turn lead to low business investment (% of GDP).

Australia Business Investment

Low investment leads to low job creation. Job vacancies and job ads both warn of declining employment growth.

Australia Job Ads

Cyclical employment growth is expected to slow in line with the fall in the Leading Indicator over the past year.

Australia Leading Employment Indicator

We maintain a bearish outlook for the Australian economy, though Mining continues to surprise to the upside.