Jobs and GDP growth

The view is often promoted that low GDP growth over the past decade is caused by low interest rates and balance sheet expansion (QE) by central banks. That is putting the cart before the horse. Central banks have tried to stimulate their economies, with massive QE and low interest rates, because of low GDP growth. Not the other way around.

The real cause of low GDP growth is low job growth, as the chart below illustrates.

Real GDP and Nonfarm Payroll Growth

[click here for full screen image]

Offshoring jobs means offshoring growth.

The last time that the US had employment growth above 5.0% is 1984 which also the last time that we saw real GDP growth at 7.5%. Since then, job growth has progressively weakened — and GDP with it.

In the last decade, employment growth peaked at 2.27% and GDP at 3.98% in Q1 of 2015.

Real GDP and Nonfarm Payroll Growth

We now expect job growth to fall to -20% in April, four times the -5% trough in 2009, and a sharp GDP contraction.

How long the recession/depression will continue is uncertain. But, in the long-term, it is unlikely that the US can achieve +5% real GDP growth unless employment growth recovers close to +3.0%.

ASX 200 diverges from fundamentals

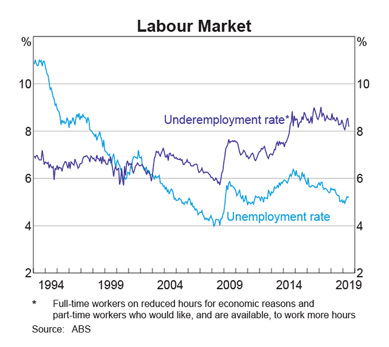
Seasonally adjusted labour force estimates show a decline in October 2019:

  • Employment decreased by 19,000 to 12,919,200 people
    (full-time -10,300 and part-time -8,700).
  • Unemployment rate increased by 0.1 pts to 5.3%.
  • Monthly hours worked in all jobs decreased by 2.8 million hours to 1,783.9 million hours.

The leading indicator of employment has been predicting a down-turn in employment for some time, recording its sixteenth consecutive monthly fall in November.

Australia: Leading Employment Indicator

Job advertisements have also declined since late 2018.

Australia: Job Ads & Vacancies

Falling employment has a knock-on effect in other areas of the economy:

According to Tony Weber, chief executive of the FCAI, new vehicles have now seen the nineteenth consecutive month of decreasing sales in the Australian market, with October 2019 sales down 9.1% compared to October 2018.

“Year to date sales of new motor vehicles in 2019 are almost 78,000 units (eight per cent) lower than the same period in 2018…”

Retail sales are also soft:

In volume terms, the seasonally adjusted estimate for the September quarter 2019 fell 0.1%. This follows a 0.1% rise in the June quarter 2019, and a 0.1% fall in the March quarter 2019.

But the ASX 200, seemingly unperturbed, is testing resistance at 6800. Breakout would signal a primary advance with a target of 7200. Breach of support at 6400 seems unlikely but would warn of a decline with a target of 5400.

ASX 200

There are, however, signs of weakness in the largest two sectors.

ASX 300 Banks index penetrated its rising trendline, warning of a correction. Declining peaks on the Trend Index indicate secondary selling pressure. Follow-through of the index below 7600 would strengthen the bear signal.

ASX 300 Banks

A hanging man candlestick warns the ASX 300 Metals & Mining index is likely to again test support at 4100 ( the neckline of a large head-and-shoulders reversal pattern ). A Trend Index peak near zero would indicate continued selling pressure.

ASX 300 Metals & Mining

Iron ore continues its primary decline, since breaking support at 90. Our long-term target is 65.

Iron Ore

We maintain low exposure to Australian equities, with a focus on defensive and contra-cyclical stocks, because of our bearish outlook. But ASX 200 breakout above 6800 would force us to re-examine our outlook.

Australia: Leading Index of Employment in 16th month of decline

The Department of Employment, Skills, Small and Family Business released their Monthly Leading Indicator of Employment for September 2019, recording its 16th straight month of decline.

Hat tip to Macrobusiness, this is a peach of an indicator, predicting Australia’s economic performance.

I have added % retracement in the ASX 200 to the graph below. Each of the significant past troughs in the Leading Index coincides with a drawdown of more than 20% in the ASX 200.

Leading Index of Employment

Is the current fall in the Leading Index a false alarm, as in the 2005/2006 raging commodities bull market, or are we in for another retracement?

Leading Index of Employment - Components

My money is on the retracement.

Australian residential construction to decline until 2021 | ABC

One of Australia’s largest cement and construction materials producers, Adelaide Brighton Ltd (ABC), announced their half year results today. The media statement contains a decidedly bearish outlook for the housing market.

ABC logo

Operational Review

Demand for construction materials slowed further during the period. Australian residential construction approvals declined more than 25% on seasonally adjusted terms for the six months to June 2019 and residential construction is forecast to continue to decline until 2021, until it returns to growth. However, the Company expects both mining and infrastructure to increase demand for construction materials in the near term. Capacity expansion in iron ore and gold production, along with the reopening of nickel capacity, will increase the demand for both cement and lime in Western Australia and the Northern Territory.

Outlook

For the balance of 2019, Adelaide Brighton expects demand for construction materials to:

  • Weaken in east coast markets and South Australia, until the commencement of further planned infrastructure projects;
  • Remain stable in the Northern Territory and Western Australia;
  • Improve in the lime business as a result of increased gold and nickel production in Western Australia; and
  • Increase in concrete and aggregates due to more available work days, seasonality and volumes generated via Scotchy Pocket quarry.

Auction clearance rates in Sydney and Melbourne have improved but sales volumes remain low. We have witnessed recent improvement in consumer attitudes towards housing investment but whether this translates into increased activity will depend on:

    • APRA’s macro-prudential controls on bank lending;

Australia Housing Credit

  • The global economy;
  • Impact of the trade war on China’s economy; and
  • Domestic employment prospects.

Australia Unemployment & Underemployment

ASX: Dead cat bounce

The ASX 200 found support at 6450/6500 followed by a hesitant rally: a candle with a long tail followed by a short-bodied evening star. This resembles a typical dead cat bounce. Breach of 6450 is likely and would warn of a decline to test support at 6000.

ASX 200

Gerard Minack in a recent report suggested that Australia is likely to go into recession if the saving ratio increases. For the past few years, consumption has been growing at a faster rate than disposable income as households dig into savings to maintain their lifestyle.

Australia: Consumption, Disposable Income & Saving

Households may continue this behavior because of the wealth-effect (they feel asset-rich but cash-poor) but are likely to reverse sharply if housing and equity prices fall. Which is what we are witnessing at present.

Australia: Housing Prices

In our view, the housing decline is likely to continue despite the RBA cutting rates. While rates may be attractive, job prospects are looking shaky. Loan approvals are falling.

Australia: Housing Loans

Business investment is falling.

Australia: Business Investment

Job ads are about to go over a cliff. Trade tensions with China will add to our woes.

Australia: Job Ads

Public funded infrastructure construction is slumping.

Australia: Public Construction

Credit and broad money supply growth are approaching 2009 GFC lows.

Australia: Credit & Broad Money

And our iron ore tailwind is dying fast. Iron ore spot prices have fallen off a cliff. Breach of support at 95 is likely and would warn of another decline to test support at 80.

Iron Ore

I plan to further increase the level of cash in our Australian Growth portfolio.

Employment lifts but S&P 500 tentative

Growth in total non-farm payrolls ticked up to 1.76% for the 12 months to April 2019, supporting Fed reluctance to cut interest rates.

Payroll Growth

The Philadelphia Fed Leading Index has been revised upwards, above a comfortable 1.0%.

Leading Index

Real GDP growth came in at a healthy 3.2% for the 12 months ended 31 March 2019 but growth in total hours worked sagged to 1.47%, suggesting that GDP growth is likely to slow.

Real GDP and Total Hours Worked

Growth in average hourly earnings came in at 3.23% (total private), suggesting that inflationary pressures remain under control. Little chance of a Fed rate hike either.

Average Hourly Earnings

The S&P 500 retracement respected support at 2900. Rising Money Flow indicates buying pressure but gains seem tentative.

S&P 500

US growth looks to continue but commodity prices warn that global growth is slowing.

Nymex crude penetrated its lower trend channel, warning of a correction. Despite the supply impact of increasing sanctions on Iran and Venezuela, and the threat of supply disruption in Libya.

Nymex Light Crude

A similar correction on DJ-UBS Commodities index reinforces that global demand is slowing.

DJ-UBS Commodities Index

Australia: Job gains

ABS June figures reflect solid gains for the labor market. Justin Smirk at Westpac writes:

“….The annual pace of employment growth has lifted from 0.9%yr in February to 2.0%yr in May and it held that pace in June. In the year to Feb there was a 106.9k gain in employment; in the year to June this has lifted to 240.2k. The Australian labour market went through a soft patch in 2016 that was particularly pronounced through August to November when the average gain in employment per month was a paltry 2.2k. We have clearly bounced out of this soft patch and now holding a firmer trend.”

My favorite measure, monthly hours worked, jumped (year-on-year) by 3.1%.

Monthly Hours Worked

Infrastructure spending, particularly in NSW and Victoria, is doing its best to offset weakness in other areas.

Wage rate growth remains subdued, indicating little pressure on the RBA to lift rates.

Monthly Hours Worked

Australia’s economic growth is slowing.

Employment and Participation rates are falling.

Australia Employment & Participation Rates

Wage rate growth is slowing.

Australia Wage Rates

Slowing wage rate growth and inflation confirm that the economy is faltering.

Australia Underlying Inflation

The RBA, with one eye on the housing bubble, has indicated its reluctance to cut rates further. Increased infrastructure spending by Federal and State governments seems the only viable alternative.

With the motor industry winding down and apartment construction headed for a cliff, this is becoming increasingly urgent.

Gold testing $1100/ounce

Solid job numbers have boosted the prospects for an interest rate hike before the end of the year. Employment is growing steadily, having exceeded its 2008 high by more than 4.2 million new jobs.

Employment and Unemployment

Unemployment is falling as job growth holds above 2.0 percent a year.

Interest Rates and the Dollar

Long-term interest rates are rising, with 10-year Treasury yields headed for a test of resistance at 2.50 percent after breaking through 2.25 percent. Recovery of 13-week Twiggs Momentum above zero indicates an up-trend. Breakout above 2.50 percent would confirm.

10-Year Treasury Yields

The Dollar strengthened in response to rising yields, the Dollar Index breaking resistance at 98. Respect of zero by 13-week Twiggs Momentum indicates long-term buying pressure. Breakout above 100 would confirm another advance, with a target of 107*.

Dollar Index

* Target calculation: 100 + ( 100 – 93 ) = 107

Gold

Gold fell as the Dollar strengthened, testing primary support at $1100/ounce. 13-Week Twiggs Momentum peaks below zero indicate a strong (primary) down-trend. Follow-through below $1080 would signal another decline, with a target of $1000/ounce*.

Spot Gold

* Target calculation: 1100 – ( 1200 – 1100 ) = 1000

Why Fixed Investment is Critical to the US Recovery

The financial sector normally acts as a conduit, channeling savings from private investors to the corporate sector. When the conduit works effectively, the injection of demand from corporate Investment is sufficient to offset the ‘leakage’ from demand caused by Savings. Savings patterns alter during a financial crisis, however, with concerned households cutting back on expenditure and using any surplus to pay down debt, rather than depositing with the bank or buying stocks. Household Savings rise but corporate Investment contracts. The resulting ‘leakage’ from demand causes GDP to spiral downward.

When Investment contracts, unemployment rises. The relationship is evident on the graph below, but it could also be said that Investment rises when employment grows — businesses invest in anticipation of rising demand. Either way, it is safe to conclude that rising investment and job growth go hand-in-hand.

Employment Growth and Private Nonresidential Fixed Investment

Fixed Investment and Corporate Profits

Rising corporate profits also lead to increased investment. The lag on the graph below — investment growth follows profit growth — clearly illustrates the causative relationship.

Employment Growth and Private Nonresidential Fixed Investment

This is an encouraging sign, as the current surge in corporate profits is likely to be followed by rising investment — and further job growth.

Weekly Earnings and GDP

Rising weekly earnings already point to improving aggregate demand and consequent investment growth.

Weekly Earnings Growth

All that is missing is for the federal government to increase investment in productive* infrastructure to further boost job growth.

*Infrastructure investment needs to generate a sufficient return to repay debt incurred to fund the spending. Something many politicians seem to forget when preoccupied with buying votes for the next election.

More….

The Long War [podcast]

The Impunity Trap by Jeffrey D. Sachs | Project Syndicate

RIP ZIRP | PIMCO

How much longer can the global trading system last? | Michael Pettis

Crude retraces

Gold breaks $1180 support

Itzhak Perlman: Schindler’s List (video)

There are two kinds of discontented in this world, the discontented that works and the discontented that wrings its hands. The first gets what it wants and the second loses what it has. There is no cure for the first but success and there is no cure at all for the second.

~ Og Mandino