Bear market – brief respite

North America

The S&P 500 is retracing to test short-term support at 2000. Failure would warn of another test of support at 1870, while respect would indicate continuation of the bear rally to test resistance at the high of 2130. Bullish divergence on 21-day Twiggs Money Flow indicates (medium-term) buying pressure. The market remains bearish, however, having broken primary support at 2000, and respect of 2130 would warn of another test of support at 1870.

S&P 500 Index

* Target calculation: 2000 + ( 2000 – 1870 ) = 2130

The CBOE Volatility Index (VIX) below 20 indicates market risk is easing. We need to remain vigilant for the next few weeks. At least until we see a peak below 20.

S&P 500 VIX

NYSE short sales remain subdued.

NYSE Short Sales

Dow Jones Industrial Average similarly retraced to test support at 17000 on the weekly chart. 13-Week Twiggs Money Flow holding above zero indicates buying pressure. Respect of support would again indicate a rally to test the previous high (18300), failure would warn of another test of primary support at 16000.

Dow Jones Industrial Average

Canada’s TSX 60 respected resistance at 825. Reversal below 800 would warn of another decline; breach of 775 would confirm. Weak 13-week Twiggs Momentum, below zero, signals the market is still bearish.

TSX 60 Index

* Target calculation: 775 – ( 825 – 775 ) = 725

Europe

Germany’s DAX remains weak, with the index retracing to test support at 10000 and 13-week Twiggs Money Flow below zero. Reversal below 10000 is likely and would warn of another decline; follow-through below 9500 would confirm. Recovery above 10500 is unlikely but would indicate continuation of the bear rally.

DAX

The Footsie is more resilient, with 13-week Twiggs Money Flow holding above zero. The index respected resistance at 6500 and is retracing to test short-term support at 6250. Respect is more likely and would suggest another test of 6500. Reversal below 6000 is unlikely, but would confirm the primary down-trend.

FTSE 100

Asia

The Shanghai Composite Index rallied off government-enforced support at 3000. But the rally is likely to be short-lived and recovery above 3500 unlikely.

Dow Jones Shanghai Index

Hong Kong’s Hang Seng Index is retracing to test support at 22500 after a similar bear rally. Respect of 22500 would indicate another test of 24000, but breach of support is more likely and would warn of another test of primary support at 21000.

Hang Seng Index

Japan’s Nikkei 225 encountered resistance at 18500. Gradual decline on 13-week Twiggs Money Flow suggests a secondary correction, with long-term buying pressure continuing. Recovery above 19000 would indicate another test of 21000.

Nikkei 225 Index

* Target calculation: 19000 + ( 19000 – 17000 ) = 21000

India’s Sensex is retracing to test support at 26500. The 13-week Twiggs Money Flow trough above zero, however, indicates strong buying pressure and respect of support at 26500 would indicate continuation of the rally. Reversal below 26000 is unlikely, but would confirm a primary down-trend.

SENSEX

Australia

The ASX 200 retreated from resistance at 5250/5300. Rising 13-week Twiggs Money Flow, however, indicates medium-term buying pressure. A higher trough above 5000 would strengthen the signal. Breakout above 5300 would signal continuation of the bear rally to test the descending trendline. The bear market continues despite recent support and breach of 5000 would confirm a primary down-trend.

ASX 200

* Target calculation: 5000 – ( 5400 – 5000 ) = 4600


Being powerful is like being a lady. If you have to tell people you are, you aren’t.

~ Margaret Thatcher

Bear Rally

North America

Construction activity continues to advance. The graph below shows Total US Construction Spending adjusted for inflation (Core CPI). Spending is substantially below the 2004 to 2007 property bubble but equates to the earlier Dotcom era. The steep rise suggests that rate increases will be necessary to prevent another bubble.

US Construction Spending adjusted by Core CPI

The S&P 500 is testing resistance at 2000. Bullish divergence on 21-day Twiggs Money Flow indicates (medium-term) buying pressure. Recovery above 2000 would signal a relieving rally, with a target (from the double-bottom pattern) of 2130*. The market remains bearish and respect of 2130 would warn of another test of primary support at 1870.

S&P 500 Index

* Target calculation: 2000 + ( 2000 – 1870 ) = 2130

The CBOE Volatility Index (VIX) below 20 indicates market risk is easing. We need to remain vigilant for the next few weeks as VIX can be prone to false breaks.

S&P 500 VIX

NYSE short sales are subdued.

Dow Jones Industrial Average is similarly testing resistance at 17000 on the weekly chart. Breakout would offer a similar target of 18300. Recovery of 13-week Twiggs Money Flow above zero indicates buying pressure. Reversal below 16000 is unlikely, but would confirm a primary down-trend.

Dow Jones Industrial Average

Canada’s TSX 60 recovered above the former primary support level at 800. Follow-through above 820 would signal a relieving rally. Weak 13-week Twiggs Momentum, below zero, warns the market is still bearish.

TSX 60 Index

* Target calculation: 820 + ( 820 – 750 ) = 890

Europe

Germany’s DAX remains weak, with 13-week Twiggs Money Flow below zero. Recovery above 10500 would indicate a bear rally. Only follow-through above 11000 would signal that the down-trend is over.

DAX

The Footsie proved more resilient, respecting support at 6000 with 13-week Twiggs Money Flow holding above zero. Breakout above 6300 indicates a relieving rally, while follow-through above the descending trendline would suggest that the correction is over. Reversal below 6000 is unlikely, but would confirm the primary down-trend.

FTSE 100

Asia

The Shanghai Composite Index continues to test government-enforced support at 3000. Recovery above 3500 is most unlikely.

Dow Jones Shanghai Index

Hong Kong’s Hang Seng Index rallied to test resistance at 22500, while 13-week Twiggs Money Flow recovered above zero. Follow-through above 22500 would indicate another test of 24000. But this remains a bear market and reversal below 22500 would warn of another decline.

Hang Seng Index

Japan’s Nikkei 225 respected primary support at 17000. Gradual decline on 13-week Twiggs Money Flow suggests a secondary correction. Recovery above 19000 would indicate another test of 21000.

Nikkei 225 Index

* Target calculation: 19000 + ( 19000 – 17000 ) = 21000

India’s Sensex followed through above resistance at 26500, indicating a bear rally. Strong buying pressure, signaled by a 13-week Twiggs Money Flow trough above zero, suggests a reversal. Breakout above 28500 would confirm. Reversal below 25000 is unlikely, but would confirm a primary down-trend.

SENSEX

Australia

A monthly chart of the ASX 200 shows the significance of the 5000 support level.

ASX 200 monthly

Rising 21-Day Twiggs Money Flow on the daily chart indicates medium-term buying pressure. Breakout above 5300 would offer a target of 5700. But expect stiff resistance between 5200 and 5300 — already flagged by a tall shadow on today’s candlestick. Breach of 5000 is unlikely at present, but would confirm a primary down-trend.

ASX 200

* Target calculation: 5000 – ( 5400 – 5000 ) = 4600


More….

Crude: Another bear rally

Gold down-trend continues

Sen. John McCain on Russia’s airstrikes in Syria

Paddleboarding with whales

Deleveragings go on for about 15 years. The process of raising debt relative to incomes goes on for 30 or 40 years, typically. There’s a last big surge, which we had in the two years from 2005 to 2007 and from 1927 to 1929, and in Japan from 1988 to 1990, when the pace becomes manic. That’s the classic bubble. And then it takes about 15 years to adjust.

~ Ray Dalio, Bridgewater Associates

Bears out in force

Bears continue to dominate equity markets. Patches of support are visible across North America, Europe and Asia but this is likely to be a secondary rally rather than a trend change.

The Russian bear is also playing up. This time in Syria. Senator John McCain sums up the escalating crisis in the Middle East in this 15-minute video.

North America

The S&P 500 respected support between 1870 and 1900, rallying toward another test of resistance at 2000. The 21-day Twiggs Money Flow peak just above zero continues to indicate (medium-term) selling pressure. Recovery above 2000 is unlikely, but would signal a relieving rally. Breach of support at 1870 would confirm the primary down-trend.

S&P 500 Index

* Target calculation: 1900 – ( 2000 – 1900 ) = 1800

The CBOE Volatility Index (VIX) holding above 20 indicates elevated market risk.

S&P 500 VIX

NYSE short sales remain subdued.

Dow Jones Industrial Average is testing support at 16000. Long tails on the last two weekly candles and recovery of 13-week Twiggs Money Flow above zero indicate strong support. Breach of 16000 would confirm a primary down-trend but we are likely to see a (secondary) bear rally beforehand.

Dow Jones Industrial Average

Bellwether transport stock Fedex continues to warn of a contraction in economic activity.

Fedex

And retail sales growth remains subdued.

Retail Sales and Core CPI

A long tail on Canada’s TSX 60 indicates continued support despite the breach of 790. Declining 13-week Twiggs Momentum below zero indicates a primary down-trend. Recovery above 820 is unlikely, but would suggest a bear trap.

TSX 60 Index

* Target calculation: 800 – ( 900 – 800 ) = 700

Europe

Germany’s DAX signals a primary down-trend, but appears to have found secondary support at 9500. Recovery of 13-week Twiggs Money Flow above zero would suggest a bear rally.

DAX

The Footsie found strong support at 6000, with long tails and 13-week Twiggs Money Flow recovering above zero. Penetration of the descending trendline is unlikely but would warn of a bear trap. Breach of support at 6000 is more likely and would confirm the primary down-trend.

FTSE 100

Asia

The Shanghai Composite Index continues to test government-enforced support at 3000. Recovery above 3500 is most unlikely. Breach of 3000 would warn of another sharp sell-off.

Dow Jones Shanghai Index

Hong Kong’s Hang Seng Index broke support at 21000, confirming the primary down-trend — signaled earlier by 13-week Twiggs Money Flow.

Hang Seng Index

Japan’s Nikkei 225 is testing primary support between 16500 and 17000. Gradual decline on 13-week Twiggs Money Flow suggests a secondary correction, but reversal of 13-week Momentum below zero warns of a primary down-trend. Breach of 16500 would confirm.

Nikkei 225 Index

* Target calculation: 17500 – ( 19000 – 17500 ) = 16000

India’s Sensex found support at 25000 before testing resistance at 26500. 13-Week Twiggs Money Flow trough above zero indicates strong buying pressure. Recovery above 26500 would warn of a bear trap. Reversal below 25000 is less likely, but would confirm the primary down-trend.

SENSEX

* Target calculation: 25000 – ( 26500 – 25000 ) = 23500

Australia

The ASX 200 also shows solid support at 5000, with rising 21-Day Twiggs Money Flow indicating medium-term buying pressure. Recovery above 5200 would indicate a bear rally. Breach of 5000 remains likely, however, and would confirm the primary down-trend.

ASX 200

* Target calculation: 5000 – ( 5400 – 5000 ) = 4600


More….

Gold and Treasury yields decline as inflation weakens

Sen. John McCain on Russia’s airstrikes in Syria

Japan abandons Fed-style inflation targeting and targets GDP growth instead

Deflation supercycle is over as world runs out of workers | Telegraph

Australia: Latest SMSF statistics | FINSIA

I think anybody who is a great investor, a good investor, a successful investor has to be a person who can be both aggressive and defensive….. have enough fear to have the caution. But you can’t let the fear control you.

~ Ray Dalio, Bridgewater Associates

Beware of the Bear

This time it’s not the Russian bear but stock market bears that we need to beware of. Signals across global markets warn of a major down-turn.

North America

The S&P 500 respected resistance at 2000, the false break warning of a bull trap. A 21-day Twiggs Money Flow peak just above zero indicates (medium-term) selling pressure. Recovery above 2000 is unlikely, but would signal a relieving rally. Breach of support at 1870 would confirm the primary down-trend.

S&P 500 Index

* Target calculation: 1900 – ( 2000 – 1900 ) = 1800

The CBOE Volatility Index (VIX) is holding above 20, indicating elevated market risk.

S&P 500 VIX

NYSE short sales spiked up close to 1.2 billion on Friday, September 18th.

NYSE Short Sales

13-Week Twiggs Money Flow crossed below zero on the (S&P 500) weekly chart, warning of a primary down-trend.

S&P 500 Index

Dow Jones Industrial Average is testing support at 16000. Decline of 13-week Twiggs Money Flow below zero warns of a primary down-trend. Breach of 16000 would confirm the signal.

Dow Jones Industrial Average

Canada’s TSX 60 retreated below 790, confirming a primary down-trend. Declining 13-week Twiggs Momentum below zero strengthens the signal.

TSX 60 Index

* Target calculation: 800 – ( 900 – 800 ) = 700

Europe

Germany’s DAX retreated below support at 10000. Decline of 13-week Twiggs Money Flow below zero again warns of a primary down-trend.

DAX

The Footsie is in a similar position, with 13-week Twiggs Money Flow below zero. Breach of support at 6000 would confirm a primary down-trend.

FTSE 100

Asia

The Shanghai Composite Index continues to test (government-backed) support at 3000. Recovery above 3500 is most unlikely. Breach of 3000 would warn of a sharp sell-off.

Dow Jones Shanghai Index

Hong Kong’s Hang Seng Index bear rally failed and the index is again testing support at 21000. Breach would confirm the primary down-trend signaled by 13-week Twiggs Money Flow.

Hang Seng Index

Japan’s Nikkei 225 is having difficulty breaking resistance at 19000. Gradual decline on 13-week Twiggs Money Flow suggests medium-term selling pressure, but reversal of 13-week Momentum below zero warns of a primary down-trend.

Nikkei 225 Index

* Target calculation: 17500 – ( 19000 – 17500 ) = 16000

India’s Sensex respected resistance at 26500. Reversal below 25000 would confirm a primary down-trend. 13-Week Twiggs Money Flow holding above zero indicates medium-term buying pressure.

SENSEX

But 13-week Twiggs Momentum below zero warns of a primary down-trend.

SENSEX

* Target calculation: 25000 – ( 26500 – 25000 ) = 23500

Australia

The ASX 200 also displays medium-term buying pressure, with rising 21-Day Twiggs Money Flow. But this is unlikely to withstand global bearish forces. Breach of 5000 would confirm a primary down-trend. Recovery above 5300 is most unlikely, but would indicate a bear rally.

ASX 200

* Target calculation: 5000 – ( 5400 – 5000 ) = 4600


More….

Gold: No safety here

Crude at $30 per barrel?

Deflation supercycle is over as world runs out of workers | Telegraph

Australia: Latest SMSF statistics | FINSIA

Deleveragings go on for about 15 years. The process of raising debt relative to incomes goes on for 30 or 40 years, typically. There’s a last big surge, which we had in the two years from 2005 to 2007 and from 1927 to 1929, and in Japan from 1988 to 1990, when the pace becomes manic. That’s the classic bubble. And then it takes about 15 years to adjust.

~ Ray Dalio, Bridgewater Associates

Will the Fed hike rates?

The market eagerly awaits the decision of the Fed Open Market Committee (FOMC) on whether to lift the target interest rate (FFR) from its 0.00 – 0.25 percent range maintained since the dark days of 2008.

Core CPI

Core CPI remains subdued at 1.83 percent for the 12 months to August — close to its 2 percent target — so there is no urgency to increase rates despite a strengthening job market.

The act of revising the target rate is largely symbolic. There is no doubt that the economy can withstand an increase in the Fed Funds Rate to 0.5%. But commencement of a tightening cycle may scare an already jittery market. There is a fairly equal split amongst economists as to whether the Fed should proceed with the rate rise or not. My guess is that the Fed will opt for a bet each way, with a wider target range (say 0.00 to 0.50 percent) or a reduced increment (say 0.10 to 0.30 percent). The effective FFR is currently sitting at 0.14 percent and I am sure the Fed’s plan is to continue with a gradual increase over time and no sudden movements.

Effective Fed Funds Rate

The S&P 500 is testing resistance at 2000 after a higher trough and rising 21-day Twiggs Money Flow indicate buying pressure. Recovery above 2000 would signal a relieving rally, while respect of resistance would suggest another test of support at 1900.

S&P 500 Index

* Target calculation: 1900 – ( 2000 – 1900 ) = 1800

The CBOE Volatility Index (VIX) indicates market risk is declining.

S&P 500 VIX

NYSE short sales are also declining.

NYSE Short Sales

Dow Jones Industrial Average closed above resistance at 16700. Follow-through after the FOMC decision would confirm a relieving rally. Reversal below 16600 would warn of another test of 16000. Failure of support at 16000 is unlikely, but would signal a primary down-trend. Recovery of 21-day Twiggs Money Flow above zero indicates medium-term buying pressure.

Dow Jones Industrial Average

Canada’s TSX 60 recovered above 800, indicating solid support between 790 and 800. Recovery above 820 and the descending channel would signal that the correction has ended. Rising 13-week Twiggs Momentum would strengthen the signal, while recovery above zero would confirm.

TSX 60 Index

* Target calculation: 800 – ( 900 – 800 ) = 700

Europe

Germany’s DAX found support at 10000. Recovery above 10500 would suggest a relieving rally, but only follow-through above the descending trendline and resistance at 11000 would confirm. Respect of the zero line by 13-week Twiggs Money Flow is a bullish sign; completion of a trough above zero would confirm long-term buying pressure.

DAX

The Footsie similarly found support at 6000. Recovery above 6300 would indicate a relieving rally. Penetration of the descending trendline would confirm.

FTSE 100

Asia

The Shanghai Composite Index continues to test (enforced) support at 3000. Recovery above 3500 is unlikely, but would indicate that the crisis has passed.

Dow Jones Shanghai Index

Hong Kong’s Hang Seng Index found support at 21000 and is likely to test the former primary support level at 23000. 13-Week Twiggs Money Flow below zero indicates long-term selling pressure, but recovery above zero would suggest a false signal. Breakout above 23000 and the descending trendline is unlikely, but would signal that the down-trend is over.

Hang Seng Index

Japan’s Nikkei 225 found support at 17500. Recovery above 19000 would signal a rally to test resistance at 21000. The gradual decline on 13-week Twiggs Money Flow suggests medium-term selling pressure rather than a primary (long-term) shift.

Nikkei 225 Index

* Target calculation: 19000 + ( 19000 – 17500 ) = 20500

India’s Sensex is headed for a test of the new resistance level at 26500. The primary trend is downward. Respect of the zero line by 13-week Twiggs Money Flow indicates medium-term buying pressure. Recovery above 26500 is unlikely, but would warn of a bear trap. Respect of resistance remains more likely and would suggest another decline.

SENSEX

* Target calculation: 25000 – ( 26500 – 25000 ) = 23500

Australia

The ASX 200 continues to test primary support at 5000. 21-Day Twiggs Money Flow oscillating around zero indicates uncertainty. Breach of 5000 would confirm a primary down-trend. Recovery above 5300 is less likely, but would indicate a bear rally.

ASX 200

* Target calculation: 5000 – ( 5400 – 5000 ) = 4600

Just a word of caution. Relieving rallies can (and often do) fail. Probability of a continued primary up-trend will only improve once support levels have been tested. Early movers always face greater uncertainty. Which is why our long-term portfolios continue to hold high levels of cash.


More….

Why Europe Failed

Not much wrong with the US economy

NYSE short sales easing

Marcus Miller & Eric Clapton [music]

You really wonder why leaders want these jobs when they really do not want to lead. And what is their risk? That Barack Obama will not get a second term? Or that Angela Merkel’s coalition might finally end up on the rocks? If they actually made the leap they might astound themselves. Because, in the end, everyone in political life gets carried out — the only relevant question is whether the pallbearers will be crying.

~ Paul Keating, 24th Prime Minister of Australia (2011)

S&P 500: Market risk remains elevated

NYSE daily volume and short sales declined Thursday & Friday, indicating selling pressure is easing.

NYSE Daily Volume & Short Sales

There is no sign yet on the daily chart, however, with 21-day Twiggs Money Flow respecting the zero line from below. Breach of support at 1900 would warn of another decline. Follow-through below 1870 would confirm. Recovery above 2000 is unlikely at present, but would suggest that the correction is over.

S&P 500

Daily VIX indicates market risk remains elevated.

VIX

The market is closed Monday 7th for Labor Day.

A bad case of the ‘nineties

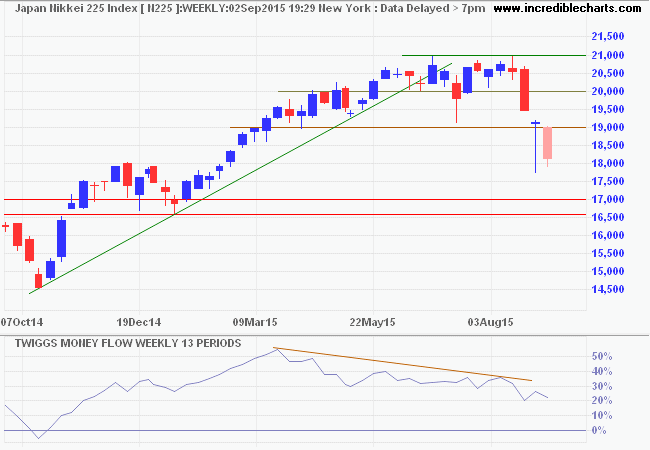
The 1990s featured two significant upheavals in global financial markets. First, 1990 saw the Nikkei collapse from its high of 39000, reaching an eventual low of 7000 in 2008.

Nikkei 225 Index

The collapse followed strong appreciation of the Yen after the September 1985 Plaza Accord and the ensuing October 1987 global stock market crash. The Plaza Accord attempted to curtail long-term currency manipulation by Japan who had built up foreign reserves — mainly through purchases of US Treasuries — to suppress appreciation of the Yen against the Dollar and maintain a current account surplus.

Seven years later, collapsing currencies during the 1997 Asian financial crisis destroyed fast-growing economies — with Thailand, South Korea and Indonesia experiencing 40%, 34% and 83% falls in (1998) GNP respectively — and eventually led to the 1998 Russian default and break up of the Soviet Union. Earlier, rapidly growing exports with currencies pegged to the Dollar brought a flood of offshore investment and easy credit into the Asian tigers. Attempts by the IMF to impose discipline and a string of bankruptcies spooked investors into a stampede for the exits. Falling exchange rates caused by the stampede led to a further spate of bankruptcies as domestic values of dollar-denominated debt skyrocketed. Attempts by central banks to shore up their currencies through raising interest rates failed to stem the outflow and further exacerbated the disaster, causing even more bankruptcies, with borrowers unable to meet higher interest charges.

What we are witnessing is a repeat of the nineties. This time it was China that attempted to ride the dragon, pegging its currency against the Dollar and amassing vast foreign reserves in order to suppress appreciation of the Yuan and boost exports. The Chinese economy benefited enormously from the vast trade surplus with the US, but those who live by the dragon die by the dragon. Restrictions on capital inflows into China may dampen the reaction, compared to the 1997 crisis, but are unlikely to negate it. The market will have its way.

Financial markets in the West are cushioned by floating exchange rates which act as an important shock-absorber against fluctuations in financial markets. The S&P 500 fell 13.5% in 1990 but only 3.5% in October 1997. The ensuing collapse of the ruble and failure of LTCM, however, caused another fall of 9.0% a year later. Not exactly a crisis, but unpleasant all the same.

North America

The domestic US economy slowed in the past few months but increased spending on light motor vehicles and housing suggested that robust employment growth would continue. Upheaval in financial markets (and exports) now appears likely to negate this, leading to a global market down-turn.

The S&P 500 breached primary support at 1980, signaling a primary down-trend. The index has fallen 4.5% from its earlier high and presents a medium-term target of 1830*. Decline of 13-week Twiggs Money Flow below zero would confirm the signal but descent has been gradual, suggesting medium-rather than long-term selling pressure.

S&P 500 Index

* Target calculation: 1980 + ( 2130 – 1980 ) = 1830

The CBOE Volatility Index (VIX) spiked upwards indicating rising market risk.

S&P 500 VIX

Bellwether transport stock Fedex broke primary support at $164, confirming the primary down-trend signaled by 13-week Twiggs Money Flow reversal below zero. The fall warns of declining economic activity.

Fedex

Canada’s TSX 60 broke primary support at 800, confirming the earlier bear signal from 13-week Twiggs Momentum reversal below zero. Target for a decline is 700*.

TSX 60 Index

* Target calculation: 800 – ( 900 – 800 ) = 700

Europe selling

Germany’s DAX broke medium-term support at 10700. Expect further medium-term support at 10000 but reversal of 13-week Twiggs Money Flow below zero warns of selling pressure. Breach of 10000 would indicate a test of primary support at 9000.

DAX

* Target calculation: 10700 – ( 11800 – 10700 ) = 9600

The Footsie broke 6450, signaling a test of primary support at 6100. Reversal of 13-week Twiggs Money Flow below zero warns of (long-term) selling pressure. Breach of 6100 would offer a target of 5000**.

FTSE 100

* Target calculation: 6450 – ( 6800 – 6450 ) = 6100 **Long-term: 6000 – ( 7000 – 6000 ) = 5000

Asia

The Shanghai Composite reflects artificial, state-backed support at 3500. Declining 13-week Twiggs Money Flow warns of long-term selling pressure. Withdrawal of government support is unlikely, but breach of 3400/3500 would cause a nineties-style collapse in stock prices.

Shanghai Composite Index

* Target calculation: 4000 – ( 5000 – 4000 ) = 3000

Japan’s Nikkei 225 appears headed for a test of 19000. Breach would test primary support at 17000 but, given the scale of BOJ easing, respect is as likely and would indicate further consolidation between 19000 and 21000. Gradual decline of 13-week Twiggs Money Flow suggests medium-term selling pressure.

Nikkei 225 Index

* Target calculation: 21000 + ( 21000 – 19000 ) = 23000

India’s Sensex is holding up well, with rising 13-week Twiggs Money Flow signaling medium-term buying pressure. Breakout above 28500 is unlikely but would indicate another test of 30000. Decline below 27000 would warn of a primary down-trend; confirmed if there is follow-through below 26500.

SENSEX

Australia

Commodity-rich Australian stocks are exposed to China and emerging markets. The only protection is the floating exchange rate which is likely to adjust downward to absorb the shock — as it did during the 1997 Asian crisis. 13-Week Twiggs Money Flow below zero warns of (long-term) selling pressure on the ASX 200. Breach of support at 5150 is likely and would confirm a primary down-trend. Long-term target for the decline is 4400*. Respect of primary support is unlikely, but would indicate consolidation above the support level rather than a rally.

ASX 200

Signs of improvement

Earnings results for the second quarter of 2015 remain on track. Of the 354 stocks in the S&P 500 that have reported, 252 (71%) beat, 26 met and 76 (21%) missed their estimates.

The S&P 500 has lost momentum since March 2015, consolidating below resistance at 2130. Gradual decline of 13-week Twiggs Money Flow suggests buyers remain interested and this is a secondary formation. Breakout above 2130 would signal an advance to 2200*, but there is no indication that this is imminent. Reversal below support at 2040/2050 is unlikely, but penetration of the rising trendline would warn of a reversal — confirmed if support at 1980/2000 is breached.

S&P 500 Index

* Target calculation: 2130 + ( 2130 – 2050 ) = 2210

Dow Jones Industrial Average is weaker than the S&P 500. Breach of support at 17500 would test primary support at 17000. Reversal of 13-week Twiggs Money Flow below zero would warn of selling pressure.

Dow Jones Industrial Average

The CBOE Volatility Index (VIX) remains low — typical of a bull market.

S&P 500 VIX

Canada’s TSX 60 broke through the upper trend channel, suggesting the correction is over. Follow-through above 875 would indicate another test of 900. Recovery of 13-week Twiggs Momentum above zero would strengthen the signal.

TSX 60 Index

Europe improving

Germany’s DAX respected support at 11000. Follow-through above 11800 would indicate another test of 12400. Rising 13-week Twiggs Money Flow indicates medium-term buying pressure.

DAX

* Target calculation: 12500 + ( 12500 – 11000 ) = 14000

The Footsie similarly respected support at 6500. Follow-through above 6800 would complete a double bottom reversal, indicating a test of 7100. A 13-week Twiggs Money Flow trough above zero flags buying pressure.

FTSE 100

* Target calculation: 7000 + ( 7000 – 6500 ) = 7500

Asia

The Shanghai Composite continues to reflect selling pressure with declining 13-week Twiggs Money Flow. Withdrawal of government support is unlikely, but would cause a breach of 3400/3500.

Shanghai Composite Index

* Target calculation: 4000 – ( 5000 – 4000 ) = 3000

Japan’s Nikkei 225 is respected support at 20000, indicating another test of 21000. Breakout above 21000 would offer a target of 23000*. Decline of 13-week Twiggs Money Flow has leveled off. Reversal below support at 20000 is unlikely but would warn of another test of 19000.

Nikkei 225 Index

* Target calculation: 21000 + ( 21000 – 19000 ) = 23000

A higher trough on India’s Sensex suggests buying pressure. Rising 13-week Twiggs Money Flow confirms. Breakout above 28500 would signal another test of 30000. Decline below 27000 is unlikely.

SENSEX

Australia

The ASX 200 encountered stubborn resistance at 5700. Rising troughs on 21-day Twiggs Money Flow continue to indicate buying pressure. Respect of support at 5550 would be bullish, while breakout above 5700 would indicate another test of 6000. Failure of 5550 is less likely, but would test medium-term support at 5400.

ASX 200

I find the idea that you can introduce democracy by military force a very quaint idea. Moreover, if I wanted to choose a testing ground for doing it, Iraq would be the last nation I would choose.

~ George Soros (2004)