S&P 500 bullish, Nasdaq tests resistance

After early skittishness over some dud Institute for Supply Management (ISM) data, the S&P 500 recovered lost ground by the close. Expect an advance to 1950*. Rising 21-day Twiggs Money Flow troughs above zero indicate strong medium-term buying pressure. Reversal below 1900 is unlikely, but would warn of a correction.

S&P 500

* Target calculation: 1850 + ( 1850 – 1750 ) = 1950

CBOE Volatility Index (VIX) below 12 indicates low risk typical of a bull market.

VIX Index

The Nasdaq 100 is testing resistance at 3740/3750. Breakout would signal an advance to 4000*. Rising 21-day Twiggs Money Flow troughs above zero again indicate strong medium-term buying pressure. Reversal below 3700, however, would warn of another correction.

Nasdaq 100

* Target calculation: 3700 + ( 3700 – 3400 ) = 4000

S&P 500: A beautiful breakout

Heart-warming to see S&P 500 breakout above 1900, with the candle gapping through the resistance level. Expect an advance to 1950*. Completion of a 21-day Twiggs Money Flow trough above zero indicates strong buying pressure. Reversal below 1870 is most unlikely, but would warn of a bull trap (and correction to test primary support at 1750).

S&P 500

* Target calculation: 1850 + ( 1850 – 1750 ) = 1950

CBOE Volatility Index (VIX) below 12 signals low risk typical of a bull market.

VIX Index

China’s export dilemna

Growth in value of exports from China has slowed to single figures since 2012. It will be difficult sustain current GDP growth if this trend continues.

China Exports

The Harper Petersen index of shipping rates for container vessels, the Harpex, remains near its 2010 low, reflecting continued weakness in Asian manufactured goods exports (a rise in exports from Europe or North America would be absorbed by the high percentage of containers returned empty to Asia on the round trip).

US Imports from China

Rising Australian bulk commodity exports reflect the disconnect between Chinese imports and exports, with vast investment in infrastructure and rising stockpiles of raw materials used to sustain economic growth. But diminishing marginal returns on further infrastructure and housing investment mean failed recovery of manufactured goods exports would lead to a hard landing.

Australian Bulk Commodity Exports

A key factor will be the strength of the RMB against the US Dollar. Ambrose Evans-Pritchard suggests that China will meet strong resistance in its attempts to export its deflation to the West. Treasury’s forex report to Congress (April 2014) highlight’s sensitivity toward further exchange rate manipulation:

In China, the RMB appreciated during 2013 on a trade-weighted basis, but not as fast or by as much as is needed, and large-scale intervention resumed. The RMB appreciated by 2.9 percent
against the dollar in 2013. However, as a result of the depreciation of the yen and many emerging market currencies, the RMB strengthened more on a trade-weighted basis, with the RMB’s nominal and real effective exchange rates rising 7.2 and 7.9 percent, respectively. For most of 2013 the RMB exchange rate was at, or very near, the most appreciated edge of the daily trading band, suggesting continuous pressure for greater RMB appreciation. During 2014, however, the exchange rate has reversed direction, depreciating by a marked 2.68 percent year to date.

There are a number of continuing signs that the exchange rate adjustment process remains incomplete and the currency has further to appreciate before reaching its equilibrium value. China continues to generate large current account surpluses and attracts large net inflows of foreign direct investment; China’s current account surplus plus inward foreign direct investment in 2013 exceeded $446 billion. The reduction in the current account surplus as a share of China’s GDP has largely been the reflection of the unsustainably rapid pace of investment growth. Finally, China has continued to see rapid productivity growth, which suggests that continuing appreciation is necessary over time to prevent the exchange rate from becoming more undervalued. All of these factors indicate a RMB exchange rate that remains significantly undervalued. Further exchange rate appreciation would help to smoothly rebalance the Chinese economy away from investment toward consumption.

The Chinese authorities have been unwilling to allow an appreciation large enough to bring the currency to market equilibrium, opting instead for a gradual adjustment which has now been partially reversed . The expectation that the RMB would continue to appreciate over time resulted in large and increasing capital inflows in 2013. The PBOC’s policy of gradual adjustment triggered expectations of continued appreciation, and resulted in large-scale foreign exchange intervention. China’s foreign exchange reserves increased sharply in 2013, by $509.7 billion, which was a record for a single year. China has continued large-scale purchases of foreign exchange in the first quarter of this year, despite having accumulated $3.8 trillion in reserves, which are excessive by any measure. This suggests continued actions to impede market determination.

In short, China has been buying US Treasurys as a form of vendor financing, allowing them to export to the US while preventing the RMB from appreciating to its natural, market-clearing level against the Dollar. The fact that they are attempting to disguise this manipulation, using third parties, means that Congress is unlikely to tolerate further suppression of the RMB against the Dollar and will be forced to take action.
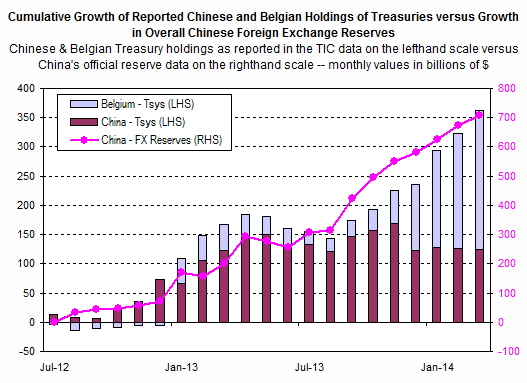
Is China hiding its FX reserves in...Belgium?

Feared sales of US Treasury investments by China, leading to a collapse of the Dollar, are most unlikely and would be a death knell for Chinese exports. Reversal of capital flows would cause rapid appreciation of the RMB against the Dollar, up-ending China’s former competitive advantage and boosting US exports.

Even without a reduction of existing Treasury holdings, appreciation of the RMB against the Dollar and Euro appears inevitable. This would be disastrous for China, causing them to forfeit their competitive advantage in export markets. And without access to the level of technology and global branding enjoyed by their Western counterparts, Chinese exporters are likely to struggle to hold existing markets, let alone achieve further growth. With diminishing returns on infrastructure and housing investment, China could soon run out of options to stimulate its economy. And its path as a global economic powerhouse may well follow that of its predecessor, Japan.

Dow 1929 hoax re-visited

Some readers still believe there is a strong resemblance between the Dow 1929 crash and the current Dow Jones Industrial Average. I thought we had buried that hoax.

Dow Jones

Take a careful look at the two scales on the right of the chart. The scale of the 1929 Dow shows a gain of roughly 200 to 375, or 88% in percentage terms. The scale of the current Dow shows a gain of 12000 to 16500, or roughly 38%. In short, the scales are not proportionate and have been adjusted to fit the two curves.

Next, take a look at the time frame of the chart, 1928 to 1929, and compare it to charts with a longer time frame. The curve in the 10-year period leading up to the crash bears no resemblance at all to the last 10 years (2004 – 2014) of the Dow. The chart time frame has also been cropped to display the best fit.

With this kind of careful analysis we could show a close correlation between the 1929 Dow and Justin Bieber’s record sales ……..or crop yields in Iowa.
Dow Jones

Is the market overpriced? Episode V

In my last post I concluded that the same factors driving rising inequality — new technologies and access to cheap labor through increased globalization — may also be driving a sustainable increase in corporate profits. While we may be understandably wary of “this time is different”, consider the following:

The rise of China as a trading partner over the last two decades.

US Imports from China

Corporate profits at 11% of GNP suggest a new paradigm when compared to the historic (normal) range of 5% to 7%.

Corporate Profits/GNP

The decline in employee compensation as a percentage of corporate value added mirrors the rise in corporate profits.

Employee Compensation/Value Added

And Robert Shiller’s CAPE, normally used to argue that the market is currently overpriced. If we stood in 1994 and looked at the range of CAPE values for the past century, we would no doubt have concluded that a CAPE value greater than 20 indicates the market is overpriced. In the last two decades, the CAPE only briefly dipped below 20 at the height of the global financial crisis. Now pundits argue that a CAPE value greater than 25 indicates the market is overpriced. Something has definitely changed.

Shiller CAPE

Whether the change is sustainable, only time will tell. But one thing is clear. Of the 466 corporations who have so far reported earnings for the first quarter 2014, 77% have either beaten (68%) or met (9%) their estimates. Corporate profits are not in imminent danger of collapse.

Is the market over-priced?

In my last post I concluded that the same factors driving rising inequality — new technologies and access to cheap labor through increased globalization — may also be driving a sustainable increase in corporate profits. While we may be understandably wary of “this time is different”, consider the following:

The rise of China as a trading partner over the last two decades.

US Imports from China

Corporate profits at 11% of GNP suggest a new paradigm when compared to the historic (normal) range of 5% to 7%.

Corporate Profits/GNP

The decline in employee compensation as a percentage of corporate value added mirrors the rise in corporate profits.

Employee Compensation/Value Added

And Robert Shiller’s CAPE, normally used to argue that the market is currently overpriced. If we stood in 1994 and looked at the range of CAPE values for the past century, we would no doubt have concluded that a CAPE value greater than 20 indicates the market is overpriced. In the last two decades, the CAPE only briefly dipped below 20 at the height of the global financial crisis. Now pundits argue that a CAPE value greater than 25 indicates the market is overpriced. Something has definitely changed.

Shiller CAPE

Whether the change is sustainable, only time will tell. But one thing is clear. Of the 466 corporations who have so far reported earnings for the first quarter 2014, 77% have either beaten (68%) or met (9%) their estimates. Corporate profits are not in imminent danger of collapse.

Is the market overpriced? Episode IV

In my last post I said that, with interest rates, tax rates and real wages at historic lows, corporations are likely to make fat profits over the next few years and stocks remain reasonably buoyant. But at least one of these factors can be expected to change.

  1. Recovery of the housing market would cause the Fed to lift interest rates;
  2. Revision of the tax code by a President who can work with both sides of the House; or
  3. A dramatic fall in exchange rates placing upward pressure on wages as manufacturers regain export markets.

What I did not emphasize is that none of the above are likely to occur without a strong economic recovery — and the net effect of any change could well be a boost to corporate earnings.

What also dawned on me after reading The Inequality Puzzle by Larry Summers is that there may be a common thread. The impact of new technologies over the last two decades and access to cheap labor through increased globalization may have created a sustainable increase in corporate profits as a percentage of GNP. Could this time really be different? Only time will tell. I will be watching sales growth and profit margins over the next few years with interest.

China Japan threaten further decline

China’s Shanghai Composite Index is testing primary support at 2000. Follow-through below 1990 would signal a decline to 1850*. Reversal of 21-day Twiggs Money Flow below zero would signal medium-term selling pressure. Respect of primary support at 2000, however, would suggest another rally to 2150.

Shanghai Composite Index

* Long-term target calculation: 2000 – ( 2150 – 2000 ) = 1850

Japan’s Nikkei 225 is testing primary support at 14000. 21-Day Twiggs Money Flow below zero indicates medium-term selling pressure. Follow-through below 13900 would confirm a primary down-trend. Respect of primary support is unlikely, but would indicate a rally to 15000.

Nikkei 225

* Target calculation: 14000 – ( 15000 – 14000 ) = 13000

India and Singapore strong

India’s Sensex is likely to retrace to test the new support level after breaking resistance at 24000. Breach of support would warn of a correction back to 23000, with 21-day Twiggs Money Flow (respecting the zero line from below) continuing to warn of medium-term selling pressure. Long term, the primary trend is upward, with 13-week Twiggs Money Flow troughs above zero signaling buying pressure. Respect of support at 24000 would signal another test of 25000.

Sensex

* Target calculation: 21000 + ( 21000 – 16000 ) = 26000

Singapore’s Straits Times Index is testing resistance at 3260. Several long tails on the weekly chart, and recovery of 13-Week Twiggs Money Flow above zero, suggest medium-term buying pressure. Follow through above 3300 would signal a primary advance to 3600*. Respect of resistance is unlikely, but reversal below 3200 would warn of another test of primary support at 3000.

Straits Times Index

* Target calculation: 3300 + ( 3300 – 3000 ) = 3600

The Inequality Puzzle | Lawrence H. Summers

Larry Summers exposes the flaw in Thomas Piketty’s Capital in the Twenty-First Century. Piketty argues that inequality is rising because the rate of return on capital is higher than the economy’s growth rate.

Does not the rising share of profits in national income in most industrial countries over the last several decades prove out Piketty’s argument? Only if one assumes that the only factors at work are the ones he emphasizes. Rather than attributing the rising share of profits to the inexorable process of wealth accumulation, most economists would attribute both it and rising inequality to the working out of various forces associated with globalization and technological change. For example, mechanization of what was previously manual work quite obviously will raise the share of income that comes in the form of profits. So does the greater ability to draw on low-cost foreign labor.

Correlation does not imply causation. The fact that two events occur together does not prove that one has caused the other.

Summers also addresses whether returns on capital are largely reinvested:

A brief look at the Forbes 400 list also provides only limited support for Piketty’s ideas that fortunes are patiently accumulated through reinvestment. When Forbes compared its list of the wealthiest Americans in 1982 and 2012, it found that less than one tenth of the 1982 list was still on the list in 2012, despite the fact that a significant majority of members of the 1982 list would have qualified for the 2012 list if they had accumulated wealth at a real rate of even 4 percent a year. They did not, given pressures to spend, donate, or misinvest their wealth. In a similar vein, the data also indicate, contra Piketty, that the share of the Forbes 400 who inherited their wealth is in sharp decline.

That income inequality is rising is undisputed, but the causes are not as simple as Piketty assumes. His proposal of a progressive tax on wealth is unlikely to see the light of day: the history of inheritance taxes is an indication of their ineffectiveness. But a shift away from income taxes towards land taxes and other flat rate, indirect taxes would provide a significant boost to the economy as illustrated by the following chart from the Henry Review.

Marginal welfare loss from a small increase in selected Australian taxes

Marginal welfare loss is the loss in consumer welfare per dollar of revenue raised for a small increase in each tax (the extent of compensation required to restore consumer satisfaction reflects the distorting effect of the tax on the economy). A decrease in the level of tax, on the other hand, would be likely to produce a similar-sized benefit. So a trade off between taxes at the top of the scale and those at the bottom would be expected to deliver a substantial net benefit.

Read more at Lawrence H. Summers for Democracy Journal: The Inequality Puzzle.