Weak US retail sales belie strong fundamentals

Lucia Mutikani at Reuters writes:

U.S. retail sales barely rose in September and producer prices recorded their biggest decline in eight months, raising further doubts about whether the Federal Reserve will raise interest rates this year. The weak reports on Wednesday were the latest suggestion that the economy was losing momentum in the face of slowing global growth, a strong dollar, an inventory correction and lower oil prices that are hampering capital spending in the energy sector. Job growth braked sharply in the past two months.

Readers of the headline Weak U.S. retail sales, inflation data cloud rate hike outlook could be forgiven for believing the US economy is headed for recession. After all, retail sales growth has slowed to a crawl.

Retail Sales

And the producer price index is declining sharply on the back of lower oil prices.

Producer Price Index

But if we strip out food and energy prices, PPI remains close to the Fed’s 2% inflation target. And low energy prices will eventually feed through as a stimulus to the global economy.

Hourly earnings in the manufacturing sector are starting to grow.

Average Hourly Earnings Growth: Manufacturing and Total Private

Deeper in the Reuters article, we find a more objective view:

“The overall message is that consumer spending has remained extremely strong. If sentiment had indeed shifted, it would be hard to explain why sales of cars, certainly among the more expensive items, jumped in September to their highest level since July 2005,” said Harm Bandholz, chief economist at UniCredit Research in New York.

Light vehicle sales continue their upward trajectory.

Light Vehicle Sales

And construction spending is decidedly bullish.

Construction Spending

Not much here to keep Janet Yellen up at nights. When it comes to rate rises, the sooner we get the economy back on a sound footing the better, I say. Otherwise we encourage further capital misallocation and dependency on Fed stimulus. There are no free lunches from central bankers. Everything comes at a price.

It is always important in matters of high politics to know what you do not know. Those who think they know, but are mistaken, and act upon their mistakes, are the most dangerous people to have in charge.

~ Margaret Thatcher: Statecraft (2002)

Aussie big four banks overpriced

Australia’s big four banks have raised significant amounts of new capital as the realization finally dawned on regulators that they were highly leveraged and likely to act as “an accelerant rather than a shock-absorber” in the next downturn.

Chris Joye writes in the AFR that the big four have raised $36 billion of new capital in the 2015 financial year:

Before Westpac’s $3.5 billion equity issue this week, the big banks had, through gritted teeth, accumulated $27 billion of extra equity over the 2015 financial year through “surprise” ASX issues, underwritten dividend reinvestment plans, asset sales and organic capital generation via retained earnings. If you add in “additional tier one” (AT1) capital issues (think CBA’s $3 billion “Perls VII”), total equity capital originated rises to about $32 billion, or almost $36 billion after Westpac’s effort this week.

The effect of deleveraging is clearly visible on the ASX 300 Banks Index [XBAK].

ASX 300 Banks Index

Having broken primary support, the index is retracing to test resistance at 84. Bearish divergence on 13-week Twiggs Money Flow, followed by reversal below zero, both warn of a primary down-trend. Respect of resistance at 84 would strengthen the signal, offering a (medium-term) target of 68* for the next decline.

* Target calculation: 76 – ( 84 – 76 ) = 68

Matt Wilson, head of financial research at the $10 billion Australian equities shop JCP Investment Partners, says the bad news for those “long” the oligarchs is that “we are still only halfway through the majors’ capital raising process at best”.

Chris calculates the remaining shortfall to be at least $35 billion:

Accounting for future asset growth, I calculated the big banks will need another $35 billion of tier one capital if the regulator pushes them towards a leverage ratio of, say, 5.5 per cent by 2019, which is still well below the 75th percentile peer.

One of the big four’s most attractive features is their high dividend-yield and attached franking credits, but Chris compares this to the far lower dividend payout ratios of international competitors and quotes several sources who believe the present ratios are unsustainable.

JCP’s Wilson does not think payout ratios are sustainable and accuses the big banks of “over-earning”. “Bad debts of 0.15 per cent are running at a 63 per cent discount to the through-the-cycle trend of 0.40 per cent,” he says. “Should we see a normal credit cycle unfold, then payouts will be cut significantly due to the pro-cyclicality of risk-weighted assets calculations and bad debts jumping above trend.”

He concludes:

Aboud [Stephen Aboud, head of LHC Capital Fund] reckons artificially high yields also explain why the big banks’ “2.5 times price-to-book valuations are miles above the 1-1.5 times benchmark of global peers”, which he describes as “a joke”.

Plenty of food for thought.

Read more from Chris Joye at Hedge funds that shorted the big banks | AFR

Niall Ferguson: The Real Obama Doctrine – Real Daily Buzz

Niall Ferguson on US strategy in the Middle East:

Henry Kissinger long ago recognized the problem: a talented vote-getter, surrounded by lawyers, who is overly risk-averse. Even before becoming Richard Nixon’s national security adviser, Henry Kissinger understood how hard it was to make foreign policy in Washington. There “is no such thing as an American foreign policy,” Mr. Kissinger wrote in 1968. There is only “a series of moves that have produced a certain result” that they “may not have been planned to produce.” It is “research and intelligence organizations,” he added, that “attempt to give a rationality and consistency” which “it simply does not have.”

Two distinctively American pathologies explained the fundamental absence of coherent strategic thinking. First, the person at the top was selected for other skills. “The typical political leader of the contemporary managerial society,” noted Mr. Kissinger, “is a man with a strong will, a high capacity to get himself elected, but no very great conception of what he is going to do when he gets into office.”

Second, the government was full of people trained as lawyers. In making foreign policy, Mr. Kissinger once remarked, “you have to know what history is relevant.” But lawyers were “the single most important group in Government,” he said, and their principal drawback was “a deficiency in history.” ……..

It is clear that [Barack Obama’s] strategy is failing disastrously. Since 2010, total fatalities from armed conflict in the world have increased by a factor of close to four, according to data from the International Institute of Strategic Studies. Total fatalities due to terrorism have risen nearly sixfold, based on the University of Maryland’s Study of Terrorism and Responses to Terrorism database. Nearly all this violence is concentrated in a swath of territory stretching from North Africa through the Middle East to Afghanistan and Pakistan. And there is every reason to expect the violence to escalate as the Sunni powers of the region seek to prevent Iran from establishing itself as the post-American hegemon.

Today the U.S. faces three strategic challenges: the maelstrom in the Muslim world, the machinations of a weak but ruthless Russia, and the ambition of a still-growing China. The president’s responses to all three look woefully inadequate……

Some things you can learn on the job, like tending bar or being a community organizer. National-security strategy is different. “High office teaches decision making, not substance,” Mr. Kissinger once wrote. “It consumes intellectual capital; it does not create it.” The next president may have cause to regret that Barack Obama didn’t heed those words. In making up his strategy as he has gone along, this president has sown the wind. His successor will reap the whirlwind. He or she had better bring some serious intellectual capital to the White House.

Source: Niall Ferguson: The Real Obama Doctrine – Real Daily Buzz

Effect of long-term unemployment on the labor participation rate

Alan B. Krueger is Bendheim Professor of Economics and Public Affairs at Princeton University and an NBER research associate. Here he discusses the effect of long-term unemployment on the declining labor participation rate:

….The SIPP [Survey of Income and Program Participation] data indicate that, irrespective of the business cycle, the probability that an unemployed worker will be “steadily” employed in a full-time job for at least four consecutive months a year later is strikingly low and declines further as the duration of joblessness rises. Even in the strong job market of the late 1990s, the chance of a long-term unemployed worker finding steady, full-time employment after a year was only around 20 percent. This likelihood did not change very much during the 2001 recession, and it didn’t change substantially during the Great Recession. Conversely, the likelihood that an unemployed worker will leave the labor force a year later increases substantially as the duration of joblessness rises. According to the SIPP, 35 percent of workers who became long-term unemployed during the Great Recession were out of the labor force by 2013.

Why does long-term unemployment have such an adverse effect on workers? There has been a long, unresolved debate in the economics profession about whether the job finding rate is lower for the long-term unemployed because of either unobserved heterogeneity in the characteristics of such workers or something about the nature of unemployment that adversely changes people. Although this is an inherently difficult question to answer, the literature suggests that duration dependence plays a larger role than unobserved heterogeneity in explaining this phenomenon….. Much research suggests that long-term unemployment has a negative impact on both the supply side and the demand side.

On the supply side, an individual’s mental health and self-esteem can be affected by the experience of long-term unemployment. Till von Wachter has done good work showing that one’s physical health and mortality are adversely impacted by joblessness. Andy Mueller and I did a longitudinal study where we asked workers who were receiving unemployment insurance about the intensity of their job searches. We found that job search activity tends to decline the longer people are unemployed. We also found that the long-term unemployed tend to be socially isolated…… Furthermore, long-term unemployment tends to be associated with repeated job loss and lower re-employment earnings. All of these findings point to a decline in human capital and disengagement from the labor market as a result of long-term unemployment.

On the demand side, studies have shown that employers discriminate – at least statistically – against the long-term unemployed. Kory Kroft, Fabian Lange, and Matt Notowidigdo conducted a study in which they sent out resumes with varying gaps of joblessness, and they found that the likelihood of receiving an interview depended upon the duration of unemployment. Rand Ghayad also found similar results.

My take on the evidence is that the experience of being unemployed makes it harder for people to get back on their feet, and that even a strong economy doesn’t solve this problem. In addition, once a person leaves the labor force, he or she is extremely unlikely to return. The labor force flows data from the CPS bear this out (Figure 6). According to CPS data, the monthly rate for transitioning from out of the labor force to back in the labor force is unrelated to the business cycle. We didn’t see a wave of people returning to the labor force either in the late 1990s or earlier in the 2000s, and we’re not seeing one now……

Conclusion
To conclude, I will briefly comment on policies to address the problem of long-term unemployment. One of the overriding lessons that I take away from this body of research is that, if left untreated, long-term unemployment can have hysteresis-type effects on the labor market. A cyclical recovery does not cure the problems created by long-term unemployment. Going forward, I think one of the lasting legacies of the Great Recession is that the labor force participation rate will be about one percentage point lower than it otherwise would have been. This analysis argues in favor of using “overwhelming force” in a deep recession to prevent those who lose their jobs from becoming long-term unemployed in the first place.

Since long-term unemployment has been so widespread throughout sectors of the economy, “industry-specific” policies are insufficient to solve the problem. In 2012, for example, only 10 percent of long-term unemployed workers were from the construction sector, and only 11 percent were from manufacturing, despite the fact that these industries were hit particularly hard by the Great Recession.

Instead, I would prefer more targeted measures geared specifically toward helping the long-term unemployed stay in the labor force and find employment, such as a tax credit for employers who hire the long-term unemployed or direct employment. There also has been some research to support the notion that volunteering can help jobless workers make new connections, learn new skills, and stay engaged in the labor force. In the United States, job search assistance has typically been found to be effective in helping workers regain employment. I also think wage loss insurance might be worth considering, especially for older long-term unemployed workers.

Lastly, given that many of the long-term unemployed have already left the labor force, we should consider policies that address the structural decline in labor force participation. For example, more family-friendly policies might help greater numbers of women either enter or remain in the labor force. Likewise, reforms to the disability insurance system could possibly prevent some workers from permanently exiting the labor force.

Source: NBER Reporter Online

Bear market – brief respite

North America

The S&P 500 is retracing to test short-term support at 2000. Failure would warn of another test of support at 1870, while respect would indicate continuation of the bear rally to test resistance at the high of 2130. Bullish divergence on 21-day Twiggs Money Flow indicates (medium-term) buying pressure. The market remains bearish, however, having broken primary support at 2000, and respect of 2130 would warn of another test of support at 1870.

S&P 500 Index

* Target calculation: 2000 + ( 2000 – 1870 ) = 2130

The CBOE Volatility Index (VIX) below 20 indicates market risk is easing. We need to remain vigilant for the next few weeks. At least until we see a peak below 20.

S&P 500 VIX

NYSE short sales remain subdued.

NYSE Short Sales

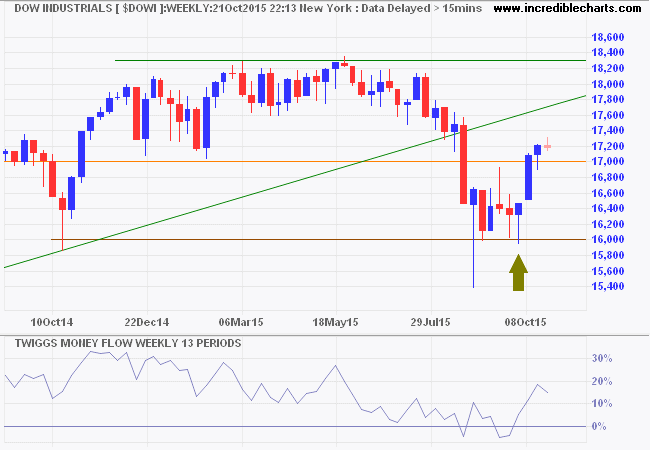
Dow Jones Industrial Average similarly retraced to test support at 17000 on the weekly chart. 13-Week Twiggs Money Flow holding above zero indicates buying pressure. Respect of support would again indicate a rally to test the previous high (18300), failure would warn of another test of primary support at 16000.

Dow Jones Industrial Average

Canada’s TSX 60 respected resistance at 825. Reversal below 800 would warn of another decline; breach of 775 would confirm. Weak 13-week Twiggs Momentum, below zero, signals the market is still bearish.

TSX 60 Index

* Target calculation: 775 – ( 825 – 775 ) = 725

Europe

Germany’s DAX remains weak, with the index retracing to test support at 10000 and 13-week Twiggs Money Flow below zero. Reversal below 10000 is likely and would warn of another decline; follow-through below 9500 would confirm. Recovery above 10500 is unlikely but would indicate continuation of the bear rally.

DAX

The Footsie is more resilient, with 13-week Twiggs Money Flow holding above zero. The index respected resistance at 6500 and is retracing to test short-term support at 6250. Respect is more likely and would suggest another test of 6500. Reversal below 6000 is unlikely, but would confirm the primary down-trend.
FTSE 100

Asia

The Shanghai Composite Index rallied off government-enforced support at 3000. But the rally is likely to be short-lived and recovery above 3500 unlikely.

Dow Jones Shanghai Index

Hong Kong’s Hang Seng Index is retracing to test support at 22500 after a similar bear rally. Respect of 22500 would indicate another test of 24000, but breach of support is more likely and would warn of another test of primary support at 21000.

Hang Seng Index

Japan’s Nikkei 225 encountered resistance at 18500. Gradual decline on 13-week Twiggs Money Flow suggests a secondary correction, with long-term buying pressure continuing. Recovery above 19000 would indicate another test of 21000.

Nikkei 225 Index

* Target calculation: 19000 + ( 19000 – 17000 ) = 21000

India’s Sensex is retracing to test support at 26500. The 13-week Twiggs Money Flow trough above zero, however, indicates strong buying pressure and respect of support at 26500 would indicate continuation of the rally. Reversal below 26000 is unlikely, but would confirm a primary down-trend.

SENSEX

Australia

The ASX 200 retreated from resistance at 5250/5300. Rising 13-week Twiggs Money Flow, however, indicates medium-term buying pressure. A higher trough above 5000 would strengthen the signal. Breakout above 5300 would signal continuation of the bear rally to test the descending trendline. The bear market continues despite recent support and breach of 5000 would confirm a primary down-trend.

ASX 200

* Target calculation: 5000 – ( 5400 – 5000 ) = 4600


Being powerful is like being a lady. If you have to tell people you are, you aren’t.

~ Margaret Thatcher

Bear Rally

North America

Construction activity continues to advance. The graph below shows Total US Construction Spending adjusted for inflation (Core CPI). Spending is substantially below the 2004 to 2007 property bubble but equates to the earlier Dotcom era. The steep rise suggests that rate increases will be necessary to prevent another bubble.

US Construction Spending adjusted by Core CPI

The S&P 500 is testing resistance at 2000. Bullish divergence on 21-day Twiggs Money Flow indicates (medium-term) buying pressure. Recovery above 2000 would signal a relieving rally, with a target (from the double-bottom pattern) of 2130*. The market remains bearish and respect of 2130 would warn of another test of primary support at 1870.

S&P 500 Index

* Target calculation: 2000 + ( 2000 – 1870 ) = 2130

The CBOE Volatility Index (VIX) below 20 indicates market risk is easing. We need to remain vigilant for the next few weeks as VIX can be prone to false breaks.

S&P 500 VIX

NYSE short sales are subdued.

Dow Jones Industrial Average is similarly testing resistance at 17000 on the weekly chart. Breakout would offer a similar target of 18300. Recovery of 13-week Twiggs Money Flow above zero indicates buying pressure. Reversal below 16000 is unlikely, but would confirm a primary down-trend.

Dow Jones Industrial Average

Canada’s TSX 60 recovered above the former primary support level at 800. Follow-through above 820 would signal a relieving rally. Weak 13-week Twiggs Momentum, below zero, warns the market is still bearish.

TSX 60 Index

* Target calculation: 820 + ( 820 – 750 ) = 890

Europe

Germany’s DAX remains weak, with 13-week Twiggs Money Flow below zero. Recovery above 10500 would indicate a bear rally. Only follow-through above 11000 would signal that the down-trend is over.

DAX

The Footsie proved more resilient, respecting support at 6000 with 13-week Twiggs Money Flow holding above zero. Breakout above 6300 indicates a relieving rally, while follow-through above the descending trendline would suggest that the correction is over. Reversal below 6000 is unlikely, but would confirm the primary down-trend.

FTSE 100

Asia

The Shanghai Composite Index continues to test government-enforced support at 3000. Recovery above 3500 is most unlikely.

Dow Jones Shanghai Index

Hong Kong’s Hang Seng Index rallied to test resistance at 22500, while 13-week Twiggs Money Flow recovered above zero. Follow-through above 22500 would indicate another test of 24000. But this remains a bear market and reversal below 22500 would warn of another decline.

Hang Seng Index

Japan’s Nikkei 225 respected primary support at 17000. Gradual decline on 13-week Twiggs Money Flow suggests a secondary correction. Recovery above 19000 would indicate another test of 21000.

Nikkei 225 Index

* Target calculation: 19000 + ( 19000 – 17000 ) = 21000

India’s Sensex followed through above resistance at 26500, indicating a bear rally. Strong buying pressure, signaled by a 13-week Twiggs Money Flow trough above zero, suggests a reversal. Breakout above 28500 would confirm. Reversal below 25000 is unlikely, but would confirm a primary down-trend.

SENSEX

Australia

A monthly chart of the ASX 200 shows the significance of the 5000 support level.

ASX 200 monthly

Rising 21-Day Twiggs Money Flow on the daily chart indicates medium-term buying pressure. Breakout above 5300 would offer a target of 5700. But expect stiff resistance between 5200 and 5300 — already flagged by a tall shadow on today’s candlestick. Breach of 5000 is unlikely at present, but would confirm a primary down-trend.

ASX 200

* Target calculation: 5000 – ( 5400 – 5000 ) = 4600


More….

Crude: Another bear rally

Gold down-trend continues

Sen. John McCain on Russia’s airstrikes in Syria

Paddleboarding with whales

Deleveragings go on for about 15 years. The process of raising debt relative to incomes goes on for 30 or 40 years, typically. There’s a last big surge, which we had in the two years from 2005 to 2007 and from 1927 to 1929, and in Japan from 1988 to 1990, when the pace becomes manic. That’s the classic bubble. And then it takes about 15 years to adjust.

~ Ray Dalio, Bridgewater Associates

Bears out in force

Bears continue to dominate equity markets. Patches of support are visible across North America, Europe and Asia but this is likely to be a secondary rally rather than a trend change.

The Russian bear is also playing up. This time in Syria. Senator John McCain sums up the escalating crisis in the Middle East in this 15-minute video.

North America

The S&P 500 respected support between 1870 and 1900, rallying toward another test of resistance at 2000. The 21-day Twiggs Money Flow peak just above zero continues to indicate (medium-term) selling pressure. Recovery above 2000 is unlikely, but would signal a relieving rally. Breach of support at 1870 would confirm the primary down-trend.

S&P 500 Index

* Target calculation: 1900 – ( 2000 – 1900 ) = 1800

The CBOE Volatility Index (VIX) holding above 20 indicates elevated market risk.

S&P 500 VIX

NYSE short sales remain subdued.

Dow Jones Industrial Average is testing support at 16000. Long tails on the last two weekly candles and recovery of 13-week Twiggs Money Flow above zero indicate strong support. Breach of 16000 would confirm a primary down-trend but we are likely to see a (secondary) bear rally beforehand.

Dow Jones Industrial Average

Bellwether transport stock Fedex continues to warn of a contraction in economic activity.

Fedex

And retail sales growth remains subdued.

Retail Sales and Core CPI

A long tail on Canada’s TSX 60 indicates continued support despite the breach of 790. Declining 13-week Twiggs Momentum below zero indicates a primary down-trend. Recovery above 820 is unlikely, but would suggest a bear trap.

TSX 60 Index

* Target calculation: 800 – ( 900 – 800 ) = 700

Europe

Germany’s DAX signals a primary down-trend, but appears to have found secondary support at 9500. Recovery of 13-week Twiggs Money Flow above zero would suggest a bear rally.

DAX

The Footsie found strong support at 6000, with long tails and 13-week Twiggs Money Flow recovering above zero. Penetration of the descending trendline is unlikely but would warn of a bear trap. Breach of support at 6000 is more likely and would confirm the primary down-trend.

FTSE 100

Asia

The Shanghai Composite Index continues to test government-enforced support at 3000. Recovery above 3500 is most unlikely. Breach of 3000 would warn of another sharp sell-off.

Dow Jones Shanghai Index

Hong Kong’s Hang Seng Index broke support at 21000, confirming the primary down-trend — signaled earlier by 13-week Twiggs Money Flow.

Hang Seng Index

Japan’s Nikkei 225 is testing primary support between 16500 and 17000. Gradual decline on 13-week Twiggs Money Flow suggests a secondary correction, but reversal of 13-week Momentum below zero warns of a primary down-trend. Breach of 16500 would confirm.

Nikkei 225 Index

* Target calculation: 17500 – ( 19000 – 17500 ) = 16000

India’s Sensex found support at 25000 before testing resistance at 26500. 13-Week Twiggs Money Flow trough above zero indicates strong buying pressure. Recovery above 26500 would warn of a bear trap. Reversal below 25000 is less likely, but would confirm the primary down-trend.

SENSEX

* Target calculation: 25000 – ( 26500 – 25000 ) = 23500

Australia

The ASX 200 also shows solid support at 5000, with rising 21-Day Twiggs Money Flow indicating medium-term buying pressure. Recovery above 5200 would indicate a bear rally. Breach of 5000 remains likely, however, and would confirm the primary down-trend.

ASX 200

* Target calculation: 5000 – ( 5400 – 5000 ) = 4600


More….

Gold and Treasury yields decline as inflation weakens

Sen. John McCain on Russia’s airstrikes in Syria

Japan abandons Fed-style inflation targeting and targets GDP growth instead

Deflation supercycle is over as world runs out of workers | Telegraph

Australia: Latest SMSF statistics | FINSIA

I think anybody who is a great investor, a good investor, a successful investor has to be a person who can be both aggressive and defensive….. have enough fear to have the caution. But you can’t let the fear control you.

~ Ray Dalio, Bridgewater Associates

Japan abandons Fed-style inflation targeting and targets GDP growth instead

Scott Sumner quotes Marcus Nunes:

Japanese Prime Minister Shinzo Abe vowed on Thursday to raise gross domestic product by nearly a quarter to 600 trillion Japanese yen ($5 trillion), pledging to refocus on the economy after the passage of controversial security bills that eroded his popularity. Abe unveiled the plan at a news conference marking his election to a second three-year term as ruling Liberal Democratic Party leader and hence, premier. Abe stopped short, however, of setting a timeframe for the new GDP target, which could raise doubts about the goal.

System-based rules targeting (nominal) GDP growth are likely to deliver more stable and consistent economic performance than the discretionary monetary policy followed by the Fed. No matter how smart the people on the FOMC, they are reacting to imperfect data in a complex world. Many decisions, in hindsight, prove to be late. Sometimes with disastrous consequences.

For a detailed discussion, see Marcus Nunes: The “Rules debate” once again.

Read more at Japan adopts an NGDP target, Scott Sumner | EconLog | Library of Economics and Liberty

Beware of the Bear

This time it’s not the Russian bear but stock market bears that we need to beware of. Signals across global markets warn of a major down-turn.

North America

The S&P 500 respected resistance at 2000, the false break warning of a bull trap. A 21-day Twiggs Money Flow peak just above zero indicates (medium-term) selling pressure. Recovery above 2000 is unlikely, but would signal a relieving rally. Breach of support at 1870 would confirm the primary down-trend.

S&P 500 Index

* Target calculation: 1900 – ( 2000 – 1900 ) = 1800

The CBOE Volatility Index (VIX) is holding above 20, indicating elevated market risk.

S&P 500 VIX

NYSE short sales spiked up close to 1.2 billion on Friday, September 18th.

NYSE Short Sales

13-Week Twiggs Money Flow crossed below zero on the (S&P 500) weekly chart, warning of a primary down-trend.

S&P 500 Index

Dow Jones Industrial Average is testing support at 16000. Decline of 13-week Twiggs Money Flow below zero warns of a primary down-trend. Breach of 16000 would confirm the signal.

Dow Jones Industrial Average

Canada’s TSX 60 retreated below 790, confirming a primary down-trend. Declining 13-week Twiggs Momentum below zero strengthens the signal.

TSX 60 Index

* Target calculation: 800 – ( 900 – 800 ) = 700

Europe

Germany’s DAX retreated below support at 10000. Decline of 13-week Twiggs Money Flow below zero again warns of a primary down-trend.

DAX

The Footsie is in a similar position, with 13-week Twiggs Money Flow below zero. Breach of support at 6000 would confirm a primary down-trend.

FTSE 100

Asia

The Shanghai Composite Index continues to test (government-backed) support at 3000. Recovery above 3500 is most unlikely. Breach of 3000 would warn of a sharp sell-off.

Dow Jones Shanghai Index

Hong Kong’s Hang Seng Index bear rally failed and the index is again testing support at 21000. Breach would confirm the primary down-trend signaled by 13-week Twiggs Money Flow.

Hang Seng Index

Japan’s Nikkei 225 is having difficulty breaking resistance at 19000. Gradual decline on 13-week Twiggs Money Flow suggests medium-term selling pressure, but reversal of 13-week Momentum below zero warns of a primary down-trend.

Nikkei 225 Index

* Target calculation: 17500 – ( 19000 – 17500 ) = 16000

India’s Sensex respected resistance at 26500. Reversal below 25000 would confirm a primary down-trend. 13-Week Twiggs Money Flow holding above zero indicates medium-term buying pressure.

SENSEX

But 13-week Twiggs Momentum below zero warns of a primary down-trend.

SENSEX

* Target calculation: 25000 – ( 26500 – 25000 ) = 23500

Australia

The ASX 200 also displays medium-term buying pressure, with rising 21-Day Twiggs Money Flow. But this is unlikely to withstand global bearish forces. Breach of 5000 would confirm a primary down-trend. Recovery above 5300 is most unlikely, but would indicate a bear rally.

ASX 200

* Target calculation: 5000 – ( 5400 – 5000 ) = 4600


More….

Gold: No safety here

Crude at $30 per barrel?

Deflation supercycle is over as world runs out of workers | Telegraph

Australia: Latest SMSF statistics | FINSIA

Deleveragings go on for about 15 years. The process of raising debt relative to incomes goes on for 30 or 40 years, typically. There’s a last big surge, which we had in the two years from 2005 to 2007 and from 1927 to 1929, and in Japan from 1988 to 1990, when the pace becomes manic. That’s the classic bubble. And then it takes about 15 years to adjust.

~ Ray Dalio, Bridgewater Associates