Dow Jones Industrials

Dow Jones Industrial Average closed the week above 21000 for the first time. Twelve months ago the index was at 17000, an increase of 23.5 percent. Shallow retracements since then signal buying pressure, highlighted by Twiggs Money Flow troughs above zero. The latest trough, higher than zero, reflects growing enthusiasm from investors.

Dow Jones Industrial Average

Prices are rising faster than earnings in expectation of future growth. Clearly the Dow is in Phase III of a Bull Market. As I pointed out in December, this could last for several years.

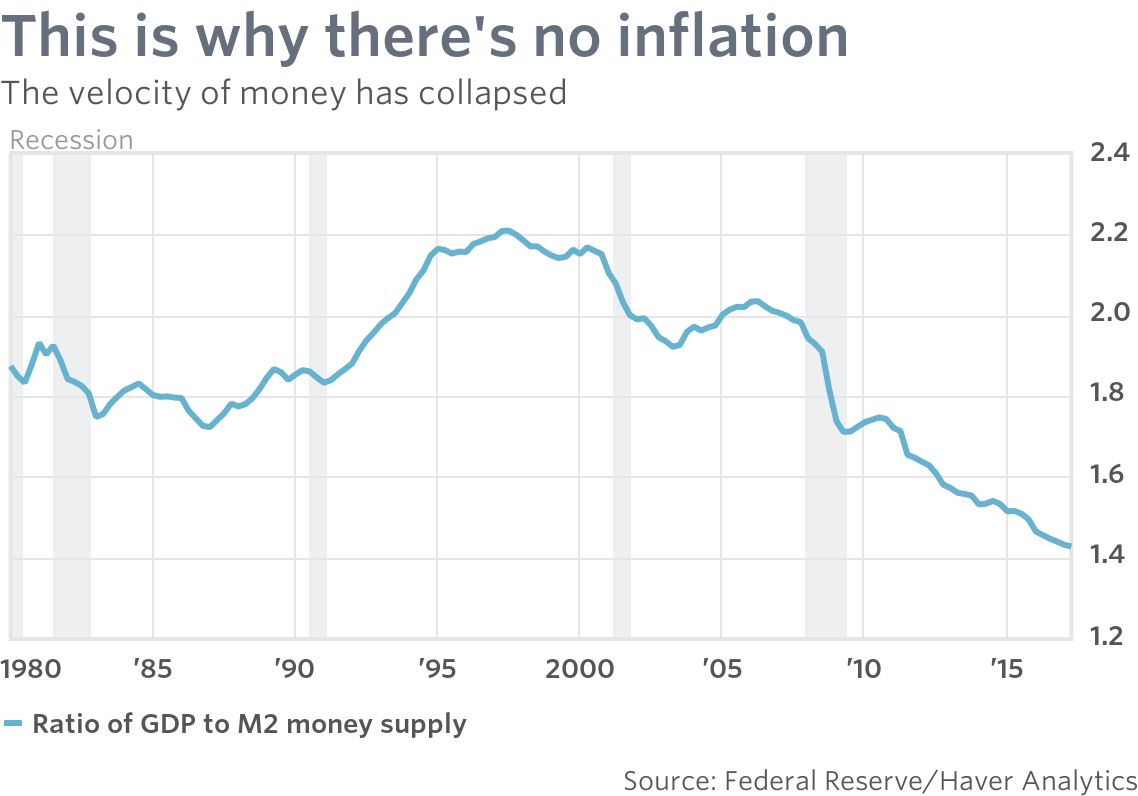
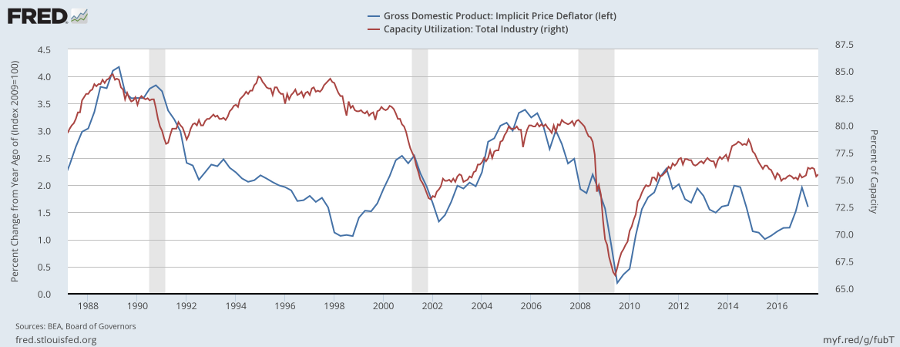
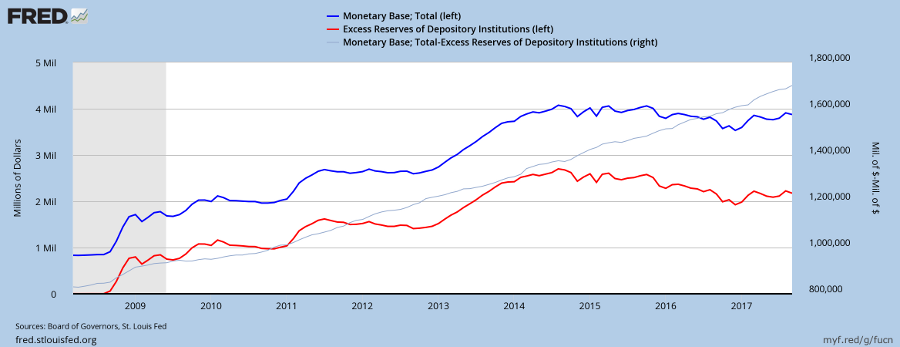
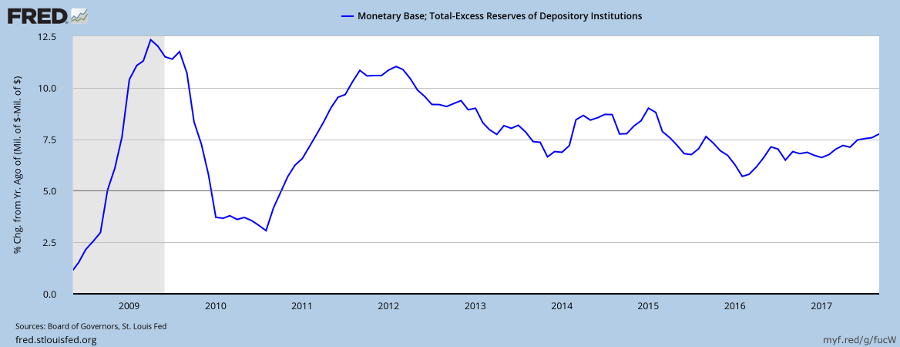
The key component driving inflation

Two interesting graphs on inflation from Niels Jensen at Absolute Return Partners:

….similarities between the story unfolding in the UK and the one in the US. Core inflation in both countries is significantly higher than it is in the Eurozone – just above 2% in the US and just below 2% in the UK whereas, in the Eurozone, it is only 0.9%. Furthermore, services are very much the engine that drives core inflation in both the UK and the US (exhibit 6).

Exhibit 6: The drivers of core inflation (US only)Source: The Daily Shot, BEA, Bureau of Labor Statistics, Haver Analytics, February 2017. Data as of December 2016

To a very significant degree that is down to rising medical care costs (exhibit 7). As the populace ages, this can only get worse – at least in the US, where almost all healthcare is provided privately and paid for by insurance companies.

Exhibit 7: US personal consumption expenditures by component (%)
Source: The Daily Shot, BEA, Haver Analytics, February 2017

Source: A Note on Inflation: Is it here or isn’t it? – The Absolute Return Letter

Forward P/E turns back up

Dow Jones Industrials

Dow Jones Industrial Average continues to climb, heading for a target of 21000. Rising troughs on Twiggs Money Flow signal strong buying pressure.

Dow Jones Industrial Average

The S&P 500 follows a similar path.

S&P 500

With the CBOE Volatility Index (VIX) close to historic lows around 10 percent.

VIX

However, at least one investment manager, Bob Doll, is growing more cautious:

“…we think the easy gains for equities are in the rearview mirror and we are growing less positive toward the stock market. We do not believe the current bull market has ended, but the pace and magnitude of the gains we have seen over the past year are unlikely to persist.”

Forward P/E Ratio

Bob Doll’s view is reinforced by recent developments with the S&P 500 Forward Price-Earnings Ratio. I remarked at the beginning of February that the Forward P/E had dropped below 20, signaling a time to invest.

Actual earnings results, however, have come in below earlier estimates — shown by the difference between the first of the purple (latest estimate) and orange bars (04Feb2017) on the chart below.

S&P 500 Forward Price-Earnings Ratio

In the mean time the S&P 500 index has continued to climb, driving the Forward P/E up towards 20.

This is not yet cause for alarm. We are only one month away from the end of the quarter, when Forward P/E is again expected to dip as the next quarter’s earnings (Q1 2018) are taken into account.

S&P 500 Forward Price-Earnings Ratio

But there are two events that would be cause for concern:

  1. If the index continues to grow at a faster pace than earnings; and/or
  2. If forward earnings estimates continue to be revised downward, revealing over-optimistic expectations.

Either of the above could cause Forward P/E to rise above 20, reflecting over-priced stocks.

Be fearful when others are greedy and greedy only when others are fearful.

~ Warren Buffett

Gold breaks through $1250

10-Year Treasury Yields are testing support at 2.30%. Expect this to hold. Breach of the rising trendline would warn of a correction but this seems unlikely with the Fed intent on normalizing interest rates. Breakout above 2.50% would offer a target of 3.0%.

10-Year Treasury Yields

The Dollar Index rally remains muted since finding support at 100. Rising long-term yields would fuel the advance, with bearish consequences for gold.

Dollar Index

China’s Yuan is consolidating. Resistance on USDCNY at 7 Yuan is likely to be tested soon.

USDCNY

The PBOC has been burning through its foreign reserves to slow the rate of depreciation against the Dollar, to create a soft landing. A sharp fall would destabilize global financial markets and fuel capital flight from China.

China Foreign Reserves

Spot Gold broke through resistance at $1250, signaling an advance to $1300.

Spot Gold

Australia & Canada in 4 charts

RBA governor Phil Lowe recently made a speech comparing the experiences of Australia and Canada over the last decade. Both have undergone a resources and housing boom. Four charts highlight the differences and similarities between the two countries.

Australia’s spike in mining investment during the resources boom did serious damage to non-mining investment while Canada’s smaller boom had no impact.

Australia & Canada: Mining v. Non-Mining Investment

Immigration fueled a spike in population growth in Australia, adding pressure on infrastructure and housing.

Australia & Canada: Population Growth

Both countries are experiencing a housing bubble, fueled by low interest rates and lately by export of China’s property bubble, with capital fleeing China and driving up house prices in the two countries.

Australia & Canada: Housing

Record levels of household debt make the situation more precarious and vulnerable to a correction.

Australia & Canada: Household Debt

Hat tip to David Llewellyn-Smith at Macrobusiness

We Are Growing Less Positive (But Not Negative) Toward Equities | Bob Doll

Great headline from Bob Doll (Nuveen Investments) latest newsletter.

Bob Doll

“….we think the easy gains for equities are in the rearview mirror and we are growing less positive toward the stock market. We do not believe the current bull market has ended, but the pace and magnitude of the gains we have seen over the past year are unlikely to persist.”

His key points:

  • We believe investors are overly complacent about the state of the global economy and the political backdrop.

  • We remain cautiously optimistic toward equities, but think the pace of recent gains is unlikely to persist and that risks will rise this year.

Still positive on the economy but wary of the political backdrop seems a common theme among investment managers. The timing of any reversal (Doll: 2018) will largely be determined by inflation and interest rates.

Source: Weekly Investment Commentary from Bob Doll | Nuveen

Bond spreads bullish for US, less so Australia

Yield Curve

The yield curve is one of the best predictors of US economic recessions. Every time the yield curve has turned negative in the last fifty years, a recession has followed.

First of all, what is a yield curve? It is the plot of yields on bonds, normally Treasuries, against their maturities. Long maturity bonds are expected to have higher yields than short-term bills, to compensate for the increased risk (primarily of interest rate changes). If you tie your money up for longer, you would expect a higher return. Hence a rising yield curve.

A rising yield curve is a major source of profit to the banks as their funding is mostly short-term while they charge long-term rates to borrowers, pocketing a healthy interest margin.

When the Fed steps into the market, however, restricting the flow of money into the economy, then short-term rates rise faster than long-term rates and the yield curve can invert (referred to as a negative yield curve).

Bank interest margins are squeezed — it is no longer profitable to borrow short and lend long — and they restrict the flow of new credit.

Credit is the lifeblood of the economy and activity slows.

The chart below compares US recessions to the yield differential: the difference between 10-year Treasury yields and the yield on 3-month T-bills. The yield differential falls below zero when 3-month T-bills yield more than 10-year T-notes.

Yield Differential: 10-year Treasury yields minus 3-month T-bills

You can see that every time the yield differential dips below zero it is followed by a gray bar indicating a recession. There is one exception: the phantom recession of 1966 when the S&P 500 fell 22%. This was originally certified as a recession by the NBER but they later changed their mind and airbrushed it out of history.

You can also see that the yield differential is declining at present but, at 2.0%, it is a long way from a flat or negative yield curve. This supports my argument last week that current Fed rate hikes are more about normalizing interest rates than about monetary tightening.

That could change in the future but at present the bull market still appears to have plenty in the tank.

Corporate Bond Spreads

Corporate bond spreads — the yield difference between high-grade corporate bonds and the risk-free Treasury rate — are another useful indicator of the state of the economy.

Wide bond spreads indicate increased risk of corporate default. Investors are concerned about the state of the economy and demand a higher premium for taking credit risk.

Narrow spreads suggest that credit premiums are low and confidence in the economy is good.

If we examine the chart below, bond spreads are declining, indicating confidence in the US economy, with even the lowest investment grade BBB dipping below 150 basis points (or 1.50%). This is synonymous with a bull market.

US Bond Spreads

Australian corporate bond spreads are higher than the US, with BBB still at 200 bps. They have also declined over the last year but seem to be trending upward from their 2013 low. This is not conclusive as the current trough is not yet complete, but a higher low would warn that credit risk is rising.

Australian Bond Spreads

Only when the tide goes out do you discover who’s been swimming naked.

~ Warren Buffett

Dow and Nasdaq: It’s a bull market

The Nasdaq 100 is in blue sky territory, having broken clear of its Dotcom high at 4900. Rising troughs on Twiggs Money Flow signal long-term buying pressure. A correction to test the new support level remains likely but this is unlikely to upset the bull market.

Nasdaq 100

The Dow Jones Industrial Average is also in a bull market, headed for a test of 21000. Twiggs Money Flow troughs above zero again indicate strong buying pressure.

Dow Jones Industrial Average

The Dow Jones Transport Average is also in blue sky territory having respected its new support level at 9000. The up-trend provides bull market confirmation required by classic Dow Theory.

Dow Jones Transport Average

The Threat of Inflation

From the Trading Diary:

I received a message from a US reader suggesting I should “stay out of politics”.

I would love to stay out of politics. Frankly, I find it tiresome. Unfortunately, politics and the economy are so intertwined as to make the study of one meaningless without consideration of the other. I say “unfortunately” because a lot of the damage done to the economy is caused by the political system.

As for Donald Trump, I am a conservative but do not support him. He is not another Reagan who can lead from the center and inspire his country. If anything he is a polarizing force, more ego-driven than Nixon and just as unpredictable.

I hope I am wrong. Trump has many sound policies and has made some solid appointments to his team. Don’t believe everything you read from a hostile media. They could do a lot of good. Provided they are able to manage the elephant in the lifeboat — the destabilizing side of Trump’s nature.

Now that I have offended at least half of all US readers — slightly less than half if you listen to bleating about the majority vote — let me explain why politics and economics are so intertwined.

Apart from trade wars, which I will discuss at a later date, I see the main threat to the US economy as inflation.

Before I start, let me say that these dangers are not immediate and the present boom is likely to continue for the next 12 to 18 months. But they could quickly materialize, bringing the boom to a premature end, so it is best to keep a weather eye on them.

Inflation

Earlier this week I discussed why the inflation outlook is so important to stock market performance:

From Tim Wallace at The Sydney Morning Herald:

Nine years on from the start of the financial crisis, the US recovery may be overheating, Legal & General Investment Management economist James Carrick has warned.

He has predicted a series of interest rate hikes will tip the US into a 2018 recession.”Every recession in the US has been caused by a tightening of credit conditions,” he said, noting inflation is on the rise and the US Federal Reserve is discussing plans for higher interest rates.

Officials at the Fed have only raised interest rates cautiously, because inflation has not taken off, so they do not believe the Fed needs to take the heat out of the economy.

But economists fear the strong dollar and low global commodity prices have restricted inflation and disguised domestic price rises. Underneath this, they fear the economy is already overheating.

As a result, they expect inflation to pick up sharply this year, forcing more rapid interest rate hikes.

That could cause a recession next year, they say. In their models, the signals are that this could take place in mid-2018.

Harvard scholar Paul Schmelzing points out that inflation is starting to rear its head in both China and Germany, with producer prices rising. This may in part be a result of the falling value of the Yuan and Euro against the Dollar, resulting in higher domestic commodity prices.

The opposite, however, is true for the US, with a rising Dollar lowering import prices and acting as a headwind against inflation.

The consumer price index (CPI) is rising because of higher crude oil prices but core CPI (excluding food & energy) has remained fairly constant, around the 2.0 percent target, over the last five years.

Core CPI and CPI

So why the concern?

Well the Fed is more concerned about underlying inflation, best reflected by hourly wage rates, than the headline CPI figure.

A sharp rise in hourly earnings rates would force the Fed to respond with tighter monetary policy to take the heat out of the economy.

The chart below shows how the Fed slams on the brakes whenever average hourly earning rates grow above 3.0 percent. Each surge in hourly earnings is matched by a dip in the currency growth rate as the Fed tightens the supply of money to slow the economy and reduce inflationary pressure. And tighter monetary normally leads to recession.

Hourly Earnings Growth compared to Currency in Circulation

Two anomalies on the above chart warrant explanation. First, is the sharp upward spike in currency growth in 1999/2000 when the Fed reacted to the LTCM crisis with monetary stimulus despite high inflationary pressures. Second, is the sharp dip in 2010 when the Fed took its foot off the gas pedal too soon after the financial crisis of 2008/2009, mistaking it for a regular recession.

Hourly earnings growth is currently at 2.5 percent, so the Fed has some wiggle room and is only likely to react with tighter monetary policy when the figure reaches 3.0 percent.

Recent rate rises are more about normalizing interest rates — not taming inflation — and are not cause for alarm.

But Paul Schmelzing warns that the combination of a tight labor market and fiscal stimulus could fuel inflation and lead to a bear market in bonds similar to the 1960s.

That is exactly where Donald Trump is headed with a major infrastructure program likely to hit the ground next year. In a tightening labor market, the Fed would be forced to tighten monetary policy, slowing the economy and leading to another bear market in stocks as well as bonds.

Politics is tricky; it cuts both ways. Every time you make a choice, it has unintended consequences.

~ Stone Gossard

Dow: Expect further advances

The Dow Jones Industrial Average respected support at 20000, signaling another advance. Probably to 21000 but it could carry as far as the upper trend channel at 22000. Twiggs Money Flow troughs above zero indicate strong buying pressure.

ASX 200

* Target: 18000 + ( 18000 – 16000 ) = 20000