Gold breaks $1850 per ounce

10-Year Treasury yields remain soft despite the recent CPI spike. The Fed is weighting purchases more to the long end of the yield curve. Breakout above 1.75% (green line) would signal a fresh advance.

10-Year Treasury Yield

10-Year TIPS yield sits at -0.78%, unaffected by the $369bn in overnight Fed reverse repurchase agreements which remove liquidity but mainly affect short-term interest rates.

10-Year TIPS Yield & Fed RRP

Gold broke through resistance at $1850/ounce. A rising Trend Index indicates medium-term buying pressure. Long tails on the last three daily candles indicate retracement to test the new support level; respect signals a test of $1950/ounce.

Spot Gold

Silver is testing resistance at $28/ounce. Rising Trend Index indicates medium-term buying pressure. Breakout above $28 is likely and would offer a target of $30/ounce in the short/medium-term.

Spot Silver

The Dollar index is testing primary support between 89 and 90. Rising Trend Index (below zero) suggests another test of the descending trendline. Respect is likely and breach of primary support would offer a medium/long-term target of 851.
Dollar Index

From Luke Gromen at FFTT:

When you are an externally-financed twin deficit nation with insufficient external funding (as Druckenmiller pointed out), there are three potential release valves:

  1. Higher unemployment.
  2. Higher interest rates.
  3. Lower currency (inflation.)

With US debt/GDP at 130%, Options #1 and #2 aren’t an option……

Conclusion

We expect long-term Treasury yields to remain low while inflation rises, causing the US Dollar to sink and Gold and Silver to advance.

Our long-term target for Gold of $3,000 per troy ounce2.

Notes

  1. Dollar Index (DXY) target of 85 is calculated as the peak of 93 extended below support at 89.
  2. Gold LT target calculation: base price of $1840/ounce + [TIPS yield of -0.87% – (nominal Treasury yield of 1.64% – real inflation rate of 5.30%)] * $400/ounce = $2956/ounce

Gold and Copper: Towards a new measuring stick

Our old measuring stick, the Dollar, is broken and no longer fit-for-purpose. The Fed and other major central banks have consistently eroded the value of their national currencies through quantitative easing; expanding their balance sheets by 580% — from $5T to $29T — over the past 14 years, as the chart from Ed Yardeni below shows.

Total Assets of Major Central Banks

Currency debasement is easily hidden from view by simultaneous policies across central banks, affecting all major currencies.

Gold as a benchmark

Attempts to use Gold as an independent benchmark are frequently interfered with by government attempts to suppress the Gold price, dating back to the London Gold Pool of the early 1960s. Alan Greenspan even went so far as to base Fed monetary policy on Gold, not so much to suppress the Gold price but as an early warning of inflation (measured inflation figures are lagged and therefore useless in setting proactive monetary policy). The result was similar, however, suppressing fluctuations in the Gold price.

A new benchmark

Earlier than Greenspan, Paul Volcker had used a benchmark based on a whole basket of commodities to measure inflation.

Our goal is derive a similar but simpler benchmark that can be applied to measure performance across a wide range of asset classes.

Copper and other industrial metals, on their own, are not a viable alternative because demand tends to fluctuate with the global economic cycle.

Gold and Silver also tend to fluctuate but their cyclical fluctuations, especially Gold, tend to run counter to industrial metals. Demand for Gold is driven by safe haven demand which tends to be highest when the global economy contracts.

We therefore selected Gold and Copper as the two components of our benchmark because their fluctuations tend to offset each other, providing a smoother and more reliable measure. A mix of 5 troy ounces of Gold and 1 metric ton of Copper provides a fairly even long-term balance between the two components as illustrated by the chart below. The middle line is our new benchmark.

5 Troy Ounces of Gold & 1 Metric Ton of Copper

Copper (red) leads in times of inflation, when industrial demand is expanding rapidly, while Gold (yellow) leads in times of deflation, when the global economy contracts.

First, let’s address the weaknesses. China’s entry to the World Trade Organization (WTO) in the early 2000s, a once-in-a-century event, caused a surge in the price of both Copper and Gold. The change drove up commodity prices but drove down prices of finished goods; so we are undecided whether this is truly inflationary.

The sharp fall in 2008, however, is accurately depicted as a massive deflationary shock, caused by private debt deleveraging during the global financial crisis (GFC). Central banks then intervened with balance sheet expansion (QE). Accompanied by fiscal stimulus, QE caused a huge inflationary spike lasting from 2009 to 2011.

5 Troy Ounces of Gold & 1 Metric Ton of Copper

Fed expansion paused in 2011-2012 and was followed by a sharp contraction by the European Central Bank (ECB), causing deflation, as the breakdown from Ed Yardeni below shows. The ECB then reversed course — following Mario Draghi’s now famous “whatever it takes” — and, accompanied by the Bank of Japan (BOJ), engaged in another rapid expansion.

Total Assets of Major Central Banks

The Fed attempted to unwind their balance sheet in 2018-19, causing a brief deflationary episode before all hell broke loose in September 2019 with the repo crisis. Fed balance sheet expansion in late 2019 was, however, dwarfed by the expansion across all major central banks during the pandemic. Fed QE caused a sharp spike in the M2 money supply as well as in our Gold-Copper index (GCI), warning of strong inflation.

GCI & M2 Money Stock

Market Values using our GCI benchmark

While not as high as some valuation measures (PE or Market Cap/GDP), plotting the Wilshire 5000 Total Market Index against the GCI shows stocks trading at levels only exceeded during the 1999-2000 Dotcom bubble.

Wilshire 5000 Total Market Index/GCI

The Case-Shiller Index plotted against GCI shows home prices are relatively low in real terms, most of the froth being created by a shrinking Dollar.

Case Shiller US National House Price Index/GCI

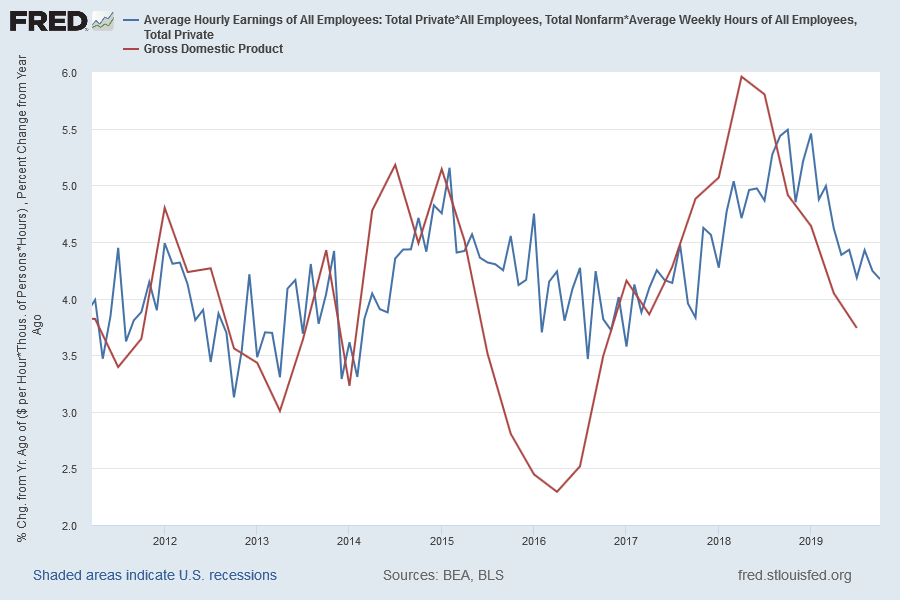
But if you think housing is cheap — after the China-shock — look what happened to wages.

Average Hourly Manufacturing Earnings/GCI

Precious Metals

Plotting Gold against the GCI might seem counter-intuitive but it highlights, quite effectively, periods when Gold is highly-priced relative to its historic norm. The yellow metal retreated to within its normal trading range in March 2021.

Gold/GCI

The plot against GCI offers far less distortion than the Gold-Oil ratio below.

Gold/Brent Crude

We only have 4 years of data for Silver (on FRED). Plotting against GCI warns that silver is highly-priced at present but we will need to source more data before drawing any conclusions.

Silver/GCI

Conclusion

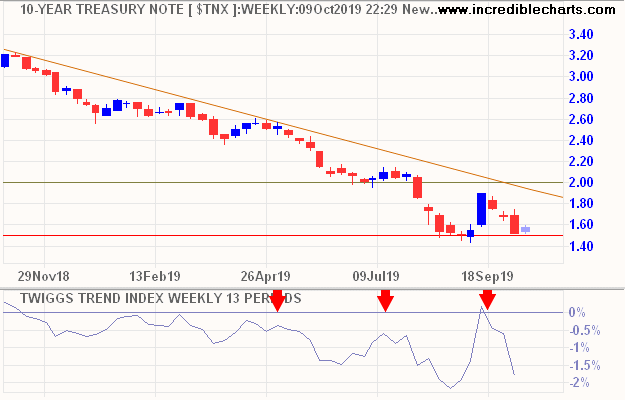
Stock prices are high and overdue for a major correction but this is only likely to occur when: (a) government stimulus slows; and/or (b) the Fed tapers its Treasury purchases, allowing long-term Treasury yields to rise. Market indications — and dissenting voices (Robert Kaplan) at the Fed — suggest that the taper could occur sooner than Jay Powell would have us believe.

The Gold-Copper index (GCI) warns of strong inflation ahead, which should be good for both commodities and precious metals. But bad for stocks and bonds.

Inflation is baked into the cake

Inflation is a hot topic at the moment. For good reason: higher inflation would drive up interest rates, affecting both bond and equity prices, as well as commodities and precious metals.

March CPI jumped to 2.64% but the increase is partly attributable to the low base from March 2020. Core CPI (excluding food and energy) came in at a more modest 1.65%. The main difference between CPI and core CPI is rising energy and food costs.

CPI & Core CPI

The annual inflation rate in the US ……is the highest reading since August of 2018 with main upward pressure coming from energy (13.2% vs 3.7% in February), namely gasoline (22.5% vs 1.6%), electricity (2.5% vs 2.3%) and utility gas service (9.8% vs 6.7%). Prices also accelerated for used cars and trucks (9.4% vs 9.3%), shelter (1.7% vs 1.5%) and new vehicles (1.5% vs 1.2%) while inflation slowed for medical care services (2.7% vs 3%) and food (3.5% vs 3.6%). Cost of apparel continued to fall (-2.5% vs -3.6%)……..a jump in commodities and material costs, coupled with supply constraints, are pushing producer prices up and some companies are passing those costs to clients. (Reuters)

10-year Treasury yields eased to 1.62% with the breakeven inflation rate at 2.33% — weakening the real 10-year yield to -0.71%.

10-Year Treasury Yield & Breakeven Inflation Rate

Inflation and the Money Supply

Milton Friedman famously said, “Inflation is always and everywhere a monetary phenomenon in the sense that it is and can be produced only by a more rapid increase in the quantity of money than in output.”

CPI & M2 Money Supply

But experience since the 1980s shows several surges in money supply growth without a corresponding rise in inflation. While an increase in money supply may be a prerequisite for a spike in inflation, it is not the cause.

More direct causes of inflation are increases in input costs for suppliers of goods and services. The two largest input costs are commodities and wages. Rises in commodity prices will mostly affect the manufacturing sector, while increases in wage rates impacts on all employers. Also, commodity prices tend to be cyclical, so price fluctuations will be more readily absorbed, while wage increases tend to be permanent and more likely to be passed on to customers.

The chart below shows a much closer correlation between hourly wage rates and CPI since the 1970s, with surges in hourly earnings accompanied by a rise in inflation.

CPI & Hourly Manufacturing Wages

Conclusion

Rising commodity prices are driving higher inflation at present. While some of the pressures may be transitory, due to supply interruptions, underinvestment in new production over the last decade is likely to act as a supply constraint for both energy and base metals. Rising demand fueled by short-term stimulus and longer-term infrastructure investment would act as an accelerant.

Wage rate increases are so far restrained, but that is likely to change as the economy recovers, boosted by decoupling from China and on-shoring of critical supply chains. Shortages of skilled labor are expected to drive up wage rates, maintaining upward pressure on inflation in the longer-term. Training and education of suitable staff will take time.

We have all the ingredients for an inflation spike. A massive boost in the money supply, accompanied by record stimulus payments, much of which has been channeled into savings. This will help to fuel increased demand in the longer term, while restricted supply will drive up commodity prices and wage rates for skilled labor.

The bond market revolt

The rise in Treasury yields accelerated over the past week, with 10-year Treasuries closing at 1.54% on Thursday and 10-year TIPS at -0.60.

10-Year TIPS & Treasury Yields

A sharp fall in daily new COVID-19 cases has fueled optimism about a rapid re-opening of the US economy.

USA: Daily New COVID-19 Cases

As well as fears of higher inflation.

10-Year Breakeven Inflation Rate

What the sell-off means

Investors are selling Treasuries at a faster rate than the Fed (and banks) are buying, out of fear of accelerating capital losses. Fixed coupons have been badly affected, with iShares 20Year+ Treasury Bond ETF (TLT) showing a loss of 13% over the past 6 months. But even inflation-protected bonds have lost value in anticipation of higher real interest rates, with PIMCO’s 15 Year+ TIPS Bond ETF (LTPZ) falling more than 6%.

20 Year+ Treasury Bond ETF (TLT) & 15 Year+ TIPS Bond ETF

The Fed response

The Fed is likely to respond by weighting purchases towards longer maturities. The 10-year Treasury yield has already started to anticipate this, falling to 1.39% by Friday’s close.

10-Year Treasury Yields

Source: CNBC

The result is a 16 bps fall in the real 10-year yield, to -0.76% on Friday (1.39-2.15).

Conclusion

Fed purchases are expected to suppress long-term Treasury yields over the next few months, with inflation breakeven rates continuing their upward trend, while real yields remain negative.

Can the Fed keep a lid on inflation?

Jeremy Siegel, Wharton finance professor, says the Fed has poured a tremendous amount of money into the economy in response to the pandemic, which will eventually cause higher inflation. David Rosenberg of Rosenberg Research argues that velocity of money is declining and the US economy has a large output gap so inflation is unlikely to materialize.

CNBC VideoClick to play

Both are right, just in different time frames.

Putting the cart before the horse

The velocity of money is simply the ratio of GDP to the money supply. Fluctuations in the velocity of money have more to do with fluctuations in GDP than in the money supply. If GDP recovers, so will the velocity of money. Equating velocity of money with inflation is putting the cart before the horse. Contractions in GDP coincide with low/negative inflation while rapid expansions in GDP are normally accompanied, after a lag, by rising inflation.

CPI & GDP

Money supply and interest rates

Inflation is likely to rise when consumption grows at a faster rate than output. Prices rise when supply is scarce — when we consume more than we produce. Interest rates play a key role in this.

Low interest rates mean cheap credit, making it easy for people to borrow and consume more than they earn. Low rates also boost the stock market, raising corporate earnings because of lower interest costs, but most importantly, raising earnings multiples as the cost of capital falls. Speculators also take advantage of low interest rates to leverage their investments, driving up prices.

S&P 500

In the housing market, prices rise as cheap mortgage finance attracts buyers, pushing up demand and facilitating greater leverage.

Housing: Building Starts & Permits

Wealth effect

Higher stock and house prices create a wealth effect. Consumers are more ready to borrow and spend when they feel wealthier.

High interest rates, on the other hand, have the exact opposite effect. Credit is expensive and consumption falls. Speculation fades as stock earnings multiples fall and housing buyers are scarce.

Money supply is only a factor in inflation to the extent that it affects interest rates. There is also a lag between lower interest rates and rising consumption. It takes time for consumers and investors to rebuild confidence after an economic contraction.

The role of the Fed

Fed Chairman, William McChesney Martin, described the role of the Federal Reserve as:

“…..to take away the punch bowl just as the party gets going.”

In other words, to raise interest rates just as the economic recovery starts to build up steam — to avoid a build up of inflationary pressures.

The Fed’s mandate is to maintain stable prices but there are times, like the present, when their hands are tied.

Federal government debt is currently above 120% of GDP.

Federal Debt/GDP

GDP is likely to rise as the economy recovers but so is federal debt as the government injects more stimulus and embarks on an infrastructure program to lift the economy.

With federal debt at record levels of GDP, raising interest rates could blow the federal deficit wide open as the cost of servicing Treasury debt threatens to overtake tax revenues.

Conclusion

Inflation is likely to remain low until GDP recovers. But the need to maintain low interest rates — to support Treasury markets and keep a lid on the federal deficit — will then hamper the Fed’s ability to contain a buildup of inflationary pressure.

Luke Gromen: Bitcoin alarm

“We do not think BTC is a bubble; we think BTC is the last remaining functioning fire alarm that has not been disabled by policymakers, and it is issuing an increasingly shrill alarm about the USD and fiat currencies more broadly. We have little doubt that policymakers will attempt to disable BTC as a functioning fire alarm as well, but its traits make that far more difficult to do to BTC than they have thus far done with gold.”

~ Luke Gromen, Treerings.com

Jim Bianco forecasts higher inflation in 2021

Jim Bianco from Bianco Research:

“The problem the stock market has in 2021 is by most standard metrics (P/E, Market Cap/GDP, etc.) it’s overvalued. Now a lot of people expect it to stay that way for another year. If we don’t get inflation, that can actually happen and you could actually have the market stay at these elevated levels. But if you do get rising interest rates on inflation……that will frip earnings, make mortgage rates go up and lift interest rates. That has historically not been good for risk assets….”

The problem if we don’t get inflation will be far worse. MMT theorists will take this as validation and we are likely to see more calls for far higher stimulus checks. Why not $200,000 stimulus checks someone on Twitter asked. The bubble will keep expanding without any visible effect …..until it bursts.

“A hell of a mess in every direction” – Paul Volcker

The S&P 500 strengthened on Friday, closing at a new high of 3067. Volatility (21-day) crossed below 1%, signaling that risk is easing. Money Flow strengthened; a trough above zero suggests another advance. The medium-term target is 3250.

S&P 500

Dow Jones Industrial Average is weaker, with Money Flow having dipped below zero, but breakout above 27,400 would signal another advance. Target for the advance is 29,400.

DJ Industrial Average

“We’re in a hell of a mess in every direction,” is how Paul Volcker, the former Fed Chairman describes it.

Equities are making new highs, while the Fed cuts interest rates. Donald Trump is effectively dictating monetary policy. This could only end badly.

Unemployment and initial jobless claims are near record lows.

Unemployment and Jobless Claims

Inflationary pressures are moderate, with average wage rates growing between 3.0% and 3.5% (production and non-supervisory employees).

Average Wage Rates

GDP growth is slowing, however, and likely to fall further according to our advance indicator (estimated hours worked).

Real GDP and Estimated Hours Worked

Payroll growth is also slowing. While this has been explained as a result of record low unemployment (new employees may be hard to find) it is likely that rising uncertainty has played a big part.

Payroll Growth and Fed Funds Rate

The 3-month TMO of Non-Farm Payrolls kicked up to 0.58%, above the amber risk level of 0.5%.

Payroll Recession Warnings

With 73.5% of stocks having reported for Q3, the price-earnings ratio remains elevated. A reading above 20 warns that stocks are over-priced, especially because expected earnings growth is low.

P/E of Highest Earnings

If we project nominal GDP growth (including inflation) at 3.5% and buyback yields at 3.0% (Q2: 3.26%) that gives us anticipated growth of 6.5%. Add dividend yield of 2.0% (Q2: 1.96%) and we can expect stocks to yield a total return (dividends plus growth) of 8.5%.

Nominal GDP and Estimated Hours Worked * Average wage rate

But that assumes that current price-earnings multiples are maintained. Any downward revision, from earnings disappointments, would most likely result in a negative return.

Gold, low interest rates and volatile currencies

Gold is in a primary up-trend, after ranging sideways for several years, fueled by low interest rates and volatile currency markets.

The chart below highlights the inverse relationship between gold and 10-year Treasury yields. When LT interest rates fall, the gold price surges.

Spot Gold in USD compared to Real 10-Year Treasury Yields

At present, 10-year Treasury yields are close to record lows, testing long-term support at 1.50%.

10-Year Treasury Yields

Yields in Germany and Japan are much lower, having crossed below zero, and the opportunity cost of holding physical assets such as Gold is at record lows.

Negative Bond Yields in Germany & Japan

Volatility in currency markets is another factor driving demand for Gold.

China’s Yuan is testing support at 13.95 US cents. Breach is likely, especially if US-China trade talks break down again, and would signal continuation of the primary down-trend. A weak Yuan fuels Chinese demand for Gold.

CNYUSD

The Dollar Index continues to edge higher, boosted by the current trade turmoil. A strong Dollar is likely to weaken demand for Gold but Trend Index peaks below zero warn of selling pressure.

Dollar Index

Gold is testing support at $1495/ounce. Breach would warn of a correction, while breakout above the descending trendline would indicate another advance.

Spot Gold in USD

Silver is similarly testing support. Breach of $17.50/ounce would warn of a correction.

Spot Silver in USD

The All Ordinaries Gold Index is trending lower. Breach of 7200 would warn of another decline, with a short-term target of 6500, while recovery above 8000 would suggest another advance.

All Ordinaries Gold Index

Patience is required. Gold is in a long-term up-trend, with a target of the 2012 high at $1800/ounce. A correction would offer an attractive entry point.