Our 2023 Outlook

This is our last newsletter for the year, where we take the opportunity to map out what we see as the major risks and opportunities facing investors in the year ahead.

US Economy

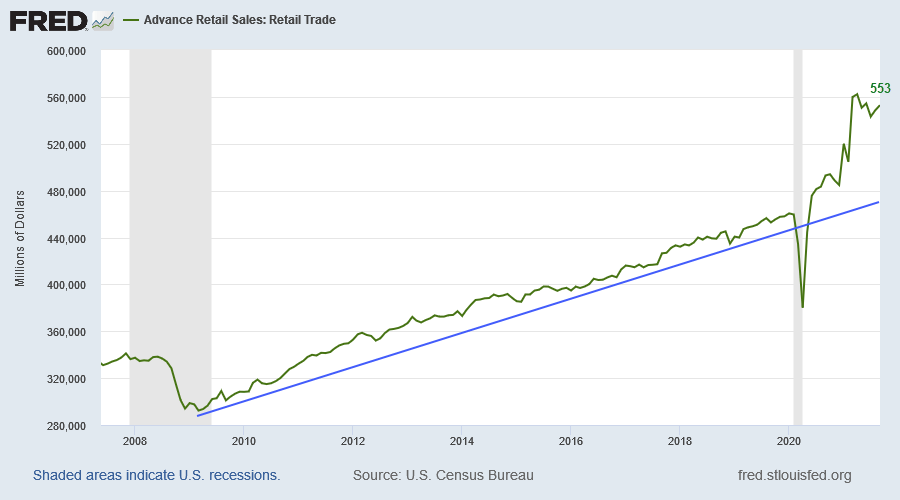
The Fed has been hiking interest rates since March this year, but real retail sales remain well above their pre-pandemic trend (dotted line below) and show no signs of slowing.

Real Retail Sales

Retail sales are even rising strongly against disposable personal income, with consumers running up credit and digging into savings.

Retail Sales/ Disposable Personal Income

The Fed wants to reduce demand in order to reduce inflationary pressure on consumer prices but consumers continue to spend. Household net worth has soared — from massive expansion of home and stock prices, fueled by cheap debt, and growing savings boosted by government stimulus during the pandemic. The ratio of household net worth to disposable personal income has climbed more than 40% since the global financial crisis — from 5.5 to 7.7.

Household Net Worth/ Disposable Personal Income

At the same time, unemployment (3.7%) has fallen close to record lows, increasing inflationary pressures as employers compete for scarce labor.

Unemployment

Real Growth

Hours worked contracted by an estimated 0.12% in November (-1.44% annualized).

Real GDP & Hours Worked

But annual growth rates for real GDP growth (1.9%) and hours worked (2.1%) remain positive.

Real GDP & Hours Worked

Heavy truck sales are also a solid 40,700 units per month (seasonally adjusted). Truck sales normally contract ahead of recessions, marked by light gray bars below, providing a reliable indicator of economic growth. Sales below 35,000 units per month would be bearish.

S&P 500

Inflation & Interest Rates

The underlying reason for the economy’s resilience is the massive expansion in the money supply (M2 excluding time deposits) relative to GDP, after the 2008 global financial crisis, doubling from earlier highs at 0.4 to the current ratio of 0.84. Excessive liquidity helped to suppress interest rates and balloon asset prices, with too much money chasing scarce investment opportunities. In the hunt for yield, investors became blind to risk.

S&P 500

Suppression of interest rates caused the yield on lowest investment grade corporate bonds (Baa) to decline below CPI. A dangerous precedent, last witnessed in the 1970s, negative real rates led to a massive spike in inflation. Former Fed Chairman, Paul Volcker, had to hike the Fed funds rate above 19.0%, crashing the economy, in order to tame inflation.

S&P 500

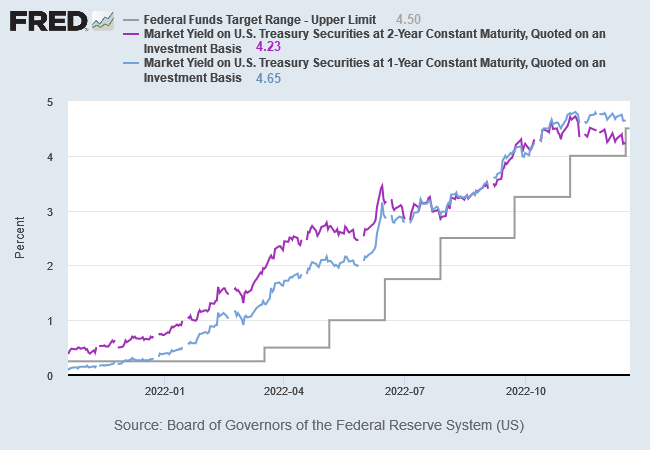
The current Fed chair, Jerome Powell, is doing his best to imitate Volcker, hiking rates steeply after a late start. Treasury yields have inverted, with the 1-year yield (4.65%) above the 2-year (4.23%), reflecting bond market expectations that the Fed will soon be forced to cut rates.

S&P 500

A negative yield curve, indicated by the 10-year/3-month spread below zero, warns that the US economy will go into recession in 2023. Our most reliable indicator, the yield spread has inverted (red rings below) before every recession declared by the NBER since 1960*.

S&P 500

Bear in mind that the yield curve normally inverts 6 to 18 months ahead of a recession and recovers shortly before the recession starts, when the Fed cuts interest rates.

Home Prices

Mortgage rates jumped steeply as the Fed hiked rates and started to withdraw liquidity from financial markets. The sharp rise signals the end of the 40-year bull market fueled by cheap debt. Rising inflation has put the Fed on notice that the honeymoon is over. Deflationary pressures from globalization can no longer be relied on to offset inflationary pressures from expansionary monetary policy.

S&P 500

Home prices have started to decline but have a long way to fall to their 2006 peak (of 184.6) that preceded the global financial crisis.

S&P 500

Stocks

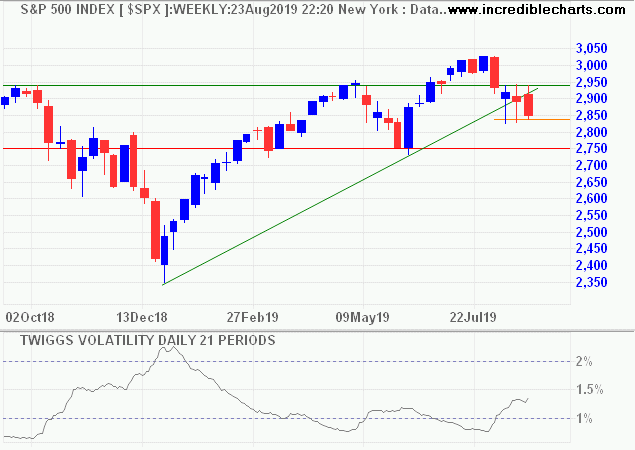
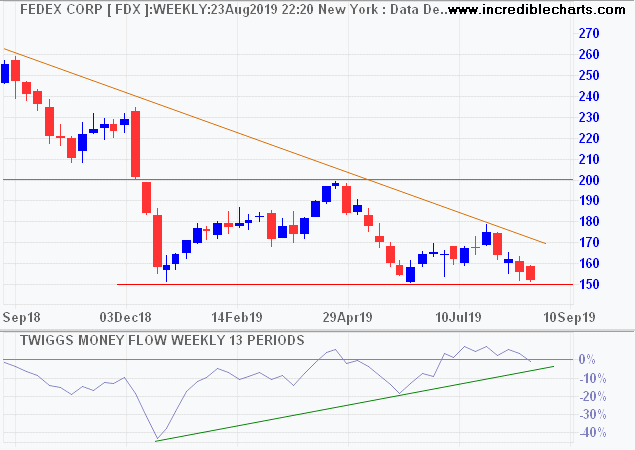
The S&P 500 is edging lower, with negative 100-day Momentum signaling a bear market, but there is little sign of panic, with frequent rallies testing the descending trendline.

S&P 500

Bond market expectations of an early pivot has kept long-term yields low and supported stock prices. 10-Year Treasury yields at 3.44% are almost 100 basis points below the Fed funds target range of 4.25% to 4.50%. Gradual withdrawals of liquidity (QT)  by the Fed have so far failed to dent bond market optimism.

10-Year Treasury Yield & Fed Funds Rate

Treasuries & the Bond Market

Declining GDP is expected to shrink tax receipts, while interest servicing costs on existing fiscal debt are rising, causing the federal deficit to balloon to between $2.5 and $5.0 trillion according to macro/bond specialist Luke Gromen.

Federal Debt/GDP & Federal Deficit/GDP

With foreign demand for Treasuries shrinking, and the Fed running down its balance sheet, the only remaining market  for Treasuries is commercial banks and the private sector. Strong Treasury issuance is likely to increase upward pressure on yields, to attract investors. The inflow into bonds is likely to be funded by an outflow from stocks, accelerating their decline.

Energy

Brent crude prices fell below $80 per barrel, despite slowing releases from the US strategic petroleum reserve (SPR). Demand remains soft despite China’s relaxation of their zero-COVID policy — which some expected to accelerate their economic recovery.

S&P 500

European natural gas inventories are near full, causing a sharp fall in prices. But prices remain high compared to their long-term average, fueling inflation and an economic contraction.

S&P 500

Europe

European GDP growth is slowing, while inflation has soared, causing negative real GDP growth and a likely recession.

S&P 500

Australia, Base Metals & Iron Ore

Base metals rallied on optimism over China’s reopening from lockdowns. Normally a bullish sign for the global economy, breakout above resistance at 175 was short-lived, warning of a bull trap.

S&P 500

Iron ore posted a similar rally, from $80 to $110 per tonne, but is also likely to retreat.

S&P 500

The ASX benefited from the China rally, with the ASX 200 breaking resistance at 7100 to complete a double-bottom reversal. Now the index is retracing to test its new support level. Breach of 7000 would warn of another test of primary support at 6400.S&P 500

China

Optimism over China’s reopening may be premature. Residential property prices continue to fall.

S&P 500

The reopening also risks a massive COVID exit-wave, against an under-prepared population, when restrictions are relaxed.

“In my memory, I have never seen such a challenge to the Chinese health-care system,” Xi Chen, a Yale University global health researcher, told National Public Radio in America this week. With less than four intensive care beds for every 100,000 people and millions of unvaccinated or partially protected older adults, the risks are real.

With official data highly unreliable, it is hard to track exactly what impact China’s U-turn is having. Authorities on Friday reported the first Covid-19 deaths since most restrictions were lifted in early December, but there have been reports that funeral homes in Beijing are struggling to handle the number of bodies being brought in.

“The risk factors are there: eight million people are essentially not vaccinated,” said Huang Yanzhong, senior fellow for global health at the Council on Foreign Relations.

“Unless this variant has evolved in a way that makes it harmless, China can’t avoid what happened in Taiwan or in Hong Kong,” he added, referring to significant “exit waves” in both places.

The scale of the surge is unlikely to be apparent for months, but modelling suggests it could be grim. A report from the University of Hong Kong released on Thursday warned that a best case scenario is 700,000 fatalities – forecasts from a UK-based analytics firm put deaths at between 1.3 and 2.1 million.

“We’re still at a very early stage in this particular exit wave,” said Prof Ben Cowling, an epidemiologist at the University of Hong Kong. (The Telegraph)

China relied on infrastructure spending to get them out of past economic contractions but debt levels are now too high for stimulus on a similar scale to 2008. Expansion of credit to local government and real estate developers is likely to cause further stagnation, with the rise of zombie banking and real estate sectors — as Japan experienced for more than three decades — suffocating future growth.

S&P 500

Conclusion

Resilient consumer spending, high household net worth, and a tight labor market all make the Fed’s job difficult. If the current trend continues, the Fed will be forced to hike interest rates higher than the bond market expects, in order to curb demand and tame inflation.

Expected contraction of European and Chinese economies, combined with rate hikes in the US, are likely to cause a global recession.

There are two possible exits. First, if central banks stick to their guns and hold interest rates higher for longer, a major and extended economic contraction is almost inevitable. While inflation may be tamed, the global economy is likely to take years to recover.

The second option is for central banks to raise inflation targets and suppress long-term interest rates in order to create a soft landing. High inflation and negative real interest rates may prolong the period of low growth but negative real rates would rescue the G7 from precarious debt levels that have ensnared them over the past decade. A similar strategy was successfully employed after WWII to extricate governments from high debt levels relative to GDP.

As to which option will be chosen is a matter of political will. The easier second option is therefore more likely, as politicians tend to follow the line of least resistance.

We have refrained from weighing in on the likely outcome of the Russia-Ukraine conflict. Ukraine presently has the upper hand but the conflict is a wild card that could cause a spike in energy prices if it escalates or a positive boost to the European economy in the unlikely event that peace breaks out.

Our strategy is to remain overweight in gold, critical materials, defensive stocks and cash, while underweight bonds and high-multiple technology stocks. In the longer term, we will seek to invest cash in real assets when the opportunity presents itself.

Acknowledgements

  • Hat tip to Macrobusiness for the Pantheon Macroeconomics (China Residential) and Goldman Sachs (China Local Government Funding & Excavator Hours) charts.

Notes

* The yield curve inverted ahead of a 25% fall in the Dow in 1966. The NBER declared a recession but later changed their minds and airbrushed it out of their records.

Retail sales, missing workers and the inflation threat

The October labor report shows hours worked were roughly unchanged from September and still 100K below the pre-pandemic high (5.25m). But GDP of 19.5 trillion is up slightly when compared to 19.2T in Q3 2019, indicating that productivity has improved.

Real GDP & Hours Worked

Monthly retail sales for September, on the other hand, were way above trend.

Retail Sales

People are spending Dollars they didn’t earn, courtesy of record government stimulus.

That is one of the primary causes of rising consumer prices (red below): when demand outstrips supply.

Average Hourly Earnings & CPI

A rising CPI in turn causes second run inflation through higher wage demands (green and gray above) if central banks fail to act quickly. They become embedded and difficult to dislodge.

The combined effect of the pandemic and government stimulus has had a profound impact on the US labor market. The economy added 5.8 million jobs in the 10 months to October, at an average of 580K per month. That rate is likely to slow as the economy reopens and enhanced unemployment benefits end.

We are missing 4.2 million employees, compared to the pre-pandemic peak of 152.5m jobs, and seem unlikely to find them, judging by the 10.4 million job openings in September. High levels of job openings are likely to exert continuing upward pressure on wages.

Non-farm Payroll & Job Openings

The missing workers — aided by government handouts — have either retired, quit their jobs to day-trade Tesla and crypto-currencies, or have re-assessed their work-life priorities. No doubt there will be a trickle back to the workforce — as day-traders encounter reversion to the mean and/or savings run low — but the Fed needs to reassess its full employment target. Failure to do so would leave interest rates too low for too long and allow second run inflation to become entrenched. The only way to then dislodge it is with the kind of drastic measures that Paul Volcker used in the early eighties, with the fed funds rate peaking at 20%.

Fed Funds Rate under Paul Volcker

USA: Sales up, daily COVID-19 cases down but jobs still scarce

Daily new COVID-19 cases in the US are clearly falling as the vaccine roll-out takes effect.

USA: COVID-19 Daily Cases

But daily deaths are still rising and may take another few weeks to level off.

USA: COVID-19 Daily Deaths

January payroll figures show the economic recovery has stalled, with total jobs contracting by 6.08% compared to January 2020.

Payroll Growth

Hours worked are down 4.4% compared to last year.

Real GDP & Hours Worked

Average hourly earnings jumped 5.44% for production and non-supervisory workers but these are distorted by strong job losses in the lowest pay grades.

Hourly Wage Rates

Retail sales (excluding food) have also been artificially boosted by government stimulus which added roughly 20% to disposable income.

Retail Sales Excluding Food

Light vehicle sales are similarly boosted.

Light Vehicles

While housing starts are climbing in response to record low mortgage rates.

Housing Permits & Starts

Total unemployment claims (state and federal) declined to a still high 17.8 million for the week ended January 16th.

DOL: State & Federal Unemployment Claims

The proposed Biden stimulus will support households and businesses but employment is likely to remain weak until the COVID-19 outbreak is clearly under control.

Conclusion

Economic activity is expected to remain weak in the first half of 2021. A key determinant will be the length of time it takes to bring the COVID-19 outbreak under control. Subsequent recovery is likely to need strong fiscal support, with federal debt expected to grow faster than GDP in 2021. This will require continued Treasury purchases by the Fed and commercial banks, with interest rates remaining low throughout 2021.

Nasdaq: Devil take the hindmost

I am fond off quoting Jesse Livermore’s maxim “You don’t argue with the tape” but Livermore was a keen student of market conditions and based his decisions on far more than just price action in the market.

We are witnessing a spectacular stock market rally, driven by retail investors and hedge funds piling into the market while institutional investors are sitting on the sidelines.

The Nasdaq 100 broke through resistance at 10,000, new highs signaling a fresh primary advance. Bearish divergence on Twiggs Money Flow index may warn of selling pressure but it is hard to argue with the tape. Only a fall below 9500 would signal another decline and that seems unlikely at present.

Nasdaq 100

Even retail sales (ex food) have recovered sharply, from -15.3% in April to -1.4% in May (annual % gain).

Retail Sales (ex Food)

Light vehicle sales are more sluggish but June sales of 13.05 million are still a sizable bounce.

Light Vehicle Sales

So why are many old investment hands acting with such caution?

We know that the efforts to contain the COVID19 outbreak are struggling, with over 60,000 new cases per day, but the economy still seems in good shape.

COVID19 Daily Cases

Source JHU CSSE

Let’s look at where the money is coming from.

Federal Debt

Treasury debt has expanded by more than $3 trillion in the last four months (March 9 – July 9) as the government does everything in its power to cushion the economy from an unprecedented shutdown. Rescuing airlines, bailing out Boeing, emergency business loans, job preservation schemes, and supporting Fed purchases of a wide variety of financial assets to keep the plumbing of financial markets open. Every way they can, government has been flooding the market with money and some of that has found its way to the stock market. Whether through boosting stock purchases, enabling companies to raise debt or boosting consumer spending to buoy up sales, the market is flying on borrowed money.

Steep up-trends like this typically end in a blow-off. A trend is self-reinforcing if rising prices attract more investors who in turn bid up prices even further. A steady influx of new investors is required to sustain the trend, else it dies.

Similar self-reinforcing cycles are evident in nature, where they expand violently outward at an exponential rate until they run out of fuel. The fuel driving the event may differ, from dry tinder in a forest fire, warm ocean temperatures in a hurricane, consumable vegetation in a locust plague, …..or exposed population in a virus outbreak. The cycle expands, feeding on itself, until the fuel is exhausted.

A stock market blow-off is no different. The up-trend will continue for as long as rising prices are able to attract new investors. It will stop when the source of new money dries up. In this case, when Treasury tries to slow the unsustainable growth in federal debt. Then it becomes a case of devil-take-the-hindmost as a preponderance of sellers attempt to offload their stocks on a rapidly shrinking pool of buyers.

US Stocks: Bull or Bear?

I have read several commentators proclaiming that the crisis is over and the stock market and US economy are back on track for solid growth. Let’s examine some of the evidence.

The Yield Curve (Bearish)

While the US yield curve has uninverted in the past and yet a recession has still come along, the uninversion seen in recent months coming after such a shallow and short-lived inversion provides confidence that the inversion seen last year gave a false signal…. (Shane Oliver at AMP)

Treasury 10 Year-3 Month Yield Differential

Yield curve inversions seldom last long. For one simple reason: the Fed fires up the printing press to reduce short-term interest rates and boost the economy. The yield curve uninverted before the last three recessions and this time looks no different.

Consumer Confidence (Bullish)

Retail sales kicked up in December, a sign of growing consumer confidence.

Retail excluding Auto

Auto sales are still flat but housing starts have also jumped.

Housing Starts & Permits

Economic Activity (Bearish)

When it comes to economic activity, Cass freight shipments are falling.

Cass Index

Rail freight indicators also point to declining activity levels.

Rail Freight

Employment (Neutral)

Leading employment indicators, such as temporary jobs and job openings, warn that labor market growth is slowing.

Temporary Jobs

Job Openings

But overall payroll growth, albeit subdued is still stable, with the 3-month TMO of non-farm payroll growth respecting the 0.5% amber warning level.

Payroll TMO

Valuations (Bearish)

Last week we compared market cap to profits before tax. This week, we compare to profits after tax. Recent levels above 20 have only previously been exceeded, in the past 60 years, during the Dotcom bubble.

Market Cap/Corporate Profits after Tax

Dallas Fed president Robert Kaplan conceded that expansion of the Fed balance sheet is helping to lift asset prices.

Commenting on the Fed’s massive liquidity response to the repo crisis, Kaplan said that “my own view is it’s having some effect on risk assets……It’s a derivative of QE when we buy bills and we inject more liquidity; it affects all risk assets. This is why I say growth in the balance sheet is not free. There is a cost to it. And we need to be very disciplined about it and sensitive to it.”

This is a clear warning to investors to stay on the defensive. We maintain our view that stocks are over-valued and will remain under-weight equities (over-weight cash) until normal earnings multiples are restored.

Warren Buffett is not infallible but the level of cash on Berkshire’s balance sheet seems to indicate a similar view regarding stock valuations.

Berkshire Hathaway Cash Holdings

ASX 200: Don’t argue with the tape

“A prudent speculator never argues with the tape. Markets are never wrong; opinions often are.” ~ Jesse Livermore

The ASX 200 broke resistance at 6800, signaling a fresh advance with a short-term target of 7200. Declining Trend Index peaks still warn of secondary selling pressure at present. Expect retracement to test the new support level at 6800. Respect of support would confirm the advance.

ASX 200

But divergence from fundamentals is growing.

NAB cut their GDP forecast to 1.5% in their November Forward View.

Housing markets in Sydney and Melbourne have recovered somewhat, but building approvals for houses remain 21% below their 2017 high and 57% for apartments. Construction activity is likely to remain low.

Exports are strong, boosted by increased LNG exports, but iron ore prices are falling. Currently testing short-term support at 80, our long-term target for iron ore is $65/metric ton.

Iron Ore

Business investment has slowed, causing wages to stagnate.

Australia: Business Investment

Retail sales weakened as a consequence, contracting for the first time since the early 1990s.

Australia: Retail Sales

Annual credit growth slowed to 2.5%, the lowest since 2010.

Banks were spooked last week by AUSTRAC pursuing Westpac for 19.5 million breaches of anti money-laundering and counter-terrorism regulations. The ASX 300 Banks index broke support at 7600, completing a double-top reversal, but this week they consolidated in a narrow range. Expect retracement to test resistance at 7600. Declining peaks on the Trend Index, however, continue to warn of selling pressure. Respect of resistance would confirm the decline, with a target of 6800.

ASX 300 Banks

The ASX 200 REITs index broke out of its descending triangle, signaling another advance. Financial markets are searching for yield.

ASX 200 REITs

The ASX 300 Metals & Mining index penetrated its descending trendline, suggesting that a base is forming. Expect another test of support at 4100 (neckline of a large head-and-shoulders reversal pattern). Breach would offer a target of 3400. The Trend Index penetrated its descending trendline but a peak near zero would warn of continued selling pressure.

ASX 300 Metals & Mining

We shouldn’t argue with the market but we should wait for confirmation; bull and bear traps are common. Investors, bear in mind that market risk remains elevated. I leave you with this quote from Westpac in their recent credit update:

For businesses, the economic backdrop has become more challenging. The global economy is slowing and household spending is soft. In this environment business investment in the real economy has lost momentum across the non-mining sectors – which will weigh on credit demand.

….and on jobs, wages growth and household spending.

We maintain low exposure to Australian equities, with a focus on defensive and contra-cyclical stocks, because of our bearish outlook.

The high cost of uncertainty

High levels of uncertainty in international trade, geopolitical outlook, and domestic politics in the USA are likely to have a domino effect on business and consumer confidence.

Business is likely to postpone or curtail new investment decisions. This is already evident in a down-turn in new capital formation, along with GDP growth, in the first half of the calendar year.

New Capital Formation

A similar picture is emerging in construction spending.

Construction/GDP

CEO confidence levels are way down.

CEO Confidence Levels

A slow-down in business investment in turn impacts on employment, causing a decline in payroll growth and average weekly hours worked.

Non-farm Payroll Growth and Weekly Hours Worked

Which in turn impacts on consumer sentiment as employees’ anticipation of future earnings declines.

Consumer Sentiment

The feedback loop will be completed if consumption falls. Retail sales dipped sharply in late 2018 but are keeping their head above water.

Retail Sales

And purchases of durables, like light motor vehicles, have leveled off but there is no significant decline so far.

Light Vehicle Sales (Units)

New housing starts and building permits even kicked up in August in response to lower interest rates.

Housing Starts

Consumers have, so far, continued spending but a down-turn in the stock market would weigh heavily on sentiment and consumption.

The S&P 500 broke its rising trendline, indicating a correction. Bearish divergence on Twiggs Money Flow warns of secondary selling pressure and a test of support at 2800. Breach of support is by no means certain but would offer a target of 2400.

S&P 500

We have reduced our equity exposure for International Growth to 34% of portfolio value because of our bearish outlook for the global economy.

Hope is not a strategy

Bob Doll’s outlook this week at Nuveen Investments is less bearish than my own:

Trade-related risks seem to be growing. President Trump looks to be holding out hope that the U.S. economy will stay resilient in the face of escalating tariffs and rising tensions. So far, the U.S. economy has not faltered, thanks largely to continued strength in the consumer sector and labor market. But if business confidence crumbles (as it has in parts of Europe), it could lead to serious economic damage…..

The president’s recent actions to delay the implementation of some new tariffs show that he is sensitive to the market impact of his trade policies. But the erratic nature of his on-again, off-again approach adds too policy uncertainty. At this point, we can’t predict the ultimate economic impact from these issues. Our best guess is that the U.S. remains more than a year away from the next recession, but risks are rising. In addition to the solid consumer sector, we don’t see financial stress in the system. Liquidity is still broadly available, and fixed income credit spreads are generally stable outside of the energy sector.

With additional Federal Reserve rate cuts already priced into the markets and bond yields falling sharply, the only catalyst for better equity market performance could be improving global economic data. We hold out hope that the global economy will improve, and still think there is a better-than-even chance of manufacturing activity and export levels to grow. But those improvements will take some time, suggesting equities will remain volatile and vulnerable for now.

Where we seem to differ is on the inevitability of the US-China trade war escalating into full-blown disengagement. This week’s events have not helped.

China’s national English language newspaper, Global Times, under the People’s Daily, announced new tariffs.

Global Times

Followed by an admission that the timing of the announcement was intended to cause maximum disruption to US stock markets.

Global Times

The inevitable Twitter tantrum ensued.

Donald Trump

The President also tweeted “Now the Fed can show their stuff!”

He is deluded if he thinks that the Fed can help him here. The best response would be announcement of a major infrastructure program (not a wall on the Mexican border). Otherwise business confidence will decline due to the increased uncertainty. Business investment will contract as a result and slow employment growth.

Retail sales have shown signs of recovery in recent months but will decline if consumer confidence erodes.

Retail Sales

Especially consumer durables such as light motor vehicles and housing.

Consumer Durables Production

The global economy is already contracting, as indicated by falling crude oil

Nymex Light Crude

…and commodity prices.

DJ-UBS Commodity Index

Volatility (21-Day) is rising as the S&P 500 tests support at 2840. Breach is likely and would test primary support at 2750.

S&P 500 Volatility

Bearish divergence (13-Week Money Flow) on both the S&P 500 and Nasdaq 100 (below) warn of selling pressure. The Nasdaq 100 is likely to test primary support at 7000.

Nasdaq 100

The Russell 2000 Small Caps ETF (IWM) is testing primary support at 146. Follow through below 145 is likely and would signal a primary down-trend.

Russell 2000 Small Caps ETF

Fedex breach of support at 150 would also warn of a primary down-trend and slowing activity in the US economy.

Fedex (FDX)

We maintain our bearish outlook and have reduced equity exposure for international stocks to 40% of portfolio value because of elevated risk in the global economy.

Still cautious

Inflationary pressures are easing, with average hourly earnings growth declining to 3.35% in June, for Production and Non-Supervisory Employees, and 3.14% for Total Private sector.

Average Wage Rates

But this warns that economic growth is slowing. Annual growth in hours worked has slowed to 1.25%, suggesting a similar decline in GDP growth for the second quarter.

Real GDP and Hours Worked

Jobs growth held steady at 1.5% for the 12 months ended June 2019, after a decline from 2.0% in January.

Payroll Growth

Further decline in jobs growth is likely in the months ahead and a fall below 1.0% would warn that recession is imminent.

The Case Shiller index warns that growth in housing prices is slowing.

Case Shiller Index

Growth in construction expenditure (adjusted for inflation) has stalled.

Construction Expenditure/CPI

Retail sales growth is faltering.

Retail Sales

Units of light vehicle sales has stalled.

Light Vehicle Sales

And capital goods orders (adjusted for inflation) are faltering.

Manufacturers Orders for Capital Goods

One of the few bright spots is corporate bond spreads — the difference between lowest investment grade (Baa) and equivalent Treasury yields — still low at 2.3%, indicating that credit risk is benign.

Corporate Bond spreads

The S&P 500 broke through 2950 and is testing 3000. The 3000 level is an important watershed, double the 2000 and 2007 highs at 1500 (1552 and 1576 to be exact), and I expect strong resistance.

S&P 500

A rising Trend Index indicates buying pressure but this seems to be mainly stock repurchases and institutional buying. Retail money, as indicated by investment flows into ETFs, favors fixed income over equities despite the low yields.

ETF Flows source: ETF.com

It’s still a good time to be cautious.

The prevailing wisdom is that markets are always right. I take the opposite position. I assume that markets are always wrong……I watch out for telltale signs that a trend may be exhausted. Then I disengage from the herd and look for a different investment thesis. Or, if I think the trend has been carried to excess, I may probe going against it. Most of the time we are punished if we go against the trend. Only at an inflection point are we rewarded.

~ George Soros

China holds its head above water

A quick snapshot from the latest RBA chart pack.

Manufacturing is holding its head above water (50 on the PMI chart) and industrial production shows a small upturn but investment growth is falling, as in many global economies including the US and Australia. Retail sales growth has declined but remains healthy at 10% a year.

China

Electricity generation continues to climb but steel, cement and plate glass production all warn that real estate and infrastructure development are slowing.

China

Interest rates remain accommodative.

China

Real estate price growth is slowing but remains an unhealthy 10% a year. Real estate development investment rallied in response to lower interest rates but is clearly in a long-term decline.

China

There are no signs of an economy in immediate trouble but there are indications that the real estate and infrastructure boom may be ending. Through a combination of fiscal stimulus and accommodative monetary policy the Chinese have managed to stave off a capitalism-style correction. But failure to clear some of the excesses of the past decade will mean that the inevitable correction, when it does come, is likely to display familiar Asian severity (Japan 1992, Asian Crisis 1997).