S&P 500 buying pressure but payrolls disappoint

August labor stats, released today, point to low real GDP growth for Q3. Growth in weekly hours worked came in at a low 1.09% and GDP is likely to follow.

Real GDP and Hours Worked

While inflation is not the primary concern at the Fed right now, rising annual hourly wage rate growth (3.46% for total private) flags an increase in underlying inflationary pressure. This may make the Fed more hesitant about cutting rates despite Donald Trump’s tweet storm.

Average Hourly Wage Rate

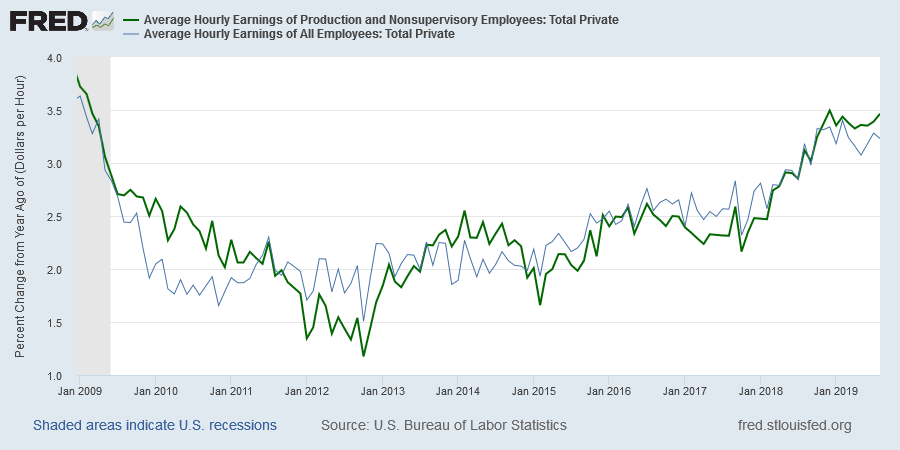
Most important is the continued decline in annual payroll growth. At 1.38% for August, further weakness is likely and a fall below 1.0% would warn of an economic slow-down.

Real GDP and Hours Worked

The S&P 500 is headed for another test of resistance at 3000. The Trend Index oscillating above zero for the last 9 months indicates buying pressure but I expect strong resistance at 3000. Upside is limited while downside risks are expanding.

S&P 500

Semiconductors are doing better than expected, despite the trade war, but I suspect will weaken when the surge in orders ahead of tariffs tails off.

Semiconductors

Retail has stalled since late 2018 and bearish divergence on the Trend Index suggests selling pressure.

Retail

Automobiles, in a decline since 2017, have rallied over the last 6 months. But, again, further weakness is expected.

Automobiles

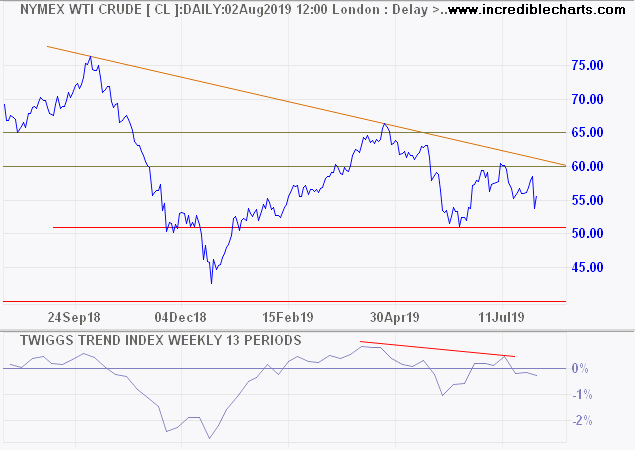
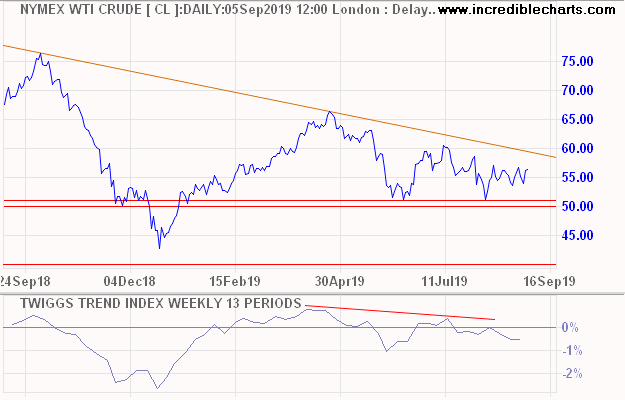
On the global front, weak crude oil prices flag an anticipated slow-down in the global economy. Breach of support at $50/$51 per barrel would be a strong bear signal, warning of a decline to $40 per barrel.

Nymex Light Crude

We maintain our bearish outlook and have reduced equity exposure for international stocks to 40% of portfolio value.

S&P 500: Donald Trump and the next recession

Treasury yields continue to fall, with the 10-Year testing long-term lows at 1.50%. A sign that investors are growing increasingly risk averse.

10-Year Treasury Yields

Crude oil prices remain weak; a bearish signal for the global economy. Breach of support at $50/$51 per barrel would warn of a decline to $40.

Nymex Light Crude

Volatility (21-Day) above 1.0% on the S&P 500 is flashing an amber warning. Breakout above 2940 is likely and would signal another test of 3000. But expect stubborn resistance at our 3000 target level.

S&P 500 Volatility

Bearish divergence (13-Trend Index) on the Nasdaq 100 warns of secondary selling pressure. Breach of 7400 would warn of a test of primary support at 7000.

Nasdaq 100

Robert Shiller maintains that Donald Trump is unlikely to survive a recession:

“So far, with his flashy lifestyle, the US president has been a resounding inspiration to many consumers and investors. But his personal narrative is unlikely to survive an economic downturn….the end of confidence in Trump’s narrative is likely to be associated with a recession.

During a recession, people pull back and reassess their views. Consumers spend less, avoiding purchases that can be postponed: a new car, home renovations, and expensive vacations. Businesses spend less on new factories and equipment, and put off hiring. They don’t have to explain their ultimate reasons for doing this. Their gut feelings and emotions can be enough.”

I would go further and argue that Trump’s management style is likely to cause a recession.

Some of the aims the President is attempting, like addressing China’s unfair trade practices, are vitally important to long-term US interests and he should be given credit for tackling them. But his constant hyperbole, erratic behavior, with a constant mix of bouquets and brickbats, and on-again-off-again tactics, has elevated global uncertainty. Consumers are likely to increase savings and cut back on expenditure, while corporations may cut back on hiring and new investment, which could tip the economy into recession.

GDP growth contracted to 2.3% in the second quarter, while growth in hours worked contracted to 0.92% for the year ended July 2019, pointing to further falls in GDP growth for the third quarter.

Real GDP and Hours Worked

August employment figures are due for release next week and will either confirm or allay our fears.

We maintain our bearish outlook and have reduced equity exposure for international stocks to 40% of portfolio value.

S&P 500: Treasuries reflect flight to safety

10-Year Treasury yields plunged below 2.0% on Donald Trump’s announcement of further tariffs (10% on $300bn) on China. The fall reflects rising demand for Treasuries as a safe haven in these turbulent times.

10-Year Treasury Yield

The spread between 10-Year and 3-Month Treasuries recovered above zero. This is a bearish sign: recession normally follows the recovery and not the initial inversion.

10-Year 3-Month Treasury Spread

The S&P 500 retreated below 3000 on Trump’s announcement, strengthening the bearish divergence signal on Twiggs Money Flow which warns of a correction. A test of support at 2750 is likely.

S&P 500

The Russell 2000 ETF (IWM) is expected to test primary support at 145. Small cap stocks have lagged the S&P 500 this year, highlighting risk aversion.

Russell 2000 Small Caps Index

Dow Jones Euro Stoxx 600, reflecting large cap stocks in the European Union, is similarly headed for a test of primary support at 365. Strong bearish divergence on the Trend Index warns of a reversal.

DJ Euro Stoxx 600

Falling commodity prices reflect market concerns for the global economy. A Nymex Light Crude breach of $51/barrel would signal a primary down-trend. Declining peaks on the Trend Index warn of selling pressure.

Nymex Light Crude

The DJ-UBS Commodity Index is similarly headed for a test of support at 75. Breach would signal a primary down-trend. A peak near zero on the Trend Index warns of strong selling pressure.

DJ-UBS Commodity Index

Dr Copper, often used as a barometer of the global economy, has breached primary support at 5800, signaling a decline. Again, a Trend Index peak below zero warns of strong selling pressure.

Copper

Employment stats for July have improved slightly, with Average Hourly Wages growth easing to 3.3% (Total Private).

Average Hourly Wage

And annual payroll growth ticked up to 1.5%

Employment Growth & FFR

But weekly hours worked are declining, warning that real GDP will decline further, after printing 2.3% for the second quarter.

Real GDP & Weekly Hours Worked

I have warned my clients to cut exposure to the market. It’s a good time to be cautious.

“Price is what you pay; value is what you get.”

~ Benjamin Graham

Still cautious

Inflationary pressures are easing, with average hourly earnings growth declining to 3.35% in June, for Production and Non-Supervisory Employees, and 3.14% for Total Private sector.

Average Wage Rates

But this warns that economic growth is slowing. Annual growth in hours worked has slowed to 1.25%, suggesting a similar decline in GDP growth for the second quarter.

Real GDP and Hours Worked

Jobs growth held steady at 1.5% for the 12 months ended June 2019, after a decline from 2.0% in January.

Payroll Growth

Further decline in jobs growth is likely in the months ahead and a fall below 1.0% would warn that recession is imminent.

The Case Shiller index warns that growth in housing prices is slowing.

Case Shiller Index

Growth in construction expenditure (adjusted for inflation) has stalled.

Construction Expenditure/CPI

Retail sales growth is faltering.

Retail Sales

Units of light vehicle sales has stalled.

Light Vehicle Sales

And capital goods orders (adjusted for inflation) are faltering.

Manufacturers Orders for Capital Goods

One of the few bright spots is corporate bond spreads — the difference between lowest investment grade (Baa) and equivalent Treasury yields — still low at 2.3%, indicating that credit risk is benign.

Corporate Bond spreads

The S&P 500 broke through 2950 and is testing 3000. The 3000 level is an important watershed, double the 2000 and 2007 highs at 1500 (1552 and 1576 to be exact), and I expect strong resistance.

S&P 500

A rising Trend Index indicates buying pressure but this seems to be mainly stock repurchases and institutional buying. Retail money, as indicated by investment flows into ETFs, favors fixed income over equities despite the low yields.

ETF Flows source: ETF.com

It’s still a good time to be cautious.

The prevailing wisdom is that markets are always right. I take the opposite position. I assume that markets are always wrong……I watch out for telltale signs that a trend may be exhausted. Then I disengage from the herd and look for a different investment thesis. Or, if I think the trend has been carried to excess, I may probe going against it. Most of the time we are punished if we go against the trend. Only at an inflection point are we rewarded.

~ George Soros

Employment lifts but S&P 500 tentative

Growth in total non-farm payrolls ticked up to 1.76% for the 12 months to April 2019, supporting Fed reluctance to cut interest rates.

Payroll Growth

The Philadelphia Fed Leading Index has been revised upwards, above a comfortable 1.0%.

Leading Index

Real GDP growth came in at a healthy 3.2% for the 12 months ended 31 March 2019 but growth in total hours worked sagged to 1.47%, suggesting that GDP growth is likely to slow.

Real GDP and Total Hours Worked

Growth in average hourly earnings came in at 3.23% (total private), suggesting that inflationary pressures remain under control. Little chance of a Fed rate hike either.

Average Hourly Earnings

The S&P 500 retracement respected support at 2900. Rising Money Flow indicates buying pressure but gains seem tentative.

S&P 500

US growth looks to continue but commodity prices warn that global growth is slowing.

Nymex crude penetrated its lower trend channel, warning of a correction. Despite the supply impact of increasing sanctions on Iran and Venezuela, and the threat of supply disruption in Libya.

Nymex Light Crude

A similar correction on DJ-UBS Commodities index reinforces that global demand is slowing.

DJ-UBS Commodities Index

Nasdaq breaks resistance

Real GDP growth came in at a healthy 3.2% for the 12 months ended 31 March 2019. Growth in total hours worked is lagging below 2.0%, suggesting that further acceleration is unlikely.

Real GDP and Total Hours Worked

Growth in total non-farm payrolls continues at close to 2.0%, minimizing the chance of an interest rate cut by the Fed.

Payroll Growth

The S&P 500 is testing its previous high at 2940, while a rising Trend Index (13-week) indicates buying pressure.

S&P 500

The Nasdaq 100 broke resistance at 7700, signaling another advance. Expect retracement to test the new support level. The long-term target is 9000.

Nasdaq 100

A rapid advance would outstrip earnings growth, with high earnings multiples warning of elevated risk. The market is quite capable of continuing this behavior for an extended time but I urge readers to be cautious and look for rising sales and earnings to support the stock price.

S&P 500: Expect slower earnings growth but no sign of recession

Credit growth in the US above 5% shows no signs of tighter credit conditions from an inverted yield curve. Growth in the broad money supply (MZM plus time deposits) has also not slowed, remaining close to 5%.

Credit Growth and Broad Money Supply

Growth in hours worked has slowed to 1.71%, suggesting that real GDP growth will dip below 2% in 2019 but remain positive.

Hours Worked and Real GDP growth

The Fed is unlikely to cut interest rates when average hourly earnings are growing at 3.2% (Total Private for the 12 months ended March 2019).

Average Hourly Wage Rate

The Leading Index from the Philadelphia Fed fell below 1%, giving an early warning that GDP growth will slow.

Philadelphia Fed Leading Index

A similar dip below 1% occurred ahead of the last three recessions. A second, stronger dip would warn of recession ahead.

Philadelphia Fed Leading Index

The S&P 500 is advancing to test resistance at 2950/3000, while the Volatility Index crossed below 1%, signaling that risk is no longer elevated.

Treasury Yields

Real GDP is likely to slow this year but remain positive. S&P 500 earnings growth is expected to slow and the index is likely to meet stubborn resistance at 2950/3000. The Fed is still a long way off cutting interest rates (a strong bear signal) and there is no sign of recession on the 2019 horizon. An extended top is the most likely outcome.

GDP up but ETF flows bearish

Real US GDP grew a healthy 3.1% in Q4 2018. Rising hours worked point to further gains in the new year.

Real GDP and Hours Worked

10-Year Treasury yields rallied slightly but only breakout above 2.80% would hint at a reversal in the down-trend, while breach of 2.60% would warn of further weakness. Inflows into Treasuries normally coincide with outflows from stocks, indicating a bearish outlook.

10-Year Treasury Yield

According to etf.com, US equities have seen $21.2 billion of ETF outflows YTD, while fixed income recorded $16.5 billion of inflows. The market remains risk-averse.

The S&P 500 continues to test resistance at 2800. Bearish divergence on 13-week Momentum (below) often precedes a market top. Another lower peak would reinforce the signal.

S&P 500 & Twiggs Momentum

A correction in March is likely, possibly on conclusion of US trade talks with China. Breach of 2600 would signal another test of primary support at 2350/2400.

“President Donald Trump said on Monday that he may soon sign a deal with Chinese leader Xi Jinping to end the countries’ trade war, if the two sides can bridge remaining differences.

But the lead U.S. negotiator said on Wednesday it was too early to predict the outcome. U.S. issues with China are ‘too serious’ to be resolved with promises from Beijing to purchase more U.S. goods and any agreement must include a way to ensure commitments are met, U.S. Trade Representative Robert Lighthizer said.” (Reuters)

We are in a bear market that is likely to continue for the foreseeable future. The strength of the next correction will confirm or refute this.

Right, as the world goes, is only in question between equals in power, while the strong do what they can and the weak suffer what they must.

~ Thucydides (460 – 400 B.C.)

It’s a funny kind of bear market

The US economy continues to show signs of robust good health.

Total hours worked are rising, signaling healthy real GDP growth.

Real GDP and Total Hours Worked

Growth in average hourly wage rates is rising, reflecting a tighter labor market. Underlying inflationary pressures may be rising but the Fed seems comfortable that this is containable.

Average Hourly Wage Rates

The Leading Index from the Philadelphia Fed maintains a healthy margin above 1.0% (below 1% is normally a signal that the economy is slowing).

Leading Index

But market volatility remains high, with S&P 500 Volatility (21-day) above 2.0%. A trough above 1% on the next multi-week rally would confirm a bear market — as would an index retracement that respects 2600.

S&P 500

The Nasdaq 100 is undergoing a similar retracement with resistance at 6500.

Nasdaq 100

The primary disturbance is the trade confrontation between the US and China. There is plenty of positive spin from both sides but I expect trade negotiations to drag out over several years — if they are successful. If not, even longer.

I keep a close watch on the big five tech stocks as a barometer of how the broader market will be affected. So far the results are mixed.

Apple is most vulnerable, with roughly 25% of projected sales to China. Recent downward revision of their sales outlook warns that Chinese retail sales are falling. AAPL is testing its primary support level at 150.

ASX 200

Facebook and Alphabet are largely unaffected by a Chinese slowdown, but have separate issues with user privacy. Facebook (FB) is in a primary down-trend.

ASX 200

While Alphabet (GOOGL) is testing primary support at 1000.

ASX 200

Amazon (AMZN) is similarly isolated from a Chinese slow-down although there may be a secondary impact on suppliers. Primary support at 1300 is likely to hold.

ASX 200

Microsoft (MSFT) is the strongest performer of the five. Their segment reporting does not provide details of exposure to China but it appears to be a small percentage of total sales.

ASX 200

The outlook for stocks is therefore mixed. Be cautious but try to avoid a bearish mindset, where you only see problems and not the opportunities. Even if China does suffer a serious slowdown we can expect massive stimulus similar to 2008 – 2009, so the impact on developing markets and resources markets may be cushioned.

Best wishes for the New Year.

Wage increases haven’t made a dent in profits

Average hourly earnings growth continues to rise, albeit at a leisurely pace. Average hourly earnings for all employees in the private sector grew at 2.92% over the last 12 months, while production and nonsupervisory employee earnings grew at 2.80% over the same period. The Fed is likely to adopt a more restrictive stance if hourly earnings growth, representing underlying inflationary pressures, exceeds 3.0%. So far the message from Fed Chair Jerome Powell has been business as usual, with rate hikes at a measured pace.

Average Hourly Earnings

Rising wage rates to-date have been unable, up to Q2 2018, to make a dent in corporate profits. Corporate profits are near record highs at 13.4%, while employee compensation is historically low at 69.5% of net value added. Past recessions have been heralded by rising employee compensation and falling corporate profits. What we are witnessing this time is unusual, with compensation rising, admittedly from record low levels, while profits rebounded after a low in Q4 2016. There is no indication that this will end anytime soon.

Corporate Profits and Employee Compensation as Percentage of Value Added

Weaker values (1.17%) on the Leading Index from the Philadelphia Fed reflect a flatter yield curve. A fall below 1.0% would be cause for concern.

Philadelphia Fed Leading Index

Our surrogate for real GDP, Total Payrolls x Average Weekly Hours Worked, is lagging behind recent GDP growth (1.9% compared to 2.9%) but both are rising.

Real GDP and Total Payroll*Average Hours Worked

Another good sign is that personal consumption expenditure, one of the key drivers of economic growth, is on the mend. Services turned up in Q2 2018 after a three-year decline. Durable goods remain strong. Nondurables are weaker but this may reflect a reclassification issue. New products such as Apple Music and Netflix are classified as sevices but replace sales of goods such as CDs and videos.

Personal Consumption

There is no cause for concern yet, but we will need to keep a weather-eye on the yield curve.

Markets are constantly in a state of uncertainty and flux, and money is made by discounting the obvious and betting on the unexpected.

~ George Soros