S&P 500: A cautious advance

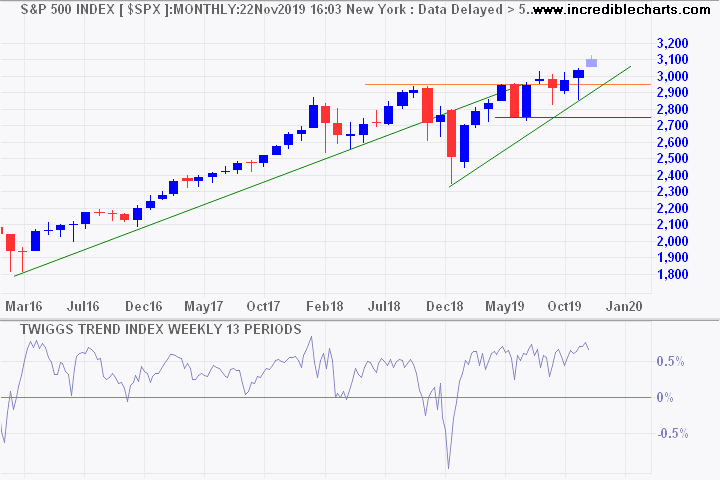
A monthly chart shows the S&P 500 cautiously advancing after breaking resistance at 3000. Short candle bodies reflect hesitancy but Trend Index troughs above zero remain bullish.

S&P 500

ETF flows reveal risk-averse investors, with outflows from US Equities in the last week and a relatively much larger outflow from Leveraged ETFs. Inflows are mainly into Fixed Income and Inverse.

ETF Flows

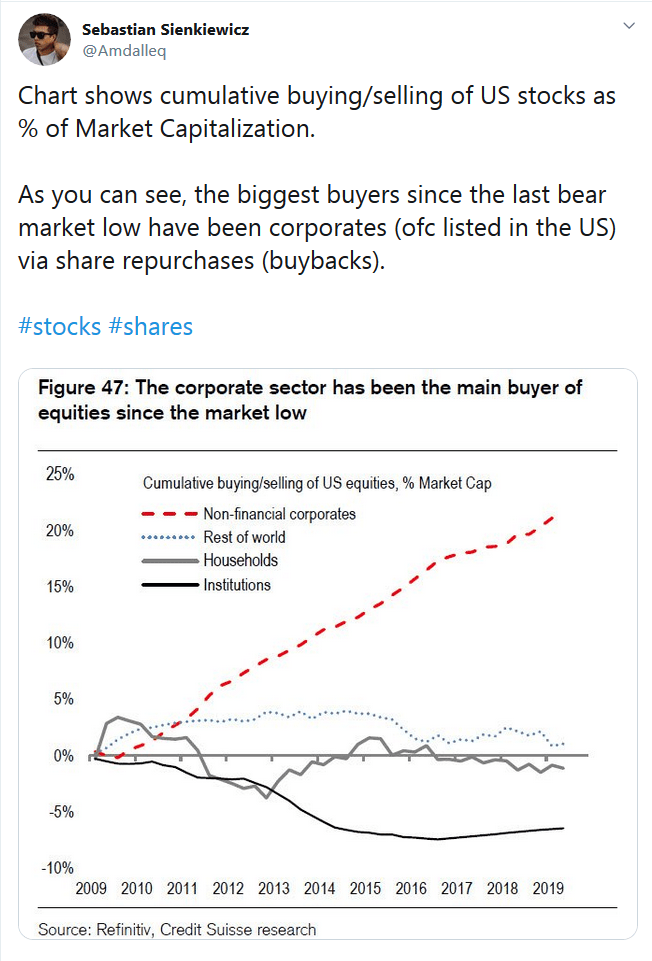
Year-to-date flows tell a similar story, with outflows from Equities and into Fixed Income. So where is the money flow into equities coming from?

Twitter: Buybacks

Meanwhile, the Fed has eased up on their balance sheet expansion now that the PBOC is back in the market. But broad money (MZM plus time deposits) continues to spike upwards, warning that the Fed is trying to head off a potential liquidity squeeze. They are not always successful. A similar spike occurred before the last two recessions.

Fed Assets and Broad Money Growth

The personal savings rate is climbing. Far from a positive sign, this warns that personal consumption, the largest contributor to GDP, is likely to fall.

Saving Rate

This is a dangerous market and we urge investors to be cautious.

Outlook for 2018

At this time of year we are usually inundated with projections for the year ahead, from predictions of imminent collapse to expectations of a record year.

We live in a world of uncertainty, where both extremes are possible, but neither is likely.

We are clearly in stage 3 (the final stage) of a bull market. Risk premiums are close to record lows. The yield spread between lowest investment-grade (Baa) bonds and equivalent risk-free Treasuries has crossed to below 2.0 percent, levels last seen prior to the 2008 global financial crisis. The VIX is also close to its record low, suggesting high levels of investor confidence.

Corporate Bond Spreads and VIX

Money supply continues to grow at close to 5.0 percent, reflecting an accommodative stance from the Fed. MZM, or Zero Maturity Money, is basically M1 plus travelers checks and money market funds.

Zero-Maturity Money

Inflationary forces remain subdued, with average hourly wage rates growing at below 2.5 percent per year. A rise above 3.0 percent, which would pressure the Fed to adopt a more restrictive monetary policy, does not appear imminent.

Average Hourly Wage Rates

Tax relief and higher commodity prices are likely to exert upward pressure on inflation in the year ahead. But the Fed’s stated intention of shrinking its balance sheet, with a reduction of $100 billion in the first 12 months, is likely to have an opposite, contractionary effect.

The Leading Index from the Philadelphia Fed gave a bit of a scare, dipping below 1.0 percent towards the end of last year. But data has since been revised and the index now reflects a far healthier outlook.

Philadelphia Fed Leading Index

A flattening yield curve has also been mooted as a potential threat, with a negative yield curve preceding every recession over the last 50 years.

Yield Differential 10-Year compared to 2-Year and 3-Month Treasuries

A yield differential, between 10-year and either 2-year or 3-month Treasuries, below zero would warn of a recession. When long-term yields fall below short-term yields financial markets stop working efficiently and bank lending tends to contract. Banks, who generally borrow at short-term rates and lend at long-term rates, find their margins are squeezed and become strongly risk-averse. Contracting lending slows the economy and normally leads to recession.

But we are some way from there. If we take the last cycle as an example, the yield curve started flattening in 2005 (when yield differentials fell below 1 percent) but a recession only occurred in 2008. The market could continue to thrive for several years before the impact of a negative yield curve is felt. To exit now would seem premature.

Should we Worry that Velocity of Money is plunging?

Some writers have attributed slow GDP growth in the US to the plunging velocity of money.

In layman’s terms, the velocity of money is the ratio between your bank balance and the amount you spend. For the economy as a whole, it is measured as the ratio of GDP (or national income) against the total stock of money (or money supply).

When the economy is hot, consumers have a higher propensity to spend — or invest in the latest hot stock — and the ratio normally rises. When the economy cools, the ratio falls.

If the ratio was fixed, the job of central bankers would be simple: print more money and GDP would rise.

M1 Money Supply and GDP Growth

Unfortunately that is not the case. GDP growth has remained slow, post-2007, despite a sharp boost in the money supply.

M1 is a narrow definition of money: cash in circulation plus travelers checks, demand deposits (at call) and check account balances.

The ratio of GDP to M1 money (or M1 Velocity) has almost halved, from a 2007 high of 10.7 to a current low of 5.5.

M1 Money Supply and GDP Growth

Does this mean that consumers are feverishly stuffing cash into mattresses as the economy goes into a death-dive or is there a more rational explanation?

Examine the above chart more closely and you will see a clear relationship until 1980 between the velocity of money and interest rates (in this case the Fed funds rate). When interest rates rise, the velocity of money rises. So when interest rates fall, as they have post-2007, to near zero, the velocity of money should fall. As it has done.

The anomaly is not the current fall in the velocity of money but the rise in velocity of money between 1990 and 2000, when interest rates were falling. There are two explanations that I can think of. One is the digital revolution, with the advent of online bank accounts and automated clearing of business checking accounts which enabled depositors to minimize balances in non-interest bearing accounts. Second, is the rapid growth of money market funds which fall outside the ambit of M1 and M2.

Velocity of money measured as GDP/MZM gives a clearer picture, with velocity rising when rates rise and falling when rates fall. MZM is M1 plus all savings deposits and money market funds that are redeemable (at par) on demand.

M1 Money Supply and GDP Growth

We should expect to see the velocity of money recover as interest rates rise. If that doesn’t happen, then it will be time to worry.

Strange as it may seem, we could witness something really unusual: if higher interest rates stimulate GDP.