
“An investor’s task is not to predict the future but to properly analyze the present.”
ASX: Dead cat bounce
The ASX 200 found support at 6450/6500 followed by a hesitant rally: a candle with a long tail followed by a short-bodied evening star. This resembles a typical dead cat bounce. Breach of 6450 is likely and would warn of a decline to test support at 6000.

Gerard Minack in a recent report suggested that Australia is likely to go into recession if the saving ratio increases. For the past few years, consumption has been growing at a faster rate than disposable income as households dig into savings to maintain their lifestyle.

Households may continue this behavior because of the wealth-effect (they feel asset-rich but cash-poor) but are likely to reverse sharply if housing and equity prices fall. Which is what we are witnessing at present.

In our view, the housing decline is likely to continue despite the RBA cutting rates. While rates may be attractive, job prospects are looking shaky. Loan approvals are falling.

Business investment is falling.

Job ads are about to go over a cliff. Trade tensions with China will add to our woes.

Public funded infrastructure construction is slumping.

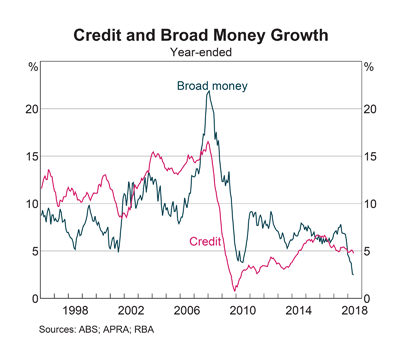
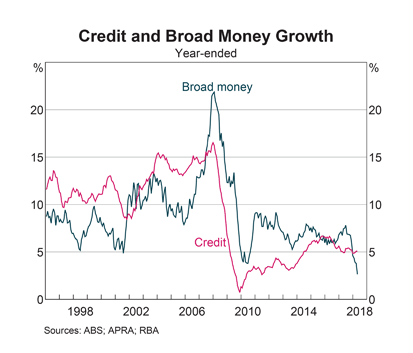
Credit and broad money supply growth are approaching 2009 GFC lows.

And our iron ore tailwind is dying fast. Iron ore spot prices have fallen off a cliff. Breach of support at 95 is likely and would warn of another decline to test support at 80.

I plan to further increase the level of cash in our Australian Growth portfolio.
ASX 200 gravestone
Australian housing prices are falling.

Fueled by declining credit growth.

With falling contribution to GDP growth from dwelling investment, and mining investment shrinking….

GDP growth is expected to weaken further.

The gravestone candlestick on the ASX 200 weekly chart warns of selling pressure. The primary trend is down and the index unlikely to break through resistance at 6300. Expect a correction to test support at 5650; breach would warn of another decline.

I remain cautious on Australian stocks and hold more than 40% in cash and fixed interest in the Australian Growth portfolio.
The Aussie economy is quietly falling apart | Macrobusiness
You’d have to be as blind as the RBA to miss the signals. GDP is made up of six components and they are not going well on balance:
- government consumption is strong and likely to stay that way;
- government investment is peaking as the NBN rolls off and infrastructure starts fade;
- household consumption is weakening with car sales and international travel down sharply plus retail looking highly questionable;
- business investment has been good and the outlook for six months is solid but it will track broader demand and housing investment is about to tumble;
- inventories will ebb and flow;
- net exports (volumes) are weak owing to China’s thermal coal blockade and the drought despite the LNG ramp up.
In short, the Australian economy is quietly falling apart and if it does not receive any new juice soon it is going to crater as we enter the Hayne Royal Commission recommendations, the federal election stall and Labor’s reform agenda. I have now downgraded my outlook for domestic demand from what was already bearish:

This is an environment in which unemployment will rise at a decent clip threatening much worse outcomes as that feeds back into asset prices.
That markets and economists are still forecasting rate hikes is ridiculous. That cuts remain off the radar of nearly all is bizarre.
By Houses & Holes (David Llewellyn-Smith). Reproduced with kind permission from Macrobusiness.
Comment: Time for the government to go big on infrastructure spending. Not school halls or pink batts insulation but real infrastructure like transport and communications investments (5G for example) that will boost long-term GDP growth.
Australia: Good news and bad news
First, the good news from the RBA chart pack.
Exports continue to climb, especially in the Resources sector. Manufacturing is the only flat spot.

Business investment remains weak and is likely to impact on long-term growth in both profits and wages.

The decline is particularly steep in the Manufacturing sector and not just in Mining.

But government investment in infrastructure has cushioned the blow.

Profits in the non-financial sector remain low, apart from mining which has benefited from strong export demand.

Job vacancies are rising which should be good news for wage rates. But this also means higher inflation and, down the line, higher interest rates.

The housing and financial sector is our Achilles heel, with household debt climbing a wall of worry.

House prices are shrinking despite record low interest rates.

Broad money and credit growth are slowing, warning of a contraction.
Bank profits remain strong.
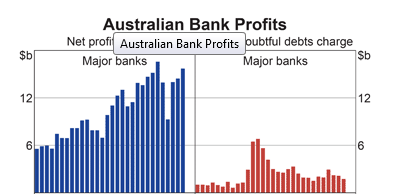
But capital ratios are low, with the bulk of profits distributed to shareholders as dividends. The ratios below are calculated on risk-weighted assets. Raw leverage ratios are a lot weaker.

One of the primary accelerants of the housing bubble and household debt has been $900 billion of offshore borrowings by domestic banks. The chickens are coming home to roost, with bank funding costs rising as the Fed hikes interest rates. In the last four months the 90-day bank bill swap rate (BBSW) jumped 34.5 basis points.
The banks face a tough choice: pass on higher interest rates to mortgage borrowers or accept narrower margins and a profit squeeze. With an estimated 30 percent of households already suffering from mortgage stress, any interest rate hikes will impact on both housing prices and delinquency rates.
I continue to avoid exposure to banks, particularly hybrids where many investors do not understand the risks.
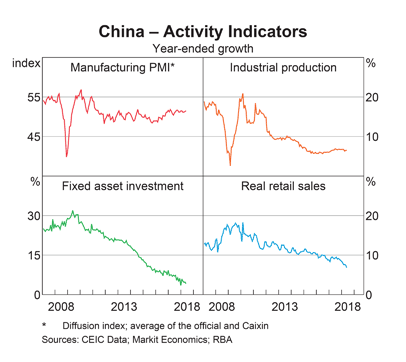
I also remain cautious on mining because of a potential slow-down in China, with declining growth in investment and in retail sales.
12 Charts on the Australian economy
Australian GDP grew at a robust 3.1% for the year ended 31 March 2018 but a look at the broader economy shows little to cheer about.
Wages growth is slowing, with the Wage Price Index falling sharply.

Falling growth in disposable income is holding back consumption (e.g. retail spending) and increasing pressure on savings.

Housing prices are high despite the recent slow-down, while households remain heavily indebted, with household debt at record levels relative to disposable income.

Housing price growth slowed to near zero and we are likely to soon see house prices shrinking.

Broad money growth is falling sharply, reflecting tighter financial conditions, while credit growth is also slowing.
Mining profits are up, while non-mining corporation profits (excluding banks and the financial sector) have recovered to about 12% of GDP.

But business investment remains weak, which is likely to impact on future growth in both profits and wages.

Exports are strong, especially in the Resources sector. Manufacturing is the only flat spot.

Iron ore export tonnage continues to grow, while demand for coal has leveled off in recent years.

Our dependence on China as an export market also continues to grow.

Corporate bond spreads — the risk premium over the equivalent Treasury rate charged to non-financial corporate borrowers — remain low, reflecting low financial risk.

Bank capital ratios are rising but don’t be fooled by the risk-weighted percentages. Un-weighted Common Equity Tier 1 leverage ratios are closer to 5% for the four major banks. Common Equity excludes bank hybrids which should not be considered as capital. Conversion of hybrids to common equity was avoided in the recent Italian banking crisis, largely because of the threat this action posed to stability of the entire financial system.

Low capital ratios mean that banks are more likely to act as “an accelerant rather than a shock-absorber” in times of crisis (2014 Murray Inquiry). Professor Anat Admati from Stanford University and Neel Kashkari, President of the Minneapolis Fed are both campaigning for higher bank capital ratios, at 4 to 5 times existing levels, to ensure stability of the financial system. This is unlikely to succeed, considering the political power of the bank sector, unless the tide goes out again and reveals who is swimming naked.
The housing boom has run its course and consumption is slowing. The banks don’t have much in reserve if the housing market crashes — not yet a major risk but one we should not ignore. Exports are keeping us afloat because we hitched our wagon to China. But that comes at a price as Australians are only just beginning to discover. If Chinese exports fail, Australia will need to spend big on infrastructure. And infrastructure that will generate not just short-term jobs but long-term growth.
Is GDP doomed to low growth?
GDP failed to rebound after the 2008 Financial Crisis, sinking into a period of stubborn low growth. Economic commentators have advanced many explanations for the causes, while the consensus seems to be that this is the new normal, with the global economy destined to decades of poor growth.

This is a classic case of recency bias. Where observers attach the most value to recent observations and assume that the current state of affairs will continue for the foreseeable future. The inverse of the Dow 100,000 projections during the Dotcom bubble.
Real GDP for Q1 2018 recorded 2.9% growth over the last 4 quarters. Not exactly shooting the lights out, but is the recent up-trend likely to continue?

Neils Jensen from Absolute Return Partners does a good job of summarizing the arguments for low growth in his latest newsletter:
The bear story
Putting my (very) long-term bearishness on fossil fuels aside for a moment, there is also a bear story with the potential to unfold in the short to medium-term, but that bear story is a very different one. It is a story about GDP growth likely to suffer as a consequence of the oil industry’s insatiable appetite for working capital, which is presumably a function of the low hanging fruit having been picked already.
In the US today, the oil industry ties up 31 times more capital per barrel of oil produced than it did in 1980, when we came out of the second oil crisis. ….Such a hefty capital requirement is a significant tax on economic growth. Think of it the following way. Capital is a major driver of productivity growth, which again is a key driver of economic growth. Capital tied up by the oil industry cannot be used to enhance productivity elsewhere, i.e. overall productivity growth suffers as more and more capital is ‘confiscated’ by the oil industry.
I am tempted to remind you (yet again!) of one of the most important equations in the world of economics:
∆GDP = ∆Workforce + ∆Productivity
We already know that the workforce will decline in many countries in the years to come; hence productivity growth is the only solution to a world drowning in debt, if that debt is to be serviced. Why? Because we need economic growth to be able to service all that debt.
Now, if productivity growth is going to suffer for years to come, all this fancy new stuff that we all count on to save our bacon (advanced robotics, artificial intelligence, etc.) may never be fully taken advantage of, because the money needed to make it happen won’t be there. It is not a given but certainly a risk that shouldn’t be ignored.
….For that reason, we need to retire fossil fuels as quickly as possible. Ageing of society (older workers are less productive than their younger peers) and a global economy drowning in debt (servicing all that debt is immensely expensive, leaving less capital for productivity enhancing purposes) are widely perceived to be the two most important reasons why productivity growth is so pedestrian at present.
I am not about to tell you that those two reasons are not important. They certainly are. However, the adverse impact the oil industry is having on overall productivity should not be underestimated.
I tend to take a simpler view, where I equate changes in GDP to changes in hours worked and in capital investment:
∆GDP = ∆Workforce + ∆Capital
Workers work harder if they are motivated or if there is a more efficient organizational structure, but these are a secondary influence on productivity when compared to capital investment.
The chart below compares net capital formation by the corporate sector (over GDP) to real GDP growth. It is evident that GDP growth rises and falls in line with net capital formation (or investment as it is loosely termed) by corporations.

A quick primer (with help from Wikipedia):
- Capital Formation measures net additions to the capital stock of a country.
- Capital refers to physical (or tangible) assets and includes plant and equipment, computer software, inventories and real estate. Any non-financial asset used in the production of goods or services.
- Capital does not include financial assets such as bonds and stocks.
- Net Capital Formation makes allowance for depreciation of the existing capital stock due to wear and tear, obsolescence, etc.
Net Capital Formation peaked at around 5.0% from the mid-1960s to the mid-1980s, made a brief recovery to 4.0% during the Dotcom bubble and has since struggled to make the bar at 3.0%. Rather like me doing chin-ups.

There are a number of factors contributing to this.
Intangible Assets
Capital formation only measures tangible assets. The last two decades have seen a massive surge in investment in intangible assets. Look no further than the big five on the Nasdaq:
| Stock | Symbol | Price ($) | Book Value ($) | Times Book Value |
|---|---|---|---|---|
| Amazon | AMZN | 1582.26 | 64.85 | 24.40 |
| Microsoft | MSFT | 95.00 | 10.32 | 9.21 |
| FB | 173.86 | 26.83 | 6.48 | |
| Apple | AAPL | 169.10 | 27.60 | 6.12 |
| Alphabet | GOOGL | 1040.75 | 235.46 | 4.42 |
Currency Manipulation
Capital formation first fell off the cliff in the 1980s. This coincides with the growth of currency manipulation by Japan, purchasing excessive US foreign reserves to suppress the Yen and establish a trade advantage over US manufacturers. China joined the party in the late 1990s, exceeding Japan’s current account surplus by 2006. Currency suppression creates another incentive for corporations to offshore or outsource manufacturing to Asia.

Tax on Offshore Profits
Many large corporations took advantage of low tax rates in offshore havens such as Ireland, avoiding US taxes while the funds were held offshore. This created an incentive for large corporations to invest retained earnings offshore rather than in the USA.
The net effect has been that retained earnings are invested elsewhere, while new capital formation in the USA is almost entirely funded by debt.

Donald Trump’s tax deal will make a dent in this but will not undo past damage. The horse has already bolted.
Offshore Manufacturing
Apart from tax incentives, lower labor costs (enhanced by currency manipulation) led large corporations to set up or outsource manufacturing to Asia and other developing countries. In effect, offshoring capital formation and — more importantly — GDP growth to foreign destinations.
Offshoring Jobs
Along with manufacturing plants, blue-collar jobs also moved offshore. While this may improve the company bottom-line for a few years, the long-term, macro effects are devastating.
Think of it this way. If you build a manufacturing plant offshore rather than in the USA you may save millions of dollars a year in labor costs. Great for the bottom line and executive bonuses. But one man’s wage is another man/woman’s income (when he/she spends it). So, from a macro perspective, the US loses GDP equal to the entire factory wages bill plus the wage component of any input costs. A far larger figure than the company’s savings. As more companies offshore jobs, sales growth in the USA is affected. In the end this is likely to more than offset the savings that justified the offshore move in the first place.
Stock Buybacks
Stock buybacks accelerate EPS (earnings per share) growth and are great for boosting stock prices and executive bonuses. But they create the illusion of growth while GDP stands still. There is no new capital formation.
Can GDP Growth Recover?
Yes. Restore capital formation and GDP growth will recover.
How to do this:
Trump has already made an important move, revising tax laws to encourage corporations to repatriate offshore funds.
But more needs to be done to create a level playing field.
Stop currency manipulation and theft of technology by developing countries, especially China. Trump has also signaled his intention to tackle this thorny issue.
Repatriating offshore manufacturing and jobs is a much more difficult task. You can’t just pack a factory in a box and ship it home. There is also the matter of lost skills in the local workforce. But manufacturing jobs are being lost globally at an alarming rate to new technology. In the long-term, offshore manufacturing plants will be made obsolete and replaced by new automated, high-tech manufacturing facilities. Incentives need to be created to encourage new capital formation, especially high-tech manufacturing, at home.
Stock buybacks, I suspect, will always be around. But remove the incentive to boost stock prices by targeting the structure of executive bonuses. It would be difficult to isolate benefits from stock buybacks and tax them directly. But removing tax on dividends — in my opinion far simpler and more effective than the dividend imputation system in Australia — would remove the incentive for stock buybacks and make it difficult for management to justify this action to investors.
We already seem to be moving in the right direction. The last two points are relatively easy when compared to the first two. If Donald Trump manages to pull them (the first two) off, he will already move sharply upward in my estimation.
Judge a tree by the fruit it bears.
~ Matthew 7:15–20
Why Fixed Investment is Critical to the US Recovery
The financial sector normally acts as a conduit, channeling savings from private investors to the corporate sector. When the conduit works effectively, the injection of demand from corporate Investment is sufficient to offset the ‘leakage’ from demand caused by Savings. Savings patterns alter during a financial crisis, however, with concerned households cutting back on expenditure and using any surplus to pay down debt, rather than depositing with the bank or buying stocks. Household Savings rise but corporate Investment contracts. The resulting ‘leakage’ from demand causes GDP to spiral downward.
When Investment contracts, unemployment rises. The relationship is evident on the graph below, but it could also be said that Investment rises when employment grows — businesses invest in anticipation of rising demand. Either way, it is safe to conclude that rising investment and job growth go hand-in-hand.

Fixed Investment and Corporate Profits
Rising corporate profits also lead to increased investment. The lag on the graph below — investment growth follows profit growth — clearly illustrates the causative relationship.

This is an encouraging sign, as the current surge in corporate profits is likely to be followed by rising investment — and further job growth.
Weekly Earnings and GDP
Rising weekly earnings already point to improving aggregate demand and consequent investment growth.

All that is missing is for the federal government to increase investment in productive* infrastructure to further boost job growth.
*Infrastructure investment needs to generate a sufficient return to repay debt incurred to fund the spending. Something many politicians seem to forget when preoccupied with buying votes for the next election.
More….
The Long War [podcast]
The Impunity Trap by Jeffrey D. Sachs | Project Syndicate
RIP ZIRP | PIMCO
How much longer can the global trading system last? | Michael Pettis
Crude retraces
Gold breaks $1180 support
Itzhak Perlman: Schindler’s List (video)
There are two kinds of discontented in this world, the discontented that works and the discontented that wrings its hands. The first gets what it wants and the second loses what it has. There is no cure for the first but success and there is no cure at all for the second.
~ Og Mandino
Why Fixed Investment is Critical to the US Recovery
The financial sector normally acts as a conduit, channeling savings from private investors to the corporate sector. When the conduit works effectively, the injection of demand from corporate Investment is sufficient to offset the ‘leakage’ from demand caused by Savings. Savings patterns alter during a financial crisis, however, with concerned households cutting back on expenditure and using any surplus to pay down debt, rather than depositing with the bank or buying stocks. Household Savings rise but corporate Investment contracts. The resulting ‘leakage’ from demand causes GDP to spiral downward.
When Investment contracts, unemployment rises. The relationship is evident on the graph below, but it could also be said that Investment rises when employment grows — businesses invest in anticipation of rising demand. Either way, it is safe to conclude that rising investment and job growth go hand-in-hand.
Fixed Investment and Corporate Profits
Rising corporate profits also lead to increased investment. The lag on the graph below — investment growth follows profit growth — clearly illustrates the causative relationship.
This is an encouraging sign, as the current surge in corporate profits is likely to be followed by rising investment — and further job growth.
Weekly Earnings and GDP
Rising weekly earnings already point to improving aggregate demand and consequent investment growth.
All that is missing is for the federal government to increase investment in productive* infrastructure to further boost job growth.
*Infrastructure investment needs to generate a sufficient return to repay debt incurred to fund the spending. Something many politicians seem to forget when preoccupied with buying votes for the next election.
Secular stagnation?
Economic recovery after the Great Recession has been disappointing.
Employment levels remain low. Official unemployment figures ignore the declining participation rate. Employment levels, in the 25 to 54 age group, for males remain roughly 6%, and females 5%, below their previous peaks. Using the 25 to 54 age group eliminates distortions from student levels and from baby boomers postponing retirement.

Manufacturing earnings, as would be expected, are also weak.

Sales growth remains poor.

And real GDP growth is slow.

US Headwinds
Stanley Fischer, Vice Chairman at the Fed, in his address to a conference in Sweden, attributed slow recovery in the US to three major aggregate demand headwinds:
The housing sector
The housing sector was at the epicenter of the U.S. financial crisis and recession and it continues to weigh on the recovery. After previous recessions, vigorous rebounds in housing activity have typically helped spur recoveries. In this episode, however, residential construction was held back by a large inventory of foreclosed and distressed properties and by tight credit conditions for construction loans and mortgages. Moreover, the wealth effect from the decline in housing prices, as well as the inability of many underwater households to take advantage of low interest rates to refinance their mortgages, may have reduced household demand for non-housing goods and services. Indeed, some researchers have argued that the failure to deal decisively with the housing problem seriously prolonged and deepened the crisis.
A slow housing recovery is unfortunately the price you pay for protecting the banks. By supporting house prices through artificial low interest rates, you prevent markets from clearing excess inventories.
Fiscal policy
The stance of U.S. fiscal policy in recent years constituted a significant drag on growth as the large budget deficit was reduced. Historically, fiscal policy has been a support during both recessions and recoveries. In part, this reflects the operation of automatic stabilizers, such as declines in tax revenues and increases in unemployment benefits, that tend to accompany a downturn in activity. In addition, discretionary fiscal policy actions typically boost growth in the years just after a recession. In the U.S., as well as in other countries — especially in Europe — fiscal policy was typically expansionary during the recent recession and early in the recovery, but discretionary fiscal policy shifted relatively fast from expansionary to contractionary as the recovery progressed.
Anemic exports
A third headwind slowing the U.S. recovery has been unexpectedly slow global growth, which reduced export demand. Over the past several years, a number of our key trading partners have suffered negative shocks. Some have been relatively short lived, including the collapse in Japanese growth following the tragic earthquake in 2011. Others look to be more structural, such as the stepdown in Chinese growth compared to its double digit pre-crisis pace. Most salient, not least for Sweden, has been the impact of the fiscal and financial situation in the euro area over the past few years.
Supply-side
Fischer also cites the weak labor market, declining investment and disappointing productivity growth as inhibiting aggregate production.
While I agree with his view of the labor market, we should not use the heady days of the Dotcom bubble as a benchmark for investment. Private nonresidential investment is recovering.

Productivity is also growing.

Other factors
There are two factors, however, that Fischer did not mention which, I believe, go a long way to explaining slow US growth.
Crude oil prices
In the last 4 decades, sharp rises in real crude oil prices have coincided with falling GDP growth and, in most cases, recessions. Crude prices remain elevated since the Great Recession and, I believe, are retarding economic growth. The blue line on the graph below plots crude oil (WTI) over the consumer price index (CPI).

Currency manipulation
China continues its aggressive purchase of US Treasuries in order to maintain a competitive advantage of the Yuan against the Dollar. Inflows on capital account — not only from China — include roughly $5 trillion of federal debt purchased since 2001. This keeps the US uncompetitive in export markets and places domestic manufacturers at a disadvantage when competing against imports.

Recent purchases of federal debt are sufficient to drive 10-Year Treasury yields through support at 2.40%/2.50%.

Glass half empty or half full?
Bears will no doubt seize on the headwinds to support their prediction of another market crash. I am reassured, however, that the economy has recovered as well as it has, given the difficulties it faces. None of the headwinds are likely to disappear any time soon, but progress in addressing these last two issues would go a long way to solving many of them.