A bi-polar world

There is much talk in the media of a multipolar world, with the split between the West and the BRICS, led by China & Russia. That may be relevant in the long-term but the immediate challenge for investors is a bi-polar world, where some markets are rallying strongly while others are collapsing. Even within the US market, we have some sectors rallying while others are collapsing.

The S&P 500 is still in a bear market but the index has rallied to test resistance between 4200 and 4300. Breakout would confirm the bull signal from 250-day Rate of Change crossing to above zero.

S&P 500

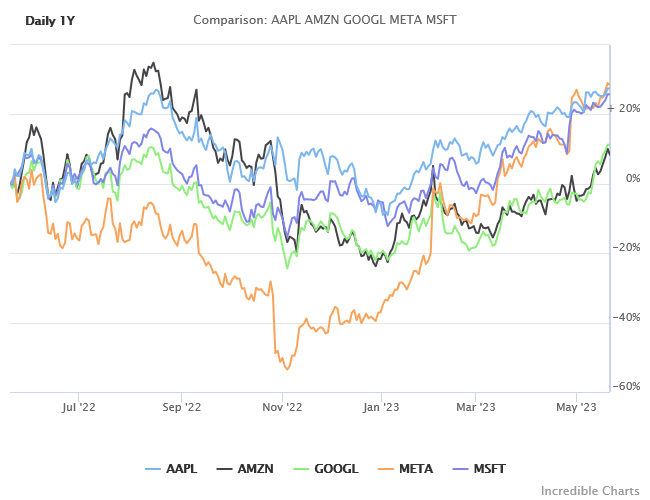
The big 5 technology stocks — Apple, Amazon, Alphabet (GOOGL), Meta Platforms, and Microsoft — have all rallied strongly since the start of 2023.

Big 5 Technology Companies

Volatility is elevated but declining peaks on Twiggs Volatility (21-day) suggest that this is easing.

S&P 500 & Twiggs Volatility

However, the rally is concentrated in big tech stocks, with small caps struggling to hold above support. The Russell 2000 iShares ETF (IWM) is testing the band of support between 164 and 170. Breach of support would signal a second downward leg in the bear market.

Russell 2000 ETF (IWM)

The Treasury yield curve is also inverted, with the ever-reliable 10-Year minus 3-Month spread at its lowest level (-1.49%) since 1981. Recessions tend to only occur after the spread recovers above zero — when the Fed starts cutting short term rates — which tells us that the recession is only likely to arrive in 2024.

Treasury Yield Spread: 10-Year minus 3-Month

The longer than usual lag may be the result of the “pig in the python” — a massive surge in liquidity injected into financial markets during the pandemic.

Commercial Bank Deposits/GDP

We are already seeing cracks in the dyke as liquidity starts to recede. Regional banks are in crisis, caused by the sharp hike in interest rates and the collapse in value of their “most secure” assets. Risk-weighted capital ratios are meaningless when bank investments in Treasury and Agency securities — which enjoy the lowest risk weighting — fall sharply in value. True levels of leverage are exposed and threaten bank solvency.

The S&P Composite 1500 Regional Banks Index ($XPBC) is testing support at 75 after a sharp decline. Not only do regional banks have solvency problems, caused by losses on Treasury and Agency investments, many are also over-exposed to commercial real estate (CRE) which faces a major fall in value, primarily in the office sector as demand for office space shrinks due to the shift to work-from-home after the pandemic.

S&P Composite 1500 Regional Banks Index ($XPBC)

There is always more than one cockroach — as Doug Kass would say — and regional banks are also threatened by a margin squeeze. Short-term rates have surged to higher than long-term rates, pressuring net interest margins. Banks are funded at the short-end and invest (and lend) at the long-end of the yield curve.

The Fed is unlikely to solve the regional bank problem easily, especially with the political impasse in Congress — needed to support any increase in deposit guarantees.

Commodities

Falling commodity prices warn that the global economy is contracting.

Brent crude is in a bear market, testing support at $70 per barrel. But US cude purchases — to re-stock their strategic petroleum reserve (SPR) — may strengthen support at this level.

Brent Crude

Copper broke support at $8500/tonne, signaling another test of $7000. Sometimes referred to as “Dr Copper” because of its “PhD in economics”, the metal has an uncanny ability to predict the direction of the global economy.

Copper

We use the broader Dow Jones Industrial Metals Index ($BIM) to confirm signals from Copper. The base metals index breached secondary support, at 167, warning of a test of primary support at 150.

Dow Jones Industrial Metals Index ($BIM)

Iron ore has also retraced, testing support at $100/tonne. Breach would warn of another test of $80.

Iron Ore

Dollar & Gold

The Dollar is also in a bear trend, testing support at 101. The recent rally in our view is simply a “dead cat bounce”, with another test of support likely. Breach would warn of another primary decline in the Dollar.

Dollar Index

Gold is in a bull market as the Dollar weakens. Dollar Index breach of 101 would likely cause a surge in demand for Gold, with breakout above $2050 signaling another primary advance — with a medium-term target of $2400 per ounce.

Spot Gold

Australia

The ASX 200 recent (medium-term) bull trend is losing steam, with the index ranging in a narrow band between 7200 and 7400 since April.

ASX 200

Breakout from that narrow band will provide a strong indication of future direction. Breach of 7200 is, in our view, far more likely — because of weakness in global commodity prices — and would warn of another test of primary support between 6900 and 7000.

ASX 200

The All Ordinaries Gold Index (XGD), however, is in a strong bull trend. Respect of support between 6900 and 7000 would strengthen the signal, while breakout above the band of resistance (7500 – 7700) would signal another primary advance, with a medium-term target of 8200.

All Ordinaries Gold Index

Conclusion

The US market is bi-polar, with large technology stocks leading a rally, while small caps and regional banks are struggling. The lag between an inverted yield curve and subsequent recession may be longer than usual because of the “pig in the python” — large injections of liquidity into financial markets during the pandemic.

Commodities are in a bear market, with falling crude and base metals warning of a global recession.

The Dollar is weakening and we expect a primary advance in Gold — with a medium-term target of $2400 per ounce — if the Dollar Index breaks support at 101.

The ASX medium-term rally is weakening and breach of 7200 would warn of another test of primary support. Two major influences are global commodity prices and major Wall Street indices.

Our outlook remains bearish despite the rally in the US technology sector. We are underweight in growth, cyclical and real estate sectors and overweight in gold, silver, defensive stocks, critical materials, cash, money market funds and short-term interest-bearing securities.

Netflix heralds end of COVID boom for tech stocks

A sharp fall in new Netflix subscribers may signal the end of the boom for many tech companies that enjoyed stellar gains since the start of the pandemic. Economies are starting to re-open as vaccination levels rise, warning of tepid growth ahead for companies that thrived during the COVID-19 lockdown.

Zoe Samios at The Age writes:

In the first three months of 2020, Netflix acquired 15.77 million paid subscribers, sending its already elevated shares into the stratosphere. In the corresponding period this year, Netflix added just 3.98 million subscribers, its results on Wednesday morning (AEST) showed.

Netflix (NFLX) momentum has slowed since July last year. Breach of support at 500 would warn of a correction, while breach of support at 460 would signal a primary down-trend.

Netflix (NFLX)

The big five technology stocks all enjoyed a huge surge, up to September 2 last year, gaining between 28% (GOOGL) and 91% (AMZN) since early January. Since then, only Alphabet (GOOGL) and Microsoft (MSFT) have recorded further gains.

AAPL,AMZN,GOOGL,FB,MSFT

The broad S&P 500 index has gained 16.5% since September 2, 2020.

Conclusion

Growth in large technology stocks is slowing as the economy re-opens.

Tech heavyweights pause for breath

Good progress has been made combating the pandemic but daily COVID cases seem to be struggling to break through a floor between 50 and 60 thousand. The vaccine roll-out is ahead of schedule but people need to stop listening to idiots like Rand Paul — who went to the Senate gym while infected — and listen to the Chief Medical Adviser whose advice is to wear a mask.

Daily US COVID Cases

Stocks have paused after the recent run up in Treasury yields. When both stocks and bonds are being sold, there is nowhere to hide.

The Nasdaq 100 is testing support at 12000. At this stage the correction looks mild, with declining Trend Index remaining above zero, but breach of 12000 would signal a test of the Sep 2020 low.

Nasdaq 100

The S&P 500 is performing better but Volatility troughs above 1.0% still warn of elevated risk.

S&P 500 & Twiggs Volatility 21-Day

The big five tech stocks are a mixed bag. Alphabet (GOOGL) and Facebook (FB) show strength. Microsft (MSFT) looks stable, while Mazon (AMZN) and Apple (AAPL) are trending lower.

AAPL, AMZN, GOOGL, FB, MSFT

When leaders no longer lead normally signals the final stage of a bull market. The chart below shows the Russell 2000 small caps ETF (IWM) clearly outperforming the large cap Nasdaq (QQQ) and S&P 500 (IVV) indices with all the tech heavyweights.

IVV, IWM, QQQ

@Schuldensuehner

The steeper yield curve benefits banks, who profit from the wider net interest margin. Major banks have climbed 60% to 80% over the past six months, with Goldman Sachs (GS) leading and Bank of America (BAC) the laggard.

Major Banks

Consumer durables sectors are, again, a mixed bag. Household Goods (HG) is flat, Apparel Retail (RA) is climbing steadily, while Automobiles (AU) is down sharply — mainly because of Tesla (TSLA).

Consumer Durables

Though light vehicle sales were down a million units in February.

Light Vehicle Sales

And heavy truck sales were down 4,000 units compared to January.

Heavy Truck Sales

Prospects for the tire industry are improving. Goodyear (GT) retraced to test its new support level after breaking out above its high from late 2019. Respect would confirm another advance.

Goodyear Tyre Co. (GT)

Conclusion

The recovery is going to be a long hard slog with frequent setbacks. Banks are doing nicely but stocks generally are over-priced and ripe for a major adjustment. There are signs that this is the final stage of the bull market and market risk is elevated.

S&P 500: Leaders no longer leading

Daily new cases of COVID-19 continue to spike upwards, warning of further shutdowns as medical facilities are overrun.

USA: Daily COVID-19 cases

Payrolls

The latest labor report disappointed, especially as the November survey came before the latest round of layoffs after states imposed tighter restrictions.

Payroll growth flattened, leaving total payroll down 5.99% compared to November last year.

Payrolls Annual Change

Hours worked are slightly more encouraging, down 4.68% on an annual basis, compared to -2.9% change in real GDP.

Real GDP & Hours Worked

Vaccines

Encouraging news on the vaccine front but “when you hear the cavalry is coming to your rescue, you don’t stop shooting. You redouble your efforts.” (Dr Anthony Fauci)

Now This News

Stocks

Progress in manufacturing vaccines that will soon be widely available has buoyed stocks despite the dismal economic outlook. The S&P 500 made new highs, assisted by hopes of further stimulus and ultra-low interest rates. The large megaphone pattern is a poor indicator of future direction but does flag unusual volatility.

S&P 500 SPDR (SPY)

Growth in the big five technology stocks has slowed in recent months, with only Alphabet (GOOGL) breaking above its September high. Too early to tell, but failure of market leaders to make new highs is typical of the late stages of a bull market.

AAPL, AMZN, GOOGL, MSFT, FB

Conclusion

Vaccines should succeed in flattening the third wave and suppressing future outbreaks but are unlikely to succeed in restoring the economy to normalcy.

Federal debt is at a record 123% of GDP and growing. Further stimulus is required to support the still-fragile recovery.

The Fed will continue to expand its balance sheet to support Treasury issuance.

Ultra-low interest rates are likely to stay for a number of years.

If massive federal debt, QE and ultra-low interest rates does not cause a spike in inflation, that will encourage authorities to push the envelope even further (we fear this would have disastrous consequences).

Unemployment is expected to remain high and GDP growth likely to remain low.

Zombie corporations and commercial real estate with unsustainable debt levels will continue to be a drag on economic growth.

Growth stocks are expected to remain overpriced relative to current and future earnings.

It’s a funny kind of bear market

The US economy continues to show signs of robust good health.

Total hours worked are rising, signaling healthy real GDP growth.

Real GDP and Total Hours Worked

Growth in average hourly wage rates is rising, reflecting a tighter labor market. Underlying inflationary pressures may be rising but the Fed seems comfortable that this is containable.

Average Hourly Wage Rates

The Leading Index from the Philadelphia Fed maintains a healthy margin above 1.0% (below 1% is normally a signal that the economy is slowing).

Leading Index

But market volatility remains high, with S&P 500 Volatility (21-day) above 2.0%. A trough above 1% on the next multi-week rally would confirm a bear market — as would an index retracement that respects 2600.

S&P 500

The Nasdaq 100 is undergoing a similar retracement with resistance at 6500.

Nasdaq 100

The primary disturbance is the trade confrontation between the US and China. There is plenty of positive spin from both sides but I expect trade negotiations to drag out over several years — if they are successful. If not, even longer.

I keep a close watch on the big five tech stocks as a barometer of how the broader market will be affected. So far the results are mixed.

Apple is most vulnerable, with roughly 25% of projected sales to China. Recent downward revision of their sales outlook warns that Chinese retail sales are falling. AAPL is testing its primary support level at 150.

ASX 200

Facebook and Alphabet are largely unaffected by a Chinese slowdown, but have separate issues with user privacy. Facebook (FB) is in a primary down-trend.

ASX 200

While Alphabet (GOOGL) is testing primary support at 1000.

ASX 200

Amazon (AMZN) is similarly isolated from a Chinese slow-down although there may be a secondary impact on suppliers. Primary support at 1300 is likely to hold.

ASX 200

Microsoft (MSFT) is the strongest performer of the five. Their segment reporting does not provide details of exposure to China but it appears to be a small percentage of total sales.

ASX 200

The outlook for stocks is therefore mixed. Be cautious but try to avoid a bearish mindset, where you only see problems and not the opportunities. Even if China does suffer a serious slowdown we can expect massive stimulus similar to 2008 – 2009, so the impact on developing markets and resources markets may be cushioned.

Best wishes for the New Year.

Tech leaders bearish

There are five tech giants that dictate market direction. All reflect bearish sentiment in the market but only Facebook (FB) is in a primary down-trend. Not enough to call this a bear market.

FAAAM

Facebook (FB) is the only one to have broken primary support. At present it is retracing to test the new resistance level at 150.

FB

Alphabet is headed for a test of primary support at 1000 while declining Money Flow warns of selling pressure.

GOOGL

Apple (AAPL) also signals selling pressure and has penetrated its rising trendline. Expect a test of primary support at 150.

AAPL

Amazon (AMZN) is stronger, respecting its LT trendline, but declining Money Flow  warns of selling pressure. Breach of 1500 would be bearish.

AMZN

Microsoft (MSFT) is strongest with Money Flow holding above zero. Breach of 100, however, would warn of a test of primary support at 85.

MSFT

If another, most likely AAPL or GOOGL, breaks primary support then the needle would swing into bear market territory.