No explanation required

In the past week, I have seen a number of market commentators attempting to explain the current correction. Reasons given vary from rising interest rates, Fed shrinking its balance sheet, the impact of trade tariffs on manufacturing input costs and inflation, mid-term elections and peak growth in earnings.

Truth is, there is no single reason that could justify the dramatic market falls. Some of the reasons cited are insufficient while others are invalid. But no explanation is necessary. Market sentiment has simply shifted. The scale has tipped and more investors are taking profits than new money coming into the market. When that happens, prices fall. And falling prices become a self-fulfilling prophecy, scaring off new investors and panicking investors with a short-term outlook.

How long this will go on for, I cannot tell. But I am sure there are growing numbers of long-term investors picking through the debris looking for opportunities. And the greater the fall, the greater the opportunity.

Earlier in the week I cited Netflix (NFLX) as one such example. Price has fallen almost 20% in October 2018, while recently released earnings announced a 34% year-on-year increase in revenue for the third quarter and a 130% increase in operating income.

Netflix

Patience is required but opportunities abound.

East to West

A quick recap of markets.

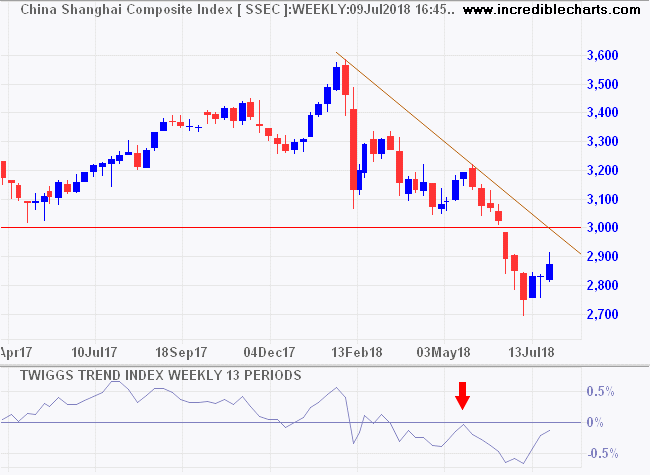
China’s Shanghai Composite Index is in a primary down-trend, having broken primary support at 2650, but rising troughs on the Trend Index warn of strong support. I suspect this is government-orchestrated as investors have little reason for optimism.

Shanghai Composite Index

India’s Nifty is testing primary support at 10,000.

Nifty

Europe is in a primary down-trend, with the DJ Euro Stoxx 600 respecting its former primary support level at 365/366.

DJ Euro Stoxx 600

The Footsie is testing primary support at 6900/7000.

FTSE 100

Dow Jones Industrial Average is undergoing a strong correction. Bearish divergence on the Trend Index warns of a reversal but only breach of primary support at 23,500, completing a double-top, would confirm.

Dow Jones Industrial Average

Dow Jones Transportation Average is already testing primary support at 10,000. Reversal signals on both averages would confirm a bear market according to Dow Theory.

Dow Jones Transportation Average

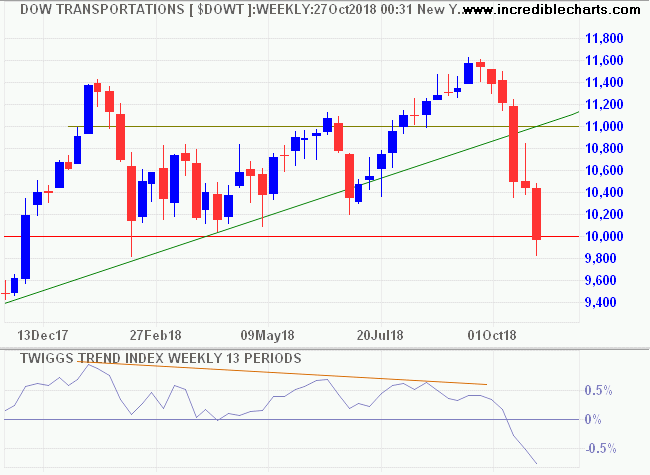
But technology stocks play a far larger role than in Charles Dow’s day, more than a hundred years ago. The Nasdaq 100 is still a long way above primary support at 6,300. Bearish divergence on Money Flow warns of selling pressure, but only breach of primary support would confirm a bear market.

Nasdaq 100

The only thing we have to fear is fear itself.

~ Franklin D. Roosevelt, 1933 inaugural address

East to West: Europe faces a stern test

The Shanghai Composite Index broke primary support at 2650 but rising troughs on the Trend Index indicate buying pressure. Expect retracement to test the new resistance level at 2700.

Shanghai Composite Index

India’s Nifty is testing primary support at 10,000. Descending peaks on the Trend Index warn of selling pressure. Breach of support at 10,000 would indicate weakness but we need a lower peak to confirm a down-trend.

Nifty Index

European stocks are under the pump, with threats from the Asian contagion, Brexit, Italy and recent US volatility. Breach of support at 365 warns of a primary down-trend.

DJ Euro Stoxx 600 Index

The DAX also breached primary support (11,800). Retracement respected the new resistance level and descending Trend Index peaks warn of growing selling pressure.

DAX Index

France’s CAC-40 index is testing primary support at 5000.

CAC-40 Index

The Footsie is testing primary support at 7000, with descending Trend Index peaks again warning of selling pressure. Breach would signal a primary down-trend.

FTSE Index

A down-turn in Europe would add to uncertainty in US markets.

Nasdaq warns of broad market correction

Tech stocks fell sharply, with the Nasdaq 100 closing below support at 7400, warning of a correction. Twiggs Money Flow (21-day) cross below zero indicates medium-term selling pressure. Follow-through of the index below 7300 would signal a correction to test 7000.

Nasdaq 100

The S&P 500 has so far respected support at 2870. Breach would confirm  a broad market correction and test the rising LT trendline at 2800.

S&P 500

Asia

In China, the Shanghai Composite Index is headed for another test of primary support at 2650. Trend Index peaks at/below zero indicate long-term selling pressure. Breach of 2650 would offer a long-term target of 2000, the 2014 low.

Shanghai Composite Index

India’s Nifty is undergoing a strong correction. Breach of support at 10,000 would warn of a primary down-trend.

Nifty Index

Europe

Dow Jones Euro Stoxx 50 is again testing primary support at 3300. A Trend Index peak at zero warns of mounting selling pressure. Breach of 3300 would warn of a primary decline, with a target of 3000.

DJ Euro Stoxx 600 Index

The Footsie is also testing primary support, at 7250, but a recovering Trend Index indicates buying pressure.

FTSE 100 Index

Rising US interest rates are already hurting developing economies like India and China, and a looming US-China trade war would threaten a global contraction.

Only when the tide goes out do you discover who’s been swimming naked.

~ Warren Buffett

East to West: Trade tariffs spark rally

Commodities rallied and Asian stocks found support after a three-month sell-off.

DJ-UBS Commodity Index

From Reuters (September 19):

Copper jumped to its highest in three weeks on Wednesday, boosted by a weaker dollar after a new round of U.S.-China trade tariffs were not as high as previously expected.

China will levy tariffs on about $60 billion worth of U.S. goods in retaliation for U.S. tariffs on $200 billion worth of Chinese goods. Washington’s new duties, however, were set at 10 percent for now, rising to 25 percent by the end of the year, rather than starting immediately at 25 percent…….

“In some ways the bad news had been priced into the markets and, if anything, the news on trade had been slightly less severe than we had thought it would be,” said Capital Economic analyst Caroline Bain.

“It’s still too early to talk about this as sustainable … it just seems to be a bit of a relief rally after all of the bad news.”

The Shanghai Composite Index rallied off primary support at 2650, a slight bullish divergence on the Trend Index signaling short-term buying pressure. Penetration of the descending trendline would suggest that a bottom is forming.

Shanghai Composite Index

Japan’s Nikkei 225 is testing its January high at 24,000.

Nikkei 225 Index

India’s Nifty is testing support at 11,000. Long tails indicate buying pressure. Respect of support would signal another advance.

Nifty Index

Europe

Dow Jones Euro Stoxx 50 rallied off primary support at 3300 but is yet to break the down-trend.

DJ Euro Stoxx 600 Index

The Footsie also rallied, finding support at 7250, but a declining Trend Index warns of continued selling pressure.

FTSE 100 Index

North America

The S&P 500 rallied off the new support level at 2875 and is likely to test its long-term target of 3000.

S&P 500

The Nasdaq 100, however, continues to test support at 7700. Breach would warn of a correction to test 7000.

Nasdaq 100

Canada’s TSX 60 found support at 950 but declining peaks on the Trend Index continue to warn of selling pressure.

TSX 60 Index

Markets are dominated by one concern, a US-China trade war, and volatility is likely to remain high until a resolution is found.

East to West: Bonds & tariffs hurt developing markets and crude prices

10-Year Treasury yields are consolidating in a triangle below long-term resistance at 3.00 percent. Breakout above 3.00 would signal a primary advance, ending the decades-long bull market in bonds. This would have a heavy impact on developing economies, including China, with a stronger Dollar forcing higher interest rates.

10-year Treasury Yields

A Trend Index trough above zero would signal buying pressure and a likely upward breakout.

Crude oil prices, as a consequence of higher interest rates and the threat of trade tariffs, are starting to form a top. Bearish divergence on the Trend Index warns of selling pressure. Breach of support at $65/barrel would signal reversal to a primary down-trend.

Nymex Light Crude

Commodity prices are leading, breach of support at 85.50 already having signaled a primary down-trend.

DJ-UBS Commodity Index

China’s Shanghai Composite Index is in a primary down-trend. Trend Index peaks below zero warn of selling pressure. Breach of support at 2700 is likely. The long-term target is the 2014 low at 2000.

Shanghai Composite Index

Germany’s DAX is headed for a test of primary support at 11,800. Descending peaks on the Trend Index warn of secondary selling pressure. Breach of primary support is uncertain but would offer a target of 10,500.

DAX

The Footsie also shows secondary selling pressure on the Trend Index, warning of a test of primary support at 6900/7000.

FTSE 100

In stark contrast, North American tech stocks have made huge gains in the last four months, but are now retracing to test support. Breach of the rising trendline and support at 7400 would warn of a correction; a test of the long-term rising trendline at 7000 the likely target.

Nasdaq 100

The S&P 500 has also made new highs. Penetration of the rising trendline would warn of a correction to the LT trendline at 2800.

S&P 500

North America leads the global recovery, developing markets including China are falling, while Europe is sandwiched in the middle, with potential loss of trade from East and West if a trade war erupts.

From the AFR today:

President Donald Trump said he’s ready to impose tariffs on an additional $US267 billion in Chinese goods on short notice, on top of a proposed $US200 billion that his administration is putting the final touches on.

“….I will say this: the world trading system is broken.” Trump is “dead serious” in his determination to push China to reform its trade policies, [White House economic adviser Larry Kudlow] added.

Can’t say he didn’t warn us.

East to West in three charts

The S&P 500 is making new highs while a rising Trend Index indicates buying pressure. Target for the advance is 3000.

S&P 500

China’s Shanghai Composite Index is in a primary down-trend. Trend Index peaks below zero warn of selling pressure. Breach of support at 2700 is likely and would offer a long-term target of the 2014 low at 2000.

Shanghai Composite Index

The Footsie broke support at 7600. Follow-through below 7500 warns of a correction to test primary support at 6900/7000.

FTSE 100

North America leads the global recovery, China is falling, while Europe is sandwiched in the middle, with potential loss of trade from East and West if a trade war erupts.

Bears in the East, Bulls in the West

Market fears of a trade war appear to be easing but investors in China and South Korea remain cautious.

The Shanghai Composite Index is retracing to test resistance at the former primary support level at 3000.

Shanghai Composite Index

Dow Jones – UBS Commodity Index shows a similar retracement in commodity prices.

DJ-UBS Commodity Index

While crude oil prices have found support at the LT rising trendline.

Nymex Light Crude

South Korea’s Seoul Composite Index is in a primary down-trend but retracement to test the former primary support level at 2350 is likely.

Seoul Composite Index

Japan is more isolated and the Nikkei 225 is testing resistance at 23,000. A rising Trend Index suggests that breakout is likely, which would test the January high at 24,000.

Nikkei 225 Index

India is stronger, with the Nifty breaking resistance at its January high of 11,100 to signal a primary advance with a target of 12,000. But first, expect retracement to test the new support level.

Nifty Index

Europe

Dow Jones Euro Stoxx 600 was boosted by news that the EU-US trade dispute is settled. A Trend Index trough above zero signals strong buying pressure. and another test of 400 is likely.

DJ Euro Stoxx 600 Index

A bullish saucer pattern on the Footsie suggest further gains. The Trend Index trough above zero indicates buying pressure. Breakout of the index above 7800 would signal another advance, with a target of 8200.

FTSE 100 Index

North America

The Nasdaq 100 retreated when Facebook (FB) and Twitter (TWTR) reported disappointing growth for the quarter. Bearish divergence on the Trend Index warns of selling pressure but this appears secondary and support at 7000 is likely to hold. Respect would confirm another advance.

Nasdaq 100

Friday’s retreat is also evident on the S&P 500 daily chart. Expect retracement to test new support at 2800. A strong GDP result should strengthen support.

S&P 500

Canada’s TSX 60 retraced to test the new support level at 970. Respect would signal a test of 1000 but breach is as likely, testing support at 940.

TSX 60 Index

Around the markets: Hong Kong & India bullish

Canada’s TSX 60 continues to test resistance at the former primary support level of 900. Bearish divergence on Twiggs Money Flow warns of strong selling pressure. Decline below 880 would confirm a primary down-trend, with an initial target of 865*.

TSX 60 Index

* Target calculation: 900 – ( 935 – 900 ) = 865

The Footsie recovered above 7400 but bearish divergence on Twiggs Money Flow warns of long-term selling pressure. Another test of primary support at 7100 remains likely.

FTSE 100 Index

European stocks are taking a beating, with the Dow Jones Euro Stoxx 50 Index testing support at 3400. Sharp decline on Twiggs Money Flow warns of selling pressure. Breach of 3400 would warn of a test of 3200.

DJ Euro Stoxx 50 Index

* Target calculation: 3650 – ( 3650 – 3450 ) = 3850

India’s Sensex remains in a bull market.

BSE Sensex

* Target calculation: 29000 + ( 29000 – 26000 ) = 32000

As does Hong Kong’s Hang Seng Index.

Hang Seng Index

* Target calculation: 24000 – ( 24000 – 21500 ) = 26500

While China’s Shanghai Composite index ranges between 3000 and 3300. Government interference remains a concern.

Shanghai Composite Index

Round the world: India & Hong Kong advance, Canada falters

Canada’s TSX 60 retraced to test resistance at the former primary support level of 900. Respect is likely and would signal a bear market. Decline of Twiggs Money Flow/Trend Index below zero would strengthen the bear signal. Medium-term target for the decline is 865*.

TSX 60 Index

* Target calculation: 900 – ( 935 – 900 ) = 865

The Footsie is losing momentum, with penetration of successive trendlines and declining Twiggs Trend Index. A test of primary support at 7100 is likely.

FTSE 100 Index

Dow Jones Euro Stoxx 50 Index, representing the 50 largest stocks in the Euro Zone, found support above 3400. Penetration of the declining trendline would indicate the correction is over and suggest the start of another advance — confirmed if the index breaks its recent (May 2017) high.

DJ Euro Stoxx 50 Index

* Target calculation: 3650 – ( 3650 – 3450 ) = 3850

It’s full steam ahead for India’s Sensex. Trend Index troughs above zero indicate strong buying pressure. Expect some profit-taking at the target of 32000* but any correction is likely to be shallow as the bull market gathers momentum.

BSE Sensex

* Target calculation: 29000 + ( 29000 – 26000 ) = 32000

Hong Kong’s Hang Seng Index has also reached its target of 26500. Again Trend Index troughs above zero indicate solid buying pressure.

Hang Seng Index

* Target calculation: 24000 – ( 24000 – 21500 ) = 26500

China’s Shanghai Composite index is also rallying but I remain wary of government intervention.

Shanghai Composite Index

Footsie falters

Sterling continues to test primary support at 1.13 against the Euro. Twiggs Trend Index peaking below zero warns of selling pressure. Breach of support is likely and would signal a test of the 2016 low at €1.10.

GBPEUR

The FTSE 100 breached medium-term support at 7400 and the long-term rising trendline, warning that momentum is slowing. Bearish divergence on Twiggs Trend Index warns of rising selling pressure. Test of primary support at 7100 is likely.

FTSE 100

* Target: 7400 + ( 7400 – 7100 ) = 7700