S&P 500: Stocks lift but jobs and profits a red flag

The S&P 500 has advanced steadily since breaking resistance at 3000.

S&P 500

Lifted by Fed liquidity injections in the repo market.

S&P 500 and Fed Assets

Optimism over improved global trade has spread, with the DJ Euro Stoxx 600 breaking resistance at 400.

DJ Euro Stoxx 600

South Korea’s KOSPI completed a double-bottom reversal to signal an up-trend.

KOSPI

And India’s Nifty Index broke resistance at 12,000.

Nifty

Commodity prices remain low but rising Trend Index troughs on the DJ-UBS Commodity Index suggest that a bottom is forming.

DJ-UBS Commodity Index

Crude spiked up with rising US-Iran tensions but is expected to re-test support at 50 as supply threats fade.

Nymex Light Crude

Fedex recovered above primary support at 150, but the outlook for economic activity remains bearish.

Fedex

Falling US wages growth warns of slowing job creation.

Average Hourly Wages

Declining employment growth highlights similar weakness.

Employment Growth

Initial jobless claims, while not alarming, are now starting to rise.

Initial Claims

Growth in weekly hours worked has slowed, with real GDP expected to follow.

Real GDP and Weekly Hours Worked

While GDP growth is slowing, corporate profits (before tax) are also declining as a percentage of GDP.

Corporate profits Before Tax/GDP

Market Capitalization of equities has spiked to a ratio of 20 times Corporate Profits (before tax), an extreme only previously seen in the Dotcom bubble.

Market Cap/Corporate Profits before Tax

The market can remain irrational for longer than you or I can stay solvent, but this is a clear warning to investors to stay on the defensive.

We maintain our view that stocks are over-valued and will remain under-weight equities (over-weight cash) until normal earnings multiples are restored.

S&P 500: A cautious advance

A monthly chart shows the S&P 500 cautiously advancing after breaking resistance at 3000. Short candle bodies reflect hesitancy but Trend Index troughs above zero remain bullish.

S&P 500

ETF flows reveal risk-averse investors, with outflows from US Equities in the last week and a relatively much larger outflow from Leveraged ETFs. Inflows are mainly into Fixed Income and Inverse.

ETF Flows

Year-to-date flows tell a similar story, with outflows from Equities and into Fixed Income. So where is the money flow into equities coming from?

Twitter: Buybacks

Meanwhile, the Fed has eased up on their balance sheet expansion now that the PBOC is back in the market. But broad money (MZM plus time deposits) continues to spike upwards, warning that the Fed is trying to head off a potential liquidity squeeze. They are not always successful. A similar spike occurred before the last two recessions.

Fed Assets and Broad Money Growth

The personal savings rate is climbing. Far from a positive sign, this warns that personal consumption, the largest contributor to GDP, is likely to fall.

Saving Rate

This is a dangerous market and we urge investors to be cautious.

S&P 500 bearish as Fed forced to expand

Juliet Declercq at JDI Research maintains that the normal business cycle has been replaced by a liquidity cycle, where market conditions are dictated by the ebb and flow of money from central banks. Risk will remain elevated for as long as natural price discovery is suppressed and risk-reward decisions are made in an artificial environment controlled by central bankers.

The Fed is again expanding its balance sheet (commonly known as QE) in response to the recent interest rate spike in repo markets.

Fed Assets and Excess Reserves on Deposit

Jeff Snider from Alhambra Partners maintains that the Dollar shortage has been signaled for some time. First by an inverted yield curve in Eurodollar futures, well ahead of in US Treasuries. Then in March 2019, the effective Fed Funds Rate (EFFR) stepped above the interest rate paid by the Fed on excess reserves (deposited by commercial banks at the Fed). According to Jeff, this showed that primary dealers were willing to pay a premium for liquidity. The likely explanation is that they anticipated a severe contraction in inter-bank markets, similar to 2008.

Effective Fed Funds Rate - Interest on Excess Reserves

When the spread spiked upwards in late September, the Fed finally woke up and started pumping money into the system, expanding their balance sheet by over $200 billion in the past few weeks.

Fed balance sheet expansion is normally welcomed by financial markets but broad money (MZM plus time deposits) is surging. Far from a reassuring sign, a similar surge occurred ahead of the last two recessions.

Broad Money

Bearish divergence between the S&P 500 and Trend Index on the daily chart warns of secondary selling pressure. An engulfing candle closed below 3000, strengthening the bear signal. Expect a test of secondary support at 2840.

S&P 500

Volatility (21-day) remains elevated. Volatility spikes at close to, or above, 2% normally accompany market down-turns signaled by arrows on the index chart. Note how rising troughs precede most down-turns and culminate in a trough above 1%. We are not there yet but Volatility above 1% is an amber-level warning.

S&P 500 Volatility

CEO Confidence is falling and normally precedes a fall in the S&P 500 index. What is more concerning is that confidence is at the same lows (right-hand scale) seen in 2001 and 2009.

CEO Confidence

Exercise caution. Probability of a down-turn is high and we maintain a reduced 34% exposure to international equities.

Gold’s hidden correction

There is a lot going on in global financial markets, with a Dollar/Eurodollar shortage forcing the Fed to intervene in the repo market. The Fed will not, on pain of death, call this QE. But it is. The only difference is that the Fed is purchasing short-term Treasury bills rather than long-term notes and mortgage-backed securities (MBS). The effect on the Fed’s balance sheet (and on Dollar reserves held by primary dealers) is the same.

Fed Assets

The effect on the Dollar has been dramatic, with a sharp dip in the Dollar Index. Interesting that this was forewarned by a bearish divergence on the Trend Index since June this year. Financial markets knew this was coming; they just didn’t shout it from the rooftops.

Dollar Index

Gold and precious metals normally surge in price when the Dollar weakens, to be expected as they are priced in USD, but Gold was already weakening, testing support at $1500/ounce.

Spot Gold in USD compared to Real 10-Year Treasury Yields

Silver was similarly testing support at $17.50/ounce.

Spot Silver

The falling Dollar has supported Gold and Silver despite downward pressure from other sources. In effect we have a “hidden” correction, with falling precious metal values obscured by falling unit values. Just as surely as if we had reduced the number of grams in an ounce….

Support for the Dollar would likely result in Gold and Silver breaking support, signaling a correction.

Australia’s All Ordinaries Gold Index, where the effect of the weakening greenback is secondary, has already broken support at 7200 after a similar bearish triangle (to Gold and Silver). Breach warns of another decline. Expect support at 6000.

All Ordinaries Gold Index

Patience is required. Gold is in a long-term up-trend, with a target of the 2012 high at $1800/ounce. A correction would offer an attractive entry point.

S&P 500: Rate cuts and employment

Ten-year Treasury yields rallied for the last two weeks but remain in a down-trend. Respect of resistance at 2.60% would warn of another decline.

10-year Treasury yields

Inflation is subdued and it would be difficult for the Fed to motivate a rate cut when inflation is close to its 2.0% target. The consumer price index (CPI) came in at 1.86% for the 12 months to March 2019, while the more stable Core CPI (ex- Food & Energy) remains close to target at 2.04%.

CPI and Core CPI

After price stability, the second part of the Fed’s dual mandate is to maintain maximum sustainable employment. A review of the last three cycles shows the Fed raising the funds rate (FFR) to curb inflation and then being forced to cut (red highlights) when growth in employment slows.

Payroll Changes and Fed Funds Rate

Total non-farm payrolls are currently growing at close to 2.0%. The Fed would normally need payroll growth to slow by at least 1.0% to motivate a rate cut. The exception is if inflation falls below target, then the Fed may act sooner.

The S&P 500 is headed for another test of its high at 2950, while Trend Index (13-week) recovered to signal moderate buying pressure.

S&P 500

The Nasdaq 100 is similarly testing its earlier high at 7700.

Nasdaq 100

Momentum is slowing and we can expect stubborn resistance at the former highs.

Bullish in a bull market, bearish in a bear market

We are witnessing the transition from a bull to a bear market.

I subscribe to Jesse Livermore’s maxim (emphasis added):

“I began to see more clearly—perhaps I should say more maturely—that since the entire list moves in accordance with the main current…. Obviously the thing to do was to be bullish in a bull market and bearish in a bear market. Sounds silly, doesn’t it? But I had to grasp that general principle firmly before I saw that to put it into practice really meant to anticipate probabilities. It took me a long time to learn to trade on those lines.”

The second part of that quote is equally important. You determine whether a market is bullish or bearish by “anticipating probabilities”. Don’t take signals from the charts in isolation. You have to study general conditions.

Livermore gives a classic example in Reminiscences of a Stock Operator of how he anticipated a bear market in 1906 after the Boer War in South Africa had drained Britain’s coffers and the San Francisco earthquake led to massive insurance payouts, forcing insurers to liquidate large swathes of their investment portfolios. But he was wiped out as the market repeatedly rallied. He persisted and eventually was proved right when large rail stocks announced new stock issues. The fact that the issues were structured as instalment issues, with only a down-payment needed to acquire the stock, alerted Livermore that there was not enough liquidity in the market to absorb the stock issues. His broker extended him a line of credit and…

“I profited by my earlier and costly mistakes and sold more intelligently. My reputation and my credit were reestablished in a jiffy. That is the beauty of being right in a broker’s office, whether by accident or not. But this time I was cold-bloodedly right, not because of a hunch or from skillful reading of the tape, but as the result of my analysis of conditions affecting the stock market in general. I wasn’t guessing. I was anticipating the inevitable. It did not call for any courage to sell stocks. I simply could not see anything but lower prices, and I had to act on it….”

General conditions in the US are still strong.

Credit and the broad money supply (MZM plus time deposits) are growing at close to 5%.

S&P 500

Credit risk premiums are rising but are nowhere near alarming. A spread of more than 3.0% between lowest grade investments (Baa) and 10-year Treasuries would flag a warning.

S&P 500

The big shrink, as the Fed unwinds its balance sheet, is still a myth. Banks are drawing down excess reserves at a faster rate, so that liquidity is rising. The rising green line on the chart below shows Fed assets net of excess reserves.

S&P 500

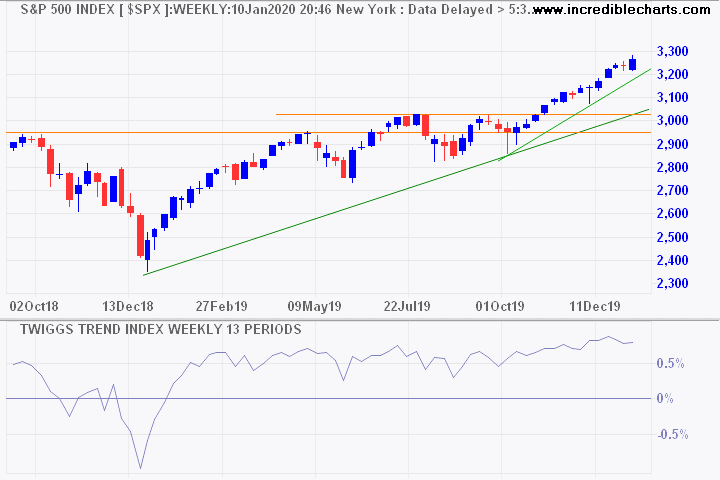
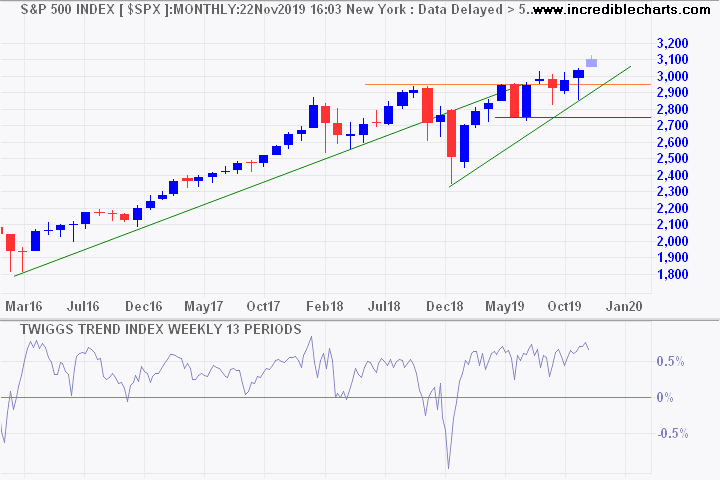
But charts are bearish.

Market volatility is high and a large bearish divergence on S&P 500 Momentum warns of a bear market.

S&P 500

We need to look at global conditions to identify the cause for market concern: Brexit, slowing European growth, but primarily, a potential trade war with China.

It’s time to be cautiously bearish.

There is no training, classroom or otherwise, that can prepare for trading the last third of a move, whether it’s the end of a bull market or the end of a bear market.

~ Paul Tudor Jones