Still cautious

Inflationary pressures are easing, with average hourly earnings growth declining to 3.35% in June, for Production and Non-Supervisory Employees, and 3.14% for Total Private sector.

Average Wage Rates

But this warns that economic growth is slowing. Annual growth in hours worked has slowed to 1.25%, suggesting a similar decline in GDP growth for the second quarter.

Real GDP and Hours Worked

Jobs growth held steady at 1.5% for the 12 months ended June 2019, after a decline from 2.0% in January.

Payroll Growth

Further decline in jobs growth is likely in the months ahead and a fall below 1.0% would warn that recession is imminent.

The Case Shiller index warns that growth in housing prices is slowing.

Case Shiller Index

Growth in construction expenditure (adjusted for inflation) has stalled.

Construction Expenditure/CPI

Retail sales growth is faltering.

Retail Sales

Units of light vehicle sales has stalled.

Light Vehicle Sales

And capital goods orders (adjusted for inflation) are faltering.

Manufacturers Orders for Capital Goods

One of the few bright spots is corporate bond spreads — the difference between lowest investment grade (Baa) and equivalent Treasury yields — still low at 2.3%, indicating that credit risk is benign.

Corporate Bond spreads

The S&P 500 broke through 2950 and is testing 3000. The 3000 level is an important watershed, double the 2000 and 2007 highs at 1500 (1552 and 1576 to be exact), and I expect strong resistance.

S&P 500

A rising Trend Index indicates buying pressure but this seems to be mainly stock repurchases and institutional buying. Retail money, as indicated by investment flows into ETFs, favors fixed income over equities despite the low yields.

ETF Flows source: ETF.com

It’s still a good time to be cautious.

The prevailing wisdom is that markets are always right. I take the opposite position. I assume that markets are always wrong……I watch out for telltale signs that a trend may be exhausted. Then I disengage from the herd and look for a different investment thesis. Or, if I think the trend has been carried to excess, I may probe going against it. Most of the time we are punished if we go against the trend. Only at an inflection point are we rewarded.

~ George Soros

S&P 500: Short-term versus long run

The market is excited at the prospect of Fed rate cuts (in response to the US-CCP trade war), with the S&P 500 headed for another test of its earlier high at 2950. A Trend Index trough above zero indicates short-term buying pressure.

S&P 500

Falling bond yields, however, warn of a flight to safety. 10-Year Treasury yields have fallen close to 120 basis points (bps) since late 2018, as investors shift from equities to bonds. Prices are being supported by stock buybacks rather than investor inflows.

10-year Treasury Yields

The Yield Differential between 10-year (purple) and 3-month (lime) Treasury yields is now negative, a reliable early warning of recession.

Yield Differential: 10-Year and 3-Month Treasuries

Corporate bond spreads, the difference between lowest investment grade (Baa) and Treasury yields, are rising. An indicator of credit risk, a spread above 2.5% (amber) is an early warning of trouble ahead, while 3.0% (red) signals that risk is elevated.

10-Year Baa minus Treasury Yield

Falling employment growth is another important warning. Annual employment growth below 1.0% (amber) would normally cause the Fed to cut interest rates. In the current scenario, that is almost certain.

Employment Growth & FFR

What is holding the Fed back is average hourly wages. Annual growth above 3.0% is indicative of a tight labor market and warns against cutting rates too hastily.

Average Hourly wage Rate

Stats for Q1 2019 warn that compensation is rising as a percentage of net value added, while profits are falling. As can be seen from the previous two recessions (gray bars), rising compensation (as % of NVA) normally leads to falling profits and a recession. Cutting interest rates would accelerate this.

Profits & Compensation % of Value Added

Annual GDP growth came in at 3.2% (after inflation) for the first quarter, but growth in hours worked is slowing. GDP growth is likely to follow.

Real GDP & Hours Worked

Personal consumption expenditure for Q1 was largely positive, with an uptick in services and non-durable goods. But consumption of durable goods fell sharply, warning that consumer confidence in the medium-to-long-term is declining.

Consumption

On the global stage, commodity prices are falling, indicating an anticipated drop in demand, especially from China.

DJ-UBS Commodity Index

Nymex crude is following, and expected to test support between $40 and $45 per barrel.

Crude Oil

Short-term prospects may appear reasonable, but the long-term outlook is decidedly negative.

In the short run, the market is a voting machine but in the long run, it is a weighing machine.

~ Benjamin Graham

Life left in US stocks

According to market pundits, the latest stock sell-off was fueled by concerns over rising bond yields and slowing growth for Caterpillar (CAT).

From CNBC:

….Caterpillar shares reversed lower during the call, when Chief Financial Officer Brad Halverson said first-quarter adjusted profits per share will be the highest for the year because of increased investment later in 2018.

“We expect the targeted investments for future growth to be higher over the remaining three quarters,” Halverson said. “The outlook assumes that first-quarter adjusted profit per share will be the high-water mark for the year.”

Caterpillar (CAT)

The stock fell 6.2% on Wednesday, ignoring the earnings report:

In the earnings report, the Illinois-based machinery manufacturer raised its 2018 profit outlook by $2 a share over the previous quarter, to a range of $10.25 to $11.25 per share. The rosier guidance exceeds a Reuters analyst survey that expected a range of $8.39 to $10.60 a share. The company cited better-than-expected sales volume as the main driver of its improved full-year guidance.

Since when has “better-than-expected sales volume,” upward earnings revision and increased new investment been a bear signal? The market is unusually jittery at present, focusing on any semblance of bad news and ignoring the good.

Even concern over rising bond yields is nothing new.

10-Year Treasury Yields

10-Year Treasury yields are testing resistance at 3.0%. Breakout would complete a double-bottom reversal, warning of a bear market in bonds as yields rise. But rising long-term rates are not bad news for stocks, especially when off a low base as at present. I would go so far as to say that, over the last 20 years, rising 10-year yields have been bullish for stocks. The chart below compares annual percentage change in 10-year Treasury yields and the Russell 3000 Total Market index.

10-Year Treasury Yields and Russell 3000 Index 12-Month Rate of Change

There is plenty more good news that the market seems to be ignoring.

First quarter 2018 corporate earnings have so far impressed. According to S&P Indices, 117 stocks in the S&P 500 had reported results by the morning of April 24th. Of those, 91 (77.8%) beat, 10 (8.5%) met and 16 (13.7%) missed their estimates. Misses are largely concentrated in Materials ( 3 of 5), Industrials (4 of 26) and Consumer Discretionary sectors (5 of 13).

Freight activity remains strong, signaling a reviving economy.

S&P 500

Wages growth remains tame, with average hourly earnings of production and non-supervisory employees increasing at an annual rate of 2.42%. Growth above 3.0% would warn that underlying inflation is rising and the Fed will be forced to tighten monetary policy. But that does not appear imminent.

S&P 500

Muted wages growth allowed corporate profits (the blue line below) to rebound after a threatened down-turn.

S&P 500

Consumption has recovered. Per capita consumption of non-durable goods is recovering after a flat spot in 2017, consumption of durable goods has been rising since 2016, while services remain strong.

S&P 500

In financial markets, risk premiums on corporate bonds (Baa minus Treasuries) have declined to below 2.0%, suggesting a healthy credit outlook.

S&P 500

Bank credit is recovering after faltering in 2017.

S&P 500

The yield curve is flattening as the Fed gradually raises interest rates. A flat yield curve is not a threat. Only if it inverts, when the yield differential (gray line on the chart below) falls below zero, is the economy at risk of falling into a recession. Growth in the money stock (green MZM line on the chart below) has slowed but remains healthy.

S&P 500

The Fed has committed to shrinking its $4 trillion investment in Treasuries and mortgage-backed securities (MBS) run up by quantitative easing (QE) between 2009 and 2014. So far the decline has had no impact on financial markets as bank excess reserves on deposit at the Fed are declining at a similar rate. The effect is that net assets (Fed Assets minus Excess Reserves) are holding steady at $2.4 trillion.

S&P 500

The Philadelphia Fed’s Leading Index remains healthy at above 1.0 percent.

S&P 500

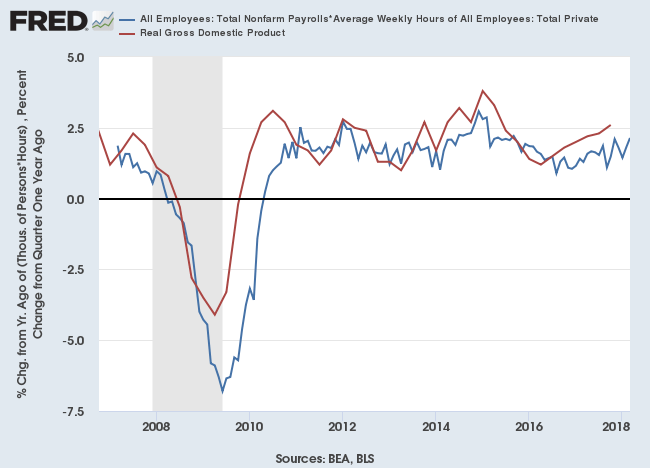
And our estimate of real GDP is rising (2.14% in March 2018), suggesting that the economy is recovering from its flat spot in 2016/2017.

S&P 500

Valuations are high and investors are jittery but the bull market still appears to have further to run.

Outlook for 2018

At this time of year we are usually inundated with projections for the year ahead, from predictions of imminent collapse to expectations of a record year.

We live in a world of uncertainty, where both extremes are possible, but neither is likely.

We are clearly in stage 3 (the final stage) of a bull market. Risk premiums are close to record lows. The yield spread between lowest investment-grade (Baa) bonds and equivalent risk-free Treasuries has crossed to below 2.0 percent, levels last seen prior to the 2008 global financial crisis. The VIX is also close to its record low, suggesting high levels of investor confidence.

Corporate Bond Spreads and VIX

Money supply continues to grow at close to 5.0 percent, reflecting an accommodative stance from the Fed. MZM, or Zero Maturity Money, is basically M1 plus travelers checks and money market funds.

Zero-Maturity Money

Inflationary forces remain subdued, with average hourly wage rates growing at below 2.5 percent per year. A rise above 3.0 percent, which would pressure the Fed to adopt a more restrictive monetary policy, does not appear imminent.

Average Hourly Wage Rates

Tax relief and higher commodity prices are likely to exert upward pressure on inflation in the year ahead. But the Fed’s stated intention of shrinking its balance sheet, with a reduction of $100 billion in the first 12 months, is likely to have an opposite, contractionary effect.

The Leading Index from the Philadelphia Fed gave a bit of a scare, dipping below 1.0 percent towards the end of last year. But data has since been revised and the index now reflects a far healthier outlook.

Philadelphia Fed Leading Index

A flattening yield curve has also been mooted as a potential threat, with a negative yield curve preceding every recession over the last 50 years.

Yield Differential 10-Year compared to 2-Year and 3-Month Treasuries

A yield differential, between 10-year and either 2-year or 3-month Treasuries, below zero would warn of a recession. When long-term yields fall below short-term yields financial markets stop working efficiently and bank lending tends to contract. Banks, who generally borrow at short-term rates and lend at long-term rates, find their margins are squeezed and become strongly risk-averse. Contracting lending slows the economy and normally leads to recession.

But we are some way from there. If we take the last cycle as an example, the yield curve started flattening in 2005 (when yield differentials fell below 1 percent) but a recession only occurred in 2008. The market could continue to thrive for several years before the impact of a negative yield curve is felt. To exit now would seem premature.

Leading Index gives early warning

One of the better composite indicators in the US, the Leading Index from the Philadelphia Fed, points to a slow-down in the US economy. A dip below 1.0% is often early, as in July 2000 and May 2006, but serves as a reliable warning of an economic slow-down.

Leading Index for the United States

The Leading Index predicts the six-month growth rate of the Philadelphia Fed Coincident Index. In addition to the Coincident Index, it includes variables that lead the economy: housing permits (1 to 4 units), initial unemployment insurance claims, delivery times from the ISM manufacturing survey, and the interest rate spread between the 10-year Treasury bond and the 3-month Treasury bill.

The Coincident Index combines four indicators: nonfarm payroll employment, the unemployment rate, average hours worked in manufacturing and wages and salaries.

Coincident Index for the United States

The Leading Index signal does seem early. Low corporate bond spreads and VIX near record lows continue to indicate low market risk, typical of a bull market.

Corporate Bond Spreads and VIX

Monetary policy remains accomodative, with money stock growing at close to 5% p.a. (MZM = cash in circulation, travelers checks, money market funds and deposits with zero maturity).

MZM and Yield Differential

The yield curve has flattened, with the spread between 10-year and 3-month Treasuries falling to 1.0% on the above graph. That is what one would expect when the Fed hikes interest rates in a low inflation environment: short-term rates will rise faster than long-term rates. But a negative yield curve, where short-term rates are higher than long-term rates, is a reliable predictor of recessions in the US economy. Each time the yield differential on the above graph crossed below zero in the last 50 years, a recession has followed within 12 months.

Underlying inflation remains low, with average hourly earnings growth below 2.5% p.a., and the Fed should be careful about single-mindedly raising interest rates without considering the yield curve.

Annual Growth in Average Hourly Earnings

The bull market continues but investors need to keep a weather eye on interest rates and the yield curve.

How long will the bull market last?

US markets are clearly in a bull phase, with the Dow, S&P 500 and Nasdaq making strong gains. A rising Freight Transport Index highlights the broad up-turn in economic activity.

Freight Transport Index

Low corporate bond spreads — lowest investment grade (Baa) minus 10-year Treasury yield — and VIX below 15 both reflect bull market conditions.

Bond Spreads

Real GDP is growing around a modest 2 percent a year. Low figures are likely to continue, with annual change in hours worked (total payroll * average weekly hours) falling to 1.2 percent in September.

Real GDP

Money supply (M1) growth recovered to a balmy 7 percent (p.a.) after a worrying dip below 5 in early 2016.

M1 Money Stock

The Fed may be reluctant to tighten monetary conditions but will be forced to act if inflation starts to accelerate. Annual growth in hourly wage rates turned above 2.5 percent in September, signaling underlying inflationary pressure.

Average Hourly Wage Rate - Annual Growth

Another dip in M1 below 5 percent growth would warn that monetary conditions are tightening. From there, it normally takes 12 months to impact on the broad market indices.

M1 Money Stock and Fed Funds Rate

At this stage it looks like another 2 years of sunshine before the storm. But one false tweet and we could face an early winter.

Australia: Housing, Incomes & Growth

A quick snapshot of the Australian economy from the latest RBA chart pack.

Disposable income growth has declined to almost zero and consumption is likely to follow. Else Savings will be depleted.

Disposable Income & Consumption

Residential building approvals are slowing, most noticeably in apartments, reflecting an oversupply.

Residential Building Approvals

Housing loan approvals for owner-occupiers are rising, fueled no doubt by State first home-buyer incentives. States do not want the party, especially the flow from stamp duties, to end. But loan approvals for investors are topping after an APRA crackdown on investor mortgages, especially interest-only loans.

Housing loan approvals

The ratio of household debt to disposable income is precarious, and growing worse with each passing year.

Household debt to disposable income

House price growth continues at close to 10% a year, fueled by rising debt. When we refer to the “housing bubble” it is really a debt bubble driving housing prices. If debt growth slows so will housing prices.

House price growth

Declining business investment, as a percentage of GDP, warns of slowing economic growth in the years ahead. It is difficult, if not impossible, to achieve productivity growth without continuous new investment and technology improvement.

Business investment

Yet declining corporate bond spreads show no sign of increased lending risk.

Corporate bond spreads

Declining disposable income and consumption growth mean that voters are unlikely to be happy come next election. With each party trying to ride the populist wave, responsible economic management has taken a back seat. Throw in a housing bubble and declining business investment and the glass looks more than half-empty.

Every great cause begins as a movement, becomes a business, and eventually degenerates into a racket.

~ Eric Hoffer

VIX hits record low

The CBOE Volatility Index (VIX) made a new low of 9.30 indicating record low levels of stock volatility. High levels of stock buybacks and large ETF fund inflows may both have contributed, but this is only the third time in its 27-year history that index has broken below 10%. The first was in late 1993. The second, in late 2006, was followed a year later by a massive market snap-back. This time is no different. Volatility is unlikely to remain at such low levels and eventually we will see a market down-turn, accompanied by high volatility, but there is no crystal ball that can tell us whether this will be in one year or five.

CBOE Volatility Index (VIX)

Corporate bond spreads are also falling, with the spread between lowest investment grade Baa (10-year) and equivalent Treasury yields at their lowest point since 2008.

Corporate Bond Spreads

Source: St Louis Fed & Moody’s

The yield curve is flattening but remains comfortably above a flat or negative yield curve when
the yield differential (10-year minus 3-month yields) falls below zero. A negative yield curve is a reliable warning of recession within 12 months.

Yield Differential

Source: St Louis Fed

The Freight Transportation Services Index displays a steady increase in economic activity.

Freight Transportation Services Index

Source: St Louis Fed & US Bureau of the Census

And the S&P 500 continues its advance towards 2500.

S&P 500

Target 2400 + ( 2400 – 2300 )

More evidence of a bull market, except in Australia

One of my favorite indicators of financial market stress is Corporate bond spreads. The premium charged on the lowest level of investment-grade corporate bonds, over the equivalent 10-year Treasury yield, is a great measure of the level of financial market stress.

Moodys 10-year BAA minus Treasury yields

Levels below 2 percent — not seen since 2004 – 2007 and 1994 – 1998 before that — are indicative of a raging bull market. The current level of 2.24 percent is slightly higher, reflecting some caution, but way below elevated levels around 3 percent.

The Financial Stress Index from St Louis Fed measures the degree of stress in financial markets. Constructed from 18 weekly data series: seven interest rate series, six yield spreads and five other indicators. The average value of the index is designed to be zero (representing normal market conditions); values below zero suggest low financial stress, while values above zero suggest high market stress.

St Louis Financial Stress Index

Current levels, below -1, also indicate unusually low levels of financial market stress.

Leading Index

The Leading Index from the Philadelphia Fed has declined slightly in recent years but remains healthy, at above 1 percent.

Philadelphia Fed Leading Index

Currency in Circulation

Most recessions are preceded by growth in currency in circulation falling below 5 percent, warning that the economy is contracting.

Currency in Circulation

Current levels, above 5 percent, reflect healthy financial markets.

Australia

On the other side of the Pacific, currency growth is shrinking, below 5 percent for the first time in 7 years. A sustained fall would warn that the economy is contracting.

Australia: Money Supply

Further rate cuts, to stimulate the economy, are unlikely. The ratio of Household Debt to Disposable Income is climbing and the RBA would be reluctant to add more fuel to the bonfire.

Australia: Household Debt

There is no immediate pressure on the RBA to raise interest rates, but when the time comes the impact on the housing market could be devastating.

Bond spreads bullish for US, less so Australia

Yield Curve

The yield curve is one of the best predictors of US economic recessions. Every time the yield curve has turned negative in the last fifty years, a recession has followed.

First of all, what is a yield curve? It is the plot of yields on bonds, normally Treasuries, against their maturities. Long maturity bonds are expected to have higher yields than short-term bills, to compensate for the increased risk (primarily of interest rate changes). If you tie your money up for longer, you would expect a higher return. Hence a rising yield curve.

A rising yield curve is a major source of profit to the banks as their funding is mostly short-term while they charge long-term rates to borrowers, pocketing a healthy interest margin.

When the Fed steps into the market, however, restricting the flow of money into the economy, then short-term rates rise faster than long-term rates and the yield curve can invert (referred to as a negative yield curve).

Bank interest margins are squeezed — it is no longer profitable to borrow short and lend long — and they restrict the flow of new credit.

Credit is the lifeblood of the economy and activity slows.

The chart below compares US recessions to the yield differential: the difference between 10-year Treasury yields and the yield on 3-month T-bills. The yield differential falls below zero when 3-month T-bills yield more than 10-year T-notes.

Yield Differential: 10-year Treasury yields minus 3-month T-bills

You can see that every time the yield differential dips below zero it is followed by a gray bar indicating a recession. There is one exception: the phantom recession of 1966 when the S&P 500 fell 22%. This was originally certified as a recession by the NBER but they later changed their mind and airbrushed it out of history.

You can also see that the yield differential is declining at present but, at 2.0%, it is a long way from a flat or negative yield curve. This supports my argument last week that current Fed rate hikes are more about normalizing interest rates than about monetary tightening.

That could change in the future but at present the bull market still appears to have plenty in the tank.

Corporate Bond Spreads

Corporate bond spreads — the yield difference between high-grade corporate bonds and the risk-free Treasury rate — are another useful indicator of the state of the economy.

Wide bond spreads indicate increased risk of corporate default. Investors are concerned about the state of the economy and demand a higher premium for taking credit risk.

Narrow spreads suggest that credit premiums are low and confidence in the economy is good.

If we examine the chart below, bond spreads are declining, indicating confidence in the US economy, with even the lowest investment grade BBB dipping below 150 basis points (or 1.50%). This is synonymous with a bull market.

US Bond Spreads

Australian corporate bond spreads are higher than the US, with BBB still at 200 bps. They have also declined over the last year but seem to be trending upward from their 2013 low. This is not conclusive as the current trough is not yet complete, but a higher low would warn that credit risk is rising.

Australian Bond Spreads

Only when the tide goes out do you discover who’s been swimming naked.

~ Warren Buffett