Dr Lacy Hunt: The impending recession

Not the best interviewer but you always get your money’s worth from Dr Lacy Hunt, former chief economist at the Dallas Fed.

The highlights:

  • Dr Hunt warns of a hard landing.
  • Recent GDP gains are led by consumer spending (+4%) but real disposable income declined (-1%). Personal saving depressed at 3.4%, compared to the GFC low of 2.4%.
  • UOM consumer sentiment is below level of previous recessions.
  • A sharp surge in the economy often occurs just before recession.
  • Dollar is too strong for global stability. It will fall as US goes into recession but then stabilize as the impact flows through to rest of the world.
  • Three signs of weakness:
    • Negative net national saving has never occurred before in a period where GDP is rising (economy is weaker than we think).
    • Bank credit is already contracting. This normally only occurs when the economy is already in recession.
    • Inflation is likewise falling before the recession.

Deflationistas and base effects

Deflationistas like respected economist David Rosenberg point to a sharp decline in bank credit over the past 12 months as evidence of deflation.

By the end of April, commercial bank loans and leases had declined by $510 billion, or 4.7% of total, over the past 12 months.

Commercial Banks: Loans & Leases

That would be cause for concern but it does not take into account the massive $742 billion surge in lending in the preceding two months, March-April 2020, when borrowers drew on lines of credit to ensure that they had sufficient liquidity during the pandemic. They were afraid that banks would withdraw credit facilities in anticipation of widespread corporate defaults.

Commercial Banks: Loans & Leases

Conclusion

There is no credit contraction.

Bank credit did shrink by $510 billion in the past 12 months but this followed an unusual $742 billion surge in credit as borrowers drew on credit facilities to ensure liquidity during the first two months of the pandemic. What we have witnessed is the normalization of bank credit, with borrowers repaying credit temporarily drawn at the height of the liquidity crunch.

We expect normal credit growth to resume.

Inverted yield curve is no cause for panic….yet

10-Year Treasury yields continue to fall. A Trend Index peak below zero signals strong selling pressure (purchases of bonds).  Target for the decline is primary support at 2.0%.

10-Year Treasury Yields

The spread between 10-Year and 3-Month Treasury yields is at zero, warning that the yield curve is about to invert. While there is no cause for panic, an inverted yield curve is a reliable predictor of recession within 12 to 18 months, preceding every recession since 1960*.

*1966 is an arguable exception. Initially classed as a recession by the NBER, it was later reversed and airbrushed out of history.

10-Year minus 2-Year Treasury Yields & Bank Credit

The 10-year/3-Month spread last crossed below zero in August 2006 and was followed by a recession in December 2007. While credit conditions tighten when the yield curve inverts, there is considerable lag and the chart below shows that credit growth remains high while the yield curve is inverted.

Yield Curve Inversions & Bank Credit

A far more imminent warning (of recession) is when the yield differential recovers above zero.

Why does a recovering yield curve warn of impending recession?

First, you need to understand what causes the yield curve to invert. Economic prospects weaken to the extent that bond investors are prepared to accept lower long-term yields than the current short-term yield, in anticipation that interest rates will fall. The inverted yield curve will continue for as long as rates are expected to fall but will rapidly recover when the Fed starts to cut rates.

Treasury Yields

Falling short-term yields flag that the Fed is cutting interest rates, confirming bond investors earlier suspicions of a weakening economy. That serves as a reliable warning, after an inverted yield curve, of impending recession.

We are not there yet. The Fed may have eased off on further rate rises but is still some way off from cutting rates.

Does the yield curve warn of a recession?

There has been talk in recent months about the narrowing yield curve and how this warns of a coming recession, normally accompanied by a graph of the 10-year/2-year Treasury spread which fell to 0.22% at the end of August 2018.

Yield Differential 10Year minus 2Year

I have always used the 10-year minus the 3-month Treasury spread to indicate the slope of the yield curve but, although this shows a higher spread of 0.71%, both warn that the yield curve is flattening.

Yield Differential 10Year minus 3Month

Is this cause for alarm?

First of all, what is the yield curve? It is the plot of yields on Treasuries against their maturities. Long maturity bonds normally have higher yields than short-term bills, to compensate for the increased risk (primarily of interest rate changes). If you tie your money up for longer, you expect a higher return. That is a rising yield curve.

A steep yield curve is a major source of profit to banks as their funding is mostly short-term while they charge long-term rates to borrowers, pocketing the interest spread.

The Fed sometimes intervenes in the market, however, restricting the flow of money to the economy, to curb inflation. Short-term rates then rise faster than long-term rates and the yield curve may invert — referred to as a negative yield curve.

At present we are witnessing a flattening yield curve, as short-term rates rise close to long-term rates.

A recent paper from Michael D. Bauer and Thomas M. Mertens at the San Francisco Fed concludes that a narrow yield differential has zero predictive ability of future recessions:

In light of the evidence on its predictive power for recessions, the recent evolution of the yield curve suggests that recession risk might be rising. Still, the flattening yield curve provides no sign of an impending recession. First, the evidence suggests that recession predictions based on the yield curve require an inversion (Bauer and Mertens 2018); no matter which term spread is used to measure its shape, the yield curve is not yet inverted. Second, the most reliable summary measure of the shape of the yield curve, the ten-year–three-month spread, is nearly 1 percentage point away from an inversion.

I was pleased to see that Bauer and Mehrtens find the 10-year/3-month Treasury spread more reliable than other spreads in predicting a recession within 12 months, with 89% predictive accuracy. They also refer to another study that came to a similar conclusion:

Engstrom and Sharpe found that their short-term spread statistically dominated the 10y–2y spread, and our findings are consistent with this result.

But both studies conclude that a negative yield curve (when the yield differential is below zero) is a reliable predictor of recessions. And Bauer and Mehrtens observe that, while the 10 year/2 year spread is less accurate, it is still a reliable predictor.

Are we just 22 basis points away from a recession warning? Let’s weigh up the evidence.

First, a negative yield curve is a reliable predictor of recessions. In the last 60 years, every time the 10-year/3-month spread has crossed below zero, a recession has followed within 12 months. There is one arguable exception. In 1966 the yield differential crossed below zero, the S&P 500 fell 22% and the NBER declared a recession, but they (the NBER) later changed their mind and airbrushed it out of history.

Yield Differential 10Year minus 3Month

Second, while there is strong correlation between the yield curve and recessions, the exact relationship is unclear.

The most convincing explanation is that bank interest margins are squeezed when the yield curve inverts. When it is no longer profitable for banks to borrow short and lend long, they restrict the flow of new credit. Credit is the lifeblood of the economy and activity slows.

That was clearly the case in the lead up to the 2008 crash, but why are net interest margins of major US banks now widening?

Bank Net Interest Margins

The flow of credit also slowed markedly before the 1990/1991 recession but did not ahead of the last two recessions.

Bank Net Interest Margins

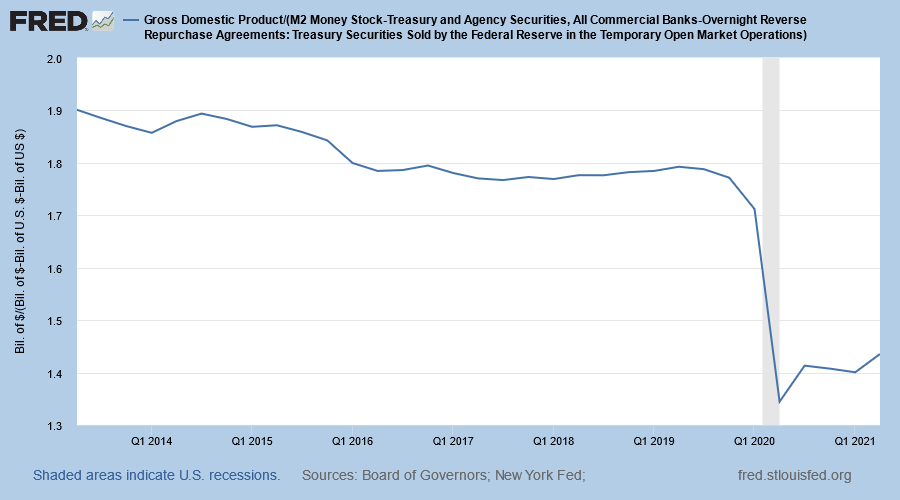
And growth in the broad money supply — zero maturity money (MZM) plus time deposits — accelerated ahead of the Dotcom crash and 2008 banking crisis.

Broad Money Supply: MZM plus Time Deposits

Third, consider the Wicksell spread. Swedish economist Knut Wicksell argued in his 1898 work Interest and Prices that the economy expands when return on capital is higher than the cost of capital, with new investment funded by credit, and it contracts when the expected return on capital is below the cost of capital.

I was first introduced to Wicksell by Niels Jensen, who uses the Baa corporate bond yield as a proxy for the cost of capital and nominal GDP growth for the return on capital. Neils argues that the economy is near equilibrium when the Wicksell spread is about 2.0% — when return on capital is 2.0% higher than the cost of capital.

Wicksell Spread: Nominal GDP Growth compared to Baa Corporate Bond Yield

The above graph shows that 1960 to 1980 was clearly expansionary, with nominal GDP growth exceeding the cost of capital (Baa corporate bond yield). But the last almost four decades were the opposite, with the cost of capital mostly higher than the return on capital. Only recently has this reversed, suggesting a new expansionary phase.

One could argue that low-grade investment bond yields are a poor proxy for the cost of capital, with rising access to equity markets in recent decades. Also that nominal GDP growth rate is a poor proxy for return on capital. If we take the S&P 500, the traditional method of calculating cost of equity is the current dividend yield (1.8%) plus the dividend growth rate (8.0%), giving a 9.8% cost of capital. If we take the current S&P 500 earnings yield of 4.0% (the inverse of the P/E ratio) plus the earnings growth rate of 15.1% as the return on capital (19.1%), it far exceeds the cost of capital. You can understand why growth is soaring.

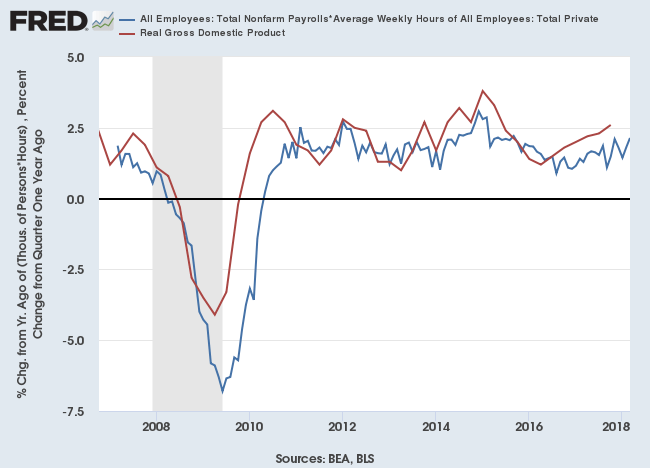
New capital formation is starting to recover.

New Capital Formation

Fourth, Fed actions over the last decade have distorted the yield curve. More than $3.5 trillion of Treasuries and mortgage-backed securities (MBS) were purchased as part of the Fed’s quantitative easing (QE) strategy, to drive down long-term interest rates. In 2011 to 2012, the Fed also implemented Operation Twist — buying longer-term Treasuries while simultaneously selling shorter-dated issues it already held — to further bring down long-term interest rates. Long-term rates are still affected by this.

In addition, Fed efforts to shrink their balance sheet may further distort the yield curve. The Fed has indicated that it will not sell Treasuries that it holds but will not reinvest the full amount received from investments that mature. If we consider that short-term Treasuries are far more likely to mature, the result could be that the maturity profile of the Fed’s Treasury portfolio is getting longer — a further extension of Operation Twist by stealth.

Conclusion

A flat yield curve does not warn of a coming recession. A negative yield curve does. Both the 10-year/2-year and 10-year/3-month Treasury spreads are reliable predictors of a recession within 12 months, but the 10-year/3-month spread is more accurate.

The correlation between the yield curve and recessions is strong but the actual relationship between the two is more obscure. Links between the yield curve, bank net interest margins, bank credit growth and broad money supply growth are more tenuous, with lower correlation.

Also, return on capital is rising while cost of capital remains low, fueling strong capital formation. The economy is starting to grow.

Fed actions, through QE, Operation Twist, and even possibly steps to unwind its balance sheet, have suppressed long-term interest rates and distorted the yield curve. While the yield curve is still an important indicator, we should be careful of taking its signals at face value without corroborating evidence.

Lastly, we also need to consider the psychological impact. If the market believes that a negative yield curve is followed by a recession, it most likely will be. Beliefs lead to actions, and actions influence outcomes.

Treat yield curve signals with a great deal of respect, and be very wary of how the market reacts, but don’t mindlessly follow its signals without corroboration. The economy may well be entering a new growth spurt, with all its inherent dangers — and rewards.

I contend that financial markets never reflect the underlying reality accurately; they always distort it in some way or another and the distortions find expression in market prices. Those distortions can, occasionally, find ways to affect the fundamentals that market prices are supposed to reflect.

~ George Soros

Life left in US stocks

According to market pundits, the latest stock sell-off was fueled by concerns over rising bond yields and slowing growth for Caterpillar (CAT).

From CNBC:

….Caterpillar shares reversed lower during the call, when Chief Financial Officer Brad Halverson said first-quarter adjusted profits per share will be the highest for the year because of increased investment later in 2018.

“We expect the targeted investments for future growth to be higher over the remaining three quarters,” Halverson said. “The outlook assumes that first-quarter adjusted profit per share will be the high-water mark for the year.”

Caterpillar (CAT)

The stock fell 6.2% on Wednesday, ignoring the earnings report:

In the earnings report, the Illinois-based machinery manufacturer raised its 2018 profit outlook by $2 a share over the previous quarter, to a range of $10.25 to $11.25 per share. The rosier guidance exceeds a Reuters analyst survey that expected a range of $8.39 to $10.60 a share. The company cited better-than-expected sales volume as the main driver of its improved full-year guidance.

Since when has “better-than-expected sales volume,” upward earnings revision and increased new investment been a bear signal? The market is unusually jittery at present, focusing on any semblance of bad news and ignoring the good.

Even concern over rising bond yields is nothing new.

10-Year Treasury Yields

10-Year Treasury yields are testing resistance at 3.0%. Breakout would complete a double-bottom reversal, warning of a bear market in bonds as yields rise. But rising long-term rates are not bad news for stocks, especially when off a low base as at present. I would go so far as to say that, over the last 20 years, rising 10-year yields have been bullish for stocks. The chart below compares annual percentage change in 10-year Treasury yields and the Russell 3000 Total Market index.

10-Year Treasury Yields and Russell 3000 Index 12-Month Rate of Change

There is plenty more good news that the market seems to be ignoring.

First quarter 2018 corporate earnings have so far impressed. According to S&P Indices, 117 stocks in the S&P 500 had reported results by the morning of April 24th. Of those, 91 (77.8%) beat, 10 (8.5%) met and 16 (13.7%) missed their estimates. Misses are largely concentrated in Materials ( 3 of 5), Industrials (4 of 26) and Consumer Discretionary sectors (5 of 13).

Freight activity remains strong, signaling a reviving economy.

S&P 500

Wages growth remains tame, with average hourly earnings of production and non-supervisory employees increasing at an annual rate of 2.42%. Growth above 3.0% would warn that underlying inflation is rising and the Fed will be forced to tighten monetary policy. But that does not appear imminent.

S&P 500

Muted wages growth allowed corporate profits (the blue line below) to rebound after a threatened down-turn.

S&P 500

Consumption has recovered. Per capita consumption of non-durable goods is recovering after a flat spot in 2017, consumption of durable goods has been rising since 2016, while services remain strong.

S&P 500

In financial markets, risk premiums on corporate bonds (Baa minus Treasuries) have declined to below 2.0%, suggesting a healthy credit outlook.

S&P 500

Bank credit is recovering after faltering in 2017.

S&P 500

The yield curve is flattening as the Fed gradually raises interest rates. A flat yield curve is not a threat. Only if it inverts, when the yield differential (gray line on the chart below) falls below zero, is the economy at risk of falling into a recession. Growth in the money stock (green MZM line on the chart below) has slowed but remains healthy.

S&P 500

The Fed has committed to shrinking its $4 trillion investment in Treasuries and mortgage-backed securities (MBS) run up by quantitative easing (QE) between 2009 and 2014. So far the decline has had no impact on financial markets as bank excess reserves on deposit at the Fed are declining at a similar rate. The effect is that net assets (Fed Assets minus Excess Reserves) are holding steady at $2.4 trillion.

S&P 500

The Philadelphia Fed’s Leading Index remains healthy at above 1.0 percent.

S&P 500

And our estimate of real GDP is rising (2.14% in March 2018), suggesting that the economy is recovering from its flat spot in 2016/2017.

S&P 500

Valuations are high and investors are jittery but the bull market still appears to have further to run.