Low inflation risk keeps yield curve safe

The Fed is advancing interest rates at a measured pace, with the objective of restoring balance in financial markets rather than to curbing inflationary pressures. Only if inflation spikes is the Fed likely to adopt a restrictive stance.

Elliot Clarke from Westpac sums up the FOMC (Fed Open Market Committee) view from their latest minutes:

Beginning with inflation, whereas the market has recently been concerned that inflation may be getting away from the FOMC (given annual CPI inflation at 2.5%yr and persistent strength in the oil price), the Committee is unperturbed.

Instead of the CPI, the FOMC’s benchmark remains PCE inflation, which is currently 2.0%yr on a headline basis and 1.9%yr for core…..

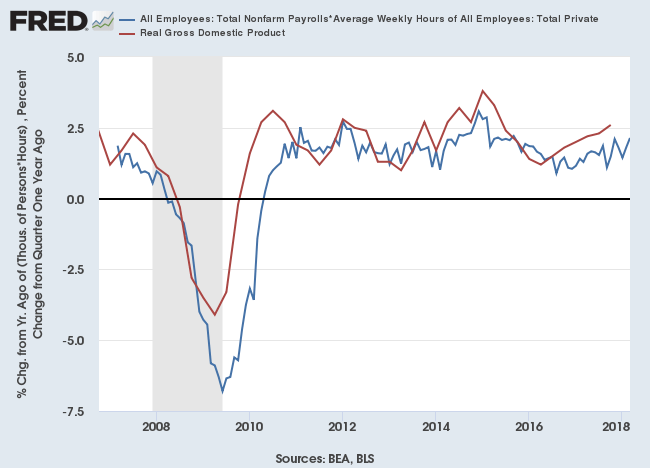
To see upside inflation risks build, a stronger wage inflation pulse is necessary. At present the employment cost index is only reporting “a gradual pickup in wage increases”, and the signal from other wage measures is “less clear”. Two other important considerations for the pass through of wages to activity and thus inflation is that real hourly earnings growth is currently flat and the savings rate near historic lows. The capacity of households to boost consumption and thus inflation is therefore very limited.

Hourly wage rates are growing at a gradual pace.

Hourly Wage Rate Growth

Personal savings are low.

Personal Savings

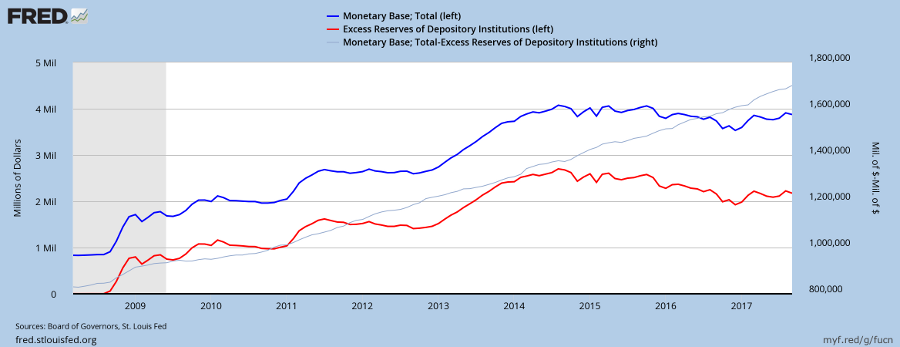
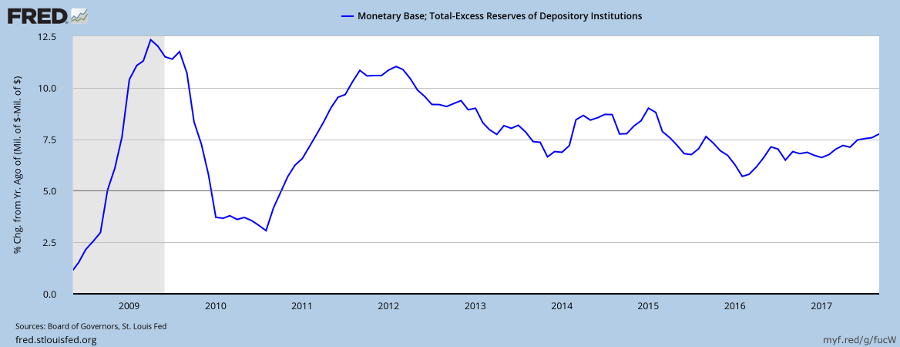
And credit growth is modest.

Credit Growth

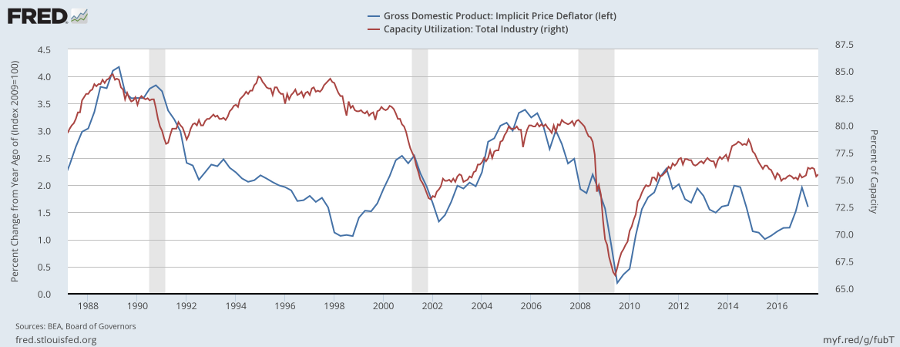
So not much sign of inflationary pressure.

….Turning to financial conditions, as yet there is no concern of them becoming an impediment to growth or policy. The 10yr yield has moved back to the highs of 2013, but the US dollar has only partly retraced its 2017 depreciation. Further, asset markets remain near recent highs.

Equally significant however is the reference to being nearer neutral and a clear desire to keep the yield curve’s positive slope…..

We do not believe that the yield curve will invert in this instance, in part because higher deficits should see the term premium rise. However, the curve will remain comparatively flat versus history, restricting both the timing and the scale of further rate hikes. This is a key justification for both the market’s and our own view of only two further hikes in 2018 and two more in 2019 – a stark contrast to the FOMC’s seven hikes to end-2020.

Yield Differential

A negative yield curve — when 10-year minus 3-month Treasury yields falls below zero — would give a strong recession warning. But the yield curve is only likely to invert if the Fed steps up interest rate increases. With little sign of rising inflationary pressure at present, the prospect seems remote.

No Fed Squeeze in Sight

In January I warned that the Fed’s normalization plan, which will shrink its balance sheet at the rate of $100 billion in 2018 and $200 billion a year thereafter, would cause Treasury yields to rise and the Dollar to weaken.

10-Year Treasury yields are now testing resistance at 3.0 percent. Breakout would signal the end of a decades-long bull market in bonds and start of a bear market as yields rise.

10-Year Treasury yields

The Dollar Index is in a primary down-trend but the recent rally above the descending trendline suggests that a bottom may be forming.

Dollar Index

Commodity prices, which I suggested would climb as the Dollar weakened, are strengthening but remain in an ascending triangle, testing resistance at 90 on the Dow Jones – UBS Commodity Index.

Dow Jones - UBS Commodity Index

Crude, however, is surging and commodities are likely to follow.

WTI Light Crude

Rising commodity prices — especially crude — would lift inflation, raising the threat of tighter Fed monetary policy.

Until now, financial markets have absorbed the Fed shrinking its balance sheet. Primarily because there hasn’t been any contractionary effect at all.

The orange line on the chart below shows Fed assets net of excess reserves of commercial banks on deposit at the Fed. If commercial banks withdraw excess reserves at a faster rate than the Fed shrinks its balance sheet then the net effect is expansionary, with a rising orange line as at present. There are still $2 trillion of excess reserves on deposit at the Fed, so this could go on for years.

Fed Assets Net of Excess Reserves

The Fed funds rate is climbing, but at a measured pace. I doubt that the market will be too concerned by the FFR at 2.0 percent. The threat is if the Fed accelerates rate hikes in response to rising inflation, as in 2004 to 2006.

Fed Funds Rate and MZM Money Stock

Inflationary forces remain subdued, with the average hourly wage rate growing at a modest 2.6 percent a year.

Average Hourly Wage Rate Growth

A spike above 3.0 percent would spur the Fed into action but there is no sign, so far, as rising automation and competition from offshore labor markets ease upward pressure despite low unemployment.

Bob Doll: First quarter earnings continue to impress

Bob Doll

More positive news on earnings from Bob Doll’s weekly newsletter:

…..2. First quarter earnings results continue to impress, helped by tax cuts. With 85% of companies reporting, earnings are ahead of expectations by an average of 7.3%.1 Earnings-per-share growth is on track for 25%.1 Were it not for the effects of tax cuts, that number would be only 18%.1

3. Even if earnings are peaking, that does not necessarily mean the equity bull market is ending. According to one study, since the 1950s, a cyclical peak in earnings growth has tended to be followed by stock prices moving higher: From a peak in earnings-per-share growth, stock prices were still higher six months later 74% of the time and were higher 12 months later 68% of the time.2.

Fears of an earnings peak may be overblown, with inflation low, rate hikes at a measured pace, consumption strong and inflation contained despite low unemployment. Upside and downside risks appear balanced in this summary adapted by Nuveen from Morgan Stanley:

Reasons to be optimistic

1) First quarter earnings are very strong.
2) Equity valuations are reasonable.
3) Corporate America is flush with cash.
4) U.S. growth momentum may be plateauing, but is not slowing.
5) Trade restrictions have not been as severe as feared.
6) Global monetary policy remains accommodative.
7) North Korea risks have eased.

Reasons to be cautious

1) Margin pressures could hurt future earnings.
2) Higher rates could represent a headwind for valuations.
3) Political risks may rise as the midterm elections approach.
4) Global growth may start to slow in the coming years.
5) Trade policy remains a long-term risk.
6) Investors may be too complacent about monetary tightening.
7) President Trump’s legal issues could escalate.

But it would be foolish to ignore either upside or downside risk. Adopting a balanced strategy may be the most sensible approach.

1Source: Credit Suisse.
2Source: BMO Capital Markets

Life left in US stocks

According to market pundits, the latest stock sell-off was fueled by concerns over rising bond yields and slowing growth for Caterpillar (CAT).

From CNBC:

….Caterpillar shares reversed lower during the call, when Chief Financial Officer Brad Halverson said first-quarter adjusted profits per share will be the highest for the year because of increased investment later in 2018.

“We expect the targeted investments for future growth to be higher over the remaining three quarters,” Halverson said. “The outlook assumes that first-quarter adjusted profit per share will be the high-water mark for the year.”

Caterpillar (CAT)

The stock fell 6.2% on Wednesday, ignoring the earnings report:

In the earnings report, the Illinois-based machinery manufacturer raised its 2018 profit outlook by $2 a share over the previous quarter, to a range of $10.25 to $11.25 per share. The rosier guidance exceeds a Reuters analyst survey that expected a range of $8.39 to $10.60 a share. The company cited better-than-expected sales volume as the main driver of its improved full-year guidance.

Since when has “better-than-expected sales volume,” upward earnings revision and increased new investment been a bear signal? The market is unusually jittery at present, focusing on any semblance of bad news and ignoring the good.

Even concern over rising bond yields is nothing new.

10-Year Treasury Yields

10-Year Treasury yields are testing resistance at 3.0%. Breakout would complete a double-bottom reversal, warning of a bear market in bonds as yields rise. But rising long-term rates are not bad news for stocks, especially when off a low base as at present. I would go so far as to say that, over the last 20 years, rising 10-year yields have been bullish for stocks. The chart below compares annual percentage change in 10-year Treasury yields and the Russell 3000 Total Market index.

10-Year Treasury Yields and Russell 3000 Index 12-Month Rate of Change

There is plenty more good news that the market seems to be ignoring.

First quarter 2018 corporate earnings have so far impressed. According to S&P Indices, 117 stocks in the S&P 500 had reported results by the morning of April 24th. Of those, 91 (77.8%) beat, 10 (8.5%) met and 16 (13.7%) missed their estimates. Misses are largely concentrated in Materials ( 3 of 5), Industrials (4 of 26) and Consumer Discretionary sectors (5 of 13).

Freight activity remains strong, signaling a reviving economy.

S&P 500

Wages growth remains tame, with average hourly earnings of production and non-supervisory employees increasing at an annual rate of 2.42%. Growth above 3.0% would warn that underlying inflation is rising and the Fed will be forced to tighten monetary policy. But that does not appear imminent.

S&P 500

Muted wages growth allowed corporate profits (the blue line below) to rebound after a threatened down-turn.

S&P 500

Consumption has recovered. Per capita consumption of non-durable goods is recovering after a flat spot in 2017, consumption of durable goods has been rising since 2016, while services remain strong.

S&P 500

In financial markets, risk premiums on corporate bonds (Baa minus Treasuries) have declined to below 2.0%, suggesting a healthy credit outlook.

S&P 500

Bank credit is recovering after faltering in 2017.

S&P 500

The yield curve is flattening as the Fed gradually raises interest rates. A flat yield curve is not a threat. Only if it inverts, when the yield differential (gray line on the chart below) falls below zero, is the economy at risk of falling into a recession. Growth in the money stock (green MZM line on the chart below) has slowed but remains healthy.

S&P 500

The Fed has committed to shrinking its $4 trillion investment in Treasuries and mortgage-backed securities (MBS) run up by quantitative easing (QE) between 2009 and 2014. So far the decline has had no impact on financial markets as bank excess reserves on deposit at the Fed are declining at a similar rate. The effect is that net assets (Fed Assets minus Excess Reserves) are holding steady at $2.4 trillion.

S&P 500

The Philadelphia Fed’s Leading Index remains healthy at above 1.0 percent.

S&P 500

And our estimate of real GDP is rising (2.14% in March 2018), suggesting that the economy is recovering from its flat spot in 2016/2017.

S&P 500

Valuations are high and investors are jittery but the bull market still appears to have further to run.

“Headwinds have turned into tailwinds”

“While many factors shape the economic outlook, some of the headwinds the U.S. economy faced in previous years have turned into tailwinds. Fiscal policy has become more stimulative and foreign demand for U.S. exports is on a firmer trajectory.”
~ New Fed Chair Jerome Powell in his first testimony before Congress

Two very important sentences for investors. Expect further rate hikes but at a moderate pace.

Bond yields have climbed in anticipation of higher inflation. Breakout above 3.0 percent would warn of a bond bear market, after the bull market of the last 3 decades, with rising yields.

10-Year Treasury Yields

The five-year breakeven rate (Treasury yield minus the equivalent yield on inflation indexed TIPS) has been climbing since 2016.

Fed Excess Reserves

But core CPI (CPI less Food & Energy) remains subdued.

And average hourly wage rates, reflecting underlying inflationary pressures, continue to grow at a modest 2.5 percent a year.

Private Sector Average Hourly Wage Rate Growth

Real GDP is likely to maintain its similarly modest growth.

Real GDP and Estimates

While the Fed is sitting on a powder keg of more than $2 trillion of commercial bank excess reserves, no one is playing with matches. Yet.

Federal Reserve Bank: Excess Reserves of Depositary Institutions

Those excess reserves on deposit at the Fed have the potential to fuel a massive bubble in stocks or real estate. But investors remain wary after their experience in 2008.

We should be careful to get out of an experience only the wisdom that is in it — and stop there; lest we be like the cat that sits down on a hot stove-lid. She will never sit down on a hot stove-lid again — and that is well; but also she will never sit down on a cold one anymore.

~ Samuel Clemens

How QE reversal will impact on financial markets

The Federal Reserve last year announced plans to shrink its balance sheet which had grown to $4.5 trillion under the quantitative easing (QE) program.

According to its June 2017 Normalization Plan, the Fed will scale back reinvestment at the rate of $10 billion per month and step this up every 3 months by a further $10 billion per month until it reaches a total of $50 billion per month in 2019. That means that $100 billion will be withheld in the first year and $200 billion each year thereafter.

How will this impact on financial markets? Here are a few clues.

First, from the Nikkei Asian Review on January 11:

The yield on the benchmark 10-year U.S. Treasury note shot to a 10-month high of 2.59% in London, before retreating later in the day and ending roughly unchanged in New York. Yields rise when bonds are sold.

The selling was sparked by reports that China may halt or slow down its purchases of U.S. Treasury holdings. China has the world’s largest foreign exchange reserves — holding $3.1 trillion, about 40% of which is in U.S. government notes, according to Brad Setser, senior fellow at the Council on Foreign Relations.

Chinese officials, as expected, denied the reports. But they would have to be pondering what to do with more than a trillion dollars of US Treasuries during a bond bear market.

Treasury yields are rising, with the 10-year yield breaking through resistance at 2.60%, signaling a primary up-trend.

On the quarterly chart, 10-year yields have broken clear of the long-term trend channel drawn at 2 standard deviations, warning of reversal of the three-decade-long secular trend. But final confirmation will only come from a breakout above 3.0%, completing a large double-bottom.

Withdrawal or a slow-down of US Treasury purchases by foreign buyers (let’s not call them investors – they have other motives) would cause the Dollar to weaken. The Dollar Index recently broke support at 91, signaling another primary decline.

The falling Dollar has created a bull market for gold which is likely to continue while interest rates are low.

US equities are likely to benefit from the falling Dollar. Domestic manufacturers can compete more effectively in both local and export markets, while the weaker Dollar will boost offshore earnings of multinationals.

The S&P 500 is headed for a test of its long-term target at 3000*.

Target: 1500 x 2 = 3000

Emerging market borrowers may also benefit from lower domestic servicing costs on Dollar-denominated loans.

Bridgewater CEO Ray Dalio at Davos:

We are in this Goldilocks period right now. Inflation isn’t a problem. Growth is good, everything is pretty good with a big jolt of stimulation coming from changes in tax laws…

If there is a downside, it is likely to be higher US inflation as employment surges and commodity prices rise. Which would force the Fed to raise interest rates faster than the market expects.

Leading Index gives early warning

One of the better composite indicators in the US, the Leading Index from the Philadelphia Fed, points to a slow-down in the US economy. A dip below 1.0% is often early, as in July 2000 and May 2006, but serves as a reliable warning of an economic slow-down.

Leading Index for the United States

The Leading Index predicts the six-month growth rate of the Philadelphia Fed Coincident Index. In addition to the Coincident Index, it includes variables that lead the economy: housing permits (1 to 4 units), initial unemployment insurance claims, delivery times from the ISM manufacturing survey, and the interest rate spread between the 10-year Treasury bond and the 3-month Treasury bill.

The Coincident Index combines four indicators: nonfarm payroll employment, the unemployment rate, average hours worked in manufacturing and wages and salaries.

Coincident Index for the United States

The Leading Index signal does seem early. Low corporate bond spreads and VIX near record lows continue to indicate low market risk, typical of a bull market.

Corporate Bond Spreads and VIX

Monetary policy remains accomodative, with money stock growing at close to 5% p.a. (MZM = cash in circulation, travelers checks, money market funds and deposits with zero maturity).

MZM and Yield Differential

The yield curve has flattened, with the spread between 10-year and 3-month Treasuries falling to 1.0% on the above graph. That is what one would expect when the Fed hikes interest rates in a low inflation environment: short-term rates will rise faster than long-term rates. But a negative yield curve, where short-term rates are higher than long-term rates, is a reliable predictor of recessions in the US economy. Each time the yield differential on the above graph crossed below zero in the last 50 years, a recession has followed within 12 months.

Underlying inflation remains low, with average hourly earnings growth below 2.5% p.a., and the Fed should be careful about single-mindedly raising interest rates without considering the yield curve.

Annual Growth in Average Hourly Earnings

The bull market continues but investors need to keep a weather eye on interest rates and the yield curve.

Fed flunks econ 101?

Caroline Baum’s opinion on the Fed’s approach to inflation:

For all the sturm und drang about the Fed debasing the dollar and sowing the seeds of the next great inflation, the public’s demand for money has increased. The increased desire to hold cash and checkable deposits has risen to meet the increased supply. Velocity, or the rate at which money turns over, has plummeted.

The Fed has two choices. It can adopt the Dr. Strangelove approach and learn to stop worrying and live with low inflation and low unemployment. Or it can do something about it, which runs counter to its stated intention to raise the funds rate and reduce the size of its balance sheet.

Option #1 involves learning to live with a low, stable inflation rate about 0.5 percentage point below the Fed’s explicit 2% target.

Not only has the Fed has achieved price stability in objective terms, but it has also fulfilled former Fed Chairman Alan Greenspan’s subjective definition of price stability: a rate of inflation low enough that it is not a factor in business or household decision-making.

Option #2 means taking some additional actions to increase the money supply by lowering interest rates or resuming bond purchases. The Fed is taking the opposite approach. It began its balance sheet normalization this month, allowing $10 billion of securities to mature each month and gradually increasing the amount every quarter. And it has guided markets to expect another 25-basis-point rate increase in December….

The Fed faces a delicate balancing act. Unemployment is low but capacity utilization is also low, indicating an absence of inflationary pressure.

Capacity Utilization

Janet Yellen understandably wants to normalize interest rates ahead of the next recession but she can afford to take her time. The economy is unlikely to tip into recession unless the Fed hikes rates too quickly, causing a monetary contraction.

I believe the Fed chair is relying on the outflow from more than $2 trillion of excess reserves held by banks on deposit with the Fed to offset the contractionary effect of any rate hikes.

Capacity Utilization

If pushed, the Fed could lower the interest rate paid on excess reserves in order to encourage banks to withdraw excess deposits. But so far this hasn’t been necessary. The attraction of higher interest rates in financial markets has been sufficient to encourage a steady outflow from excess reserves, keeping the monetary base (net of reserves) growing at a steady clip of close to 7.5% p.a. despite rate hikes so far.

Capacity Utilization

Makes you wonder why Donald Trump would even consider replacing the Fed chair when she is doing a great job of managing the recovery.

Source: Fed flunks econ 101: understanding inflation – MarketWatch