Extraordinary times of low unemployment and low inflation

Unemployment fell to 3.7% for September, well below the long-term natural rate of unemployment. This normally signifies a tightening labor market, a precursor to higher inflation.

Unemployment and the Natural Rate

But growth in average hourly earnings dipped slightly, to 2.75% for the past 12 months. Underlying inflationary forces remain subdued.

Average Wage Rates

As Fed Chairman Powell suggested, the Fed may be overestimating the natural rate. In his speech on Tuesday Powell summed up the current situation:

…Many of us have been looking back recently on the decade that has passed since the depths of the financial crisis. In light of that experience, I am glad to be able to stand here and say that the economy is strong, unemployment is near 50-year lows, and inflation is roughly at our 2 percent objective. The baseline outlook of forecasters inside and outside the Fed is for more of the same.

This historically rare pairing of steady, low inflation and very low unemployment is testament to the fact that we remain in extraordinary times. Our ongoing policy of gradual interest rate normalization reflects our efforts to balance the inevitable risks that come with extraordinary times, so as to extend the current expansion, while maintaining maximum employment and low and stable inflation.

It’s a bull market

The US economy continues to show signs of a robust expansion. Net capital formation is rising (as a percentage of GDP) as it is wont to do during a boom. In layman’s terms net capital formation is the net growth in physical assets used in the production of goods and services, after allowing for depreciation.

Net Capital Formation

The Wicksell spread has turned positive. When return on investment (we use nominal GDP growth as a surrogate) exceeds the cost of capital (reflected by low investment grade Baa bond yields) that encourages new investment and economic expansion as in the 1960 – 1980 period on the chart below.

Wicksell Spread

Real bond yields, reflected below by Baa yields minus core CPI (blue line) on the chart below, are also near record lows. Low real returns on bonds support high stock earnings multiples.

Real Bond Yields

Fed Chairman Powell summed up the situation in a speech on Tuesday this week:

…Many of us have been looking back recently on the decade that has passed since the depths of the financial crisis. In light of that experience, I am glad to be able to stand here and say that the economy is strong, unemployment is near 50-year lows, and inflation is roughly at our 2 percent objective. The baseline outlook of forecasters inside and outside the Fed is for more of the same.

This historically rare pairing of steady, low inflation and very low unemployment is testament to the fact that we remain in extraordinary times. Our ongoing policy of gradual interest rate normalization reflects our efforts to balance the inevitable risks that come with extraordinary times, so as to extend the current expansion, while maintaining maximum employment and low and stable inflation.

The biggest risk is that investors get carried away and drive earnings multiples sky high, but gradual rate increases from the Fed and the threat of tariff wars appear to be keeping animal spirits in check.

Treasury yields confirm bond bear market

10-Year Treasury yields respected their new support level at 3.00%, confirming a primary advance.

10-year Treasury Yield

Breakout above 3.00% also completes a double-bottom reversal, signaling the end of a three-decade-long secular bull market in bonds.

LT 10-year Treasury Yield

The yield differential between 10-year and 3-month Treasuries is declining but a flat yield curve does not warn of a recession. Only if the yield differential crosses below zero, with short-term yields rising faster than long-term, will there be a recession warning.

Real returns on long-term bonds — the gap between the green and blue lines below — remain near record lows.

1981 to 2018: 10-Year Treasury Yields and GDP Implicit Price Deflator

Only if the gap widens (real returns rise significantly) are we likely to see downward pressure on stock valuations, with falling price-earnings multiples.

Wage increases haven’t made a dent in profits

Average hourly earnings growth continues to rise, albeit at a leisurely pace. Average hourly earnings for all employees in the private sector grew at 2.92% over the last 12 months, while production and nonsupervisory employee earnings grew at 2.80% over the same period. The Fed is likely to adopt a more restrictive stance if hourly earnings growth, representing underlying inflationary pressures, exceeds 3.0%. So far the message from Fed Chair Jerome Powell has been business as usual, with rate hikes at a measured pace.

Average Hourly Earnings

Rising wage rates to-date have been unable, up to Q2 2018, to make a dent in corporate profits. Corporate profits are near record highs at 13.4%, while employee compensation is historically low at 69.5% of net value added. Past recessions have been heralded by rising employee compensation and falling corporate profits. What we are witnessing this time is unusual, with compensation rising, admittedly from record low levels, while profits rebounded after a low in Q4 2016. There is no indication that this will end anytime soon.

Corporate Profits and Employee Compensation as Percentage of Value Added

Weaker values (1.17%) on the Leading Index from the Philadelphia Fed reflect a flatter yield curve. A fall below 1.0% would be cause for concern.

Philadelphia Fed Leading Index

Our surrogate for real GDP, Total Payrolls x Average Weekly Hours Worked, is lagging behind recent GDP growth (1.9% compared to 2.9%) but both are rising.

Real GDP and Total Payroll*Average Hours Worked

Another good sign is that personal consumption expenditure, one of the key drivers of economic growth, is on the mend. Services turned up in Q2 2018 after a three-year decline. Durable goods remain strong. Nondurables are weaker but this may reflect a reclassification issue. New products such as Apple Music and Netflix are classified as sevices but replace sales of goods such as CDs and videos.

Personal Consumption

There is no cause for concern yet, but we will need to keep a weather-eye on the yield curve.

Markets are constantly in a state of uncertainty and flux, and money is made by discounting the obvious and betting on the unexpected.

~ George Soros

S&P 500 volatility falls

The Philadelphia Fed Leading Index at 1.42 for June 2018 maintains a healthy margin above the 1% level that would warn of a potential slow-down.

Philadelphia Fed Leading Index

The picture reinforces a steeply-climbing Freight Transportation Index, indicating strong economic activity.

Freight Transportation Index

Concerns that the economy may over-heat, spiking inflation, are not reflected in strong growth in average hourly earnings. The Fed has done a good job of containing money supply growth, with growth in the broad money supply (MZM plus time deposits) closely tracking nominal GDP.

Nominal GDP and Money Supply Growth

Credit and money supply expansion at faster rates than nominal GDP have in the past flagged an overheating economy and higher inflation, leading to a recession when the Fed attempts to curb inflation.

We are in stage 3 of a bull market but there are few signs that the economy will slow or earnings will fall.

The S&P 500 respected its new support level at 2800, confirming an advance to 3000. Declining Twiggs Volatility (21-day) signals that market risk is low and we can expect business as usual.

S&P 500

The NASDAQ 100 continues to warn of a correction, with bearish divergence on Twiggs Money Flow. This is secondary in nature, because of the indicator’s position relative to the zero line, but could test support at 7000.

Nasdaq 100

CPI rises but US stocks rally

June consumer price index (CPI) jumped to 2.8% but forward estimates of inflation, represented by the 5-Year breakeven rate (5-year Treasury yield minus TIPS) remain subdued at 2.06%.

CPI and 5-Year Breakeven

Core CPI (excluding food and energy) is at 2.2% while average hourly earnings (total private: production and non-supervisory employees) annual growth, representing underlying inflationary pressure, is higher at 2.7%.

Core CPI and Average Hourly Earnings: Production and Nonsupervisory

Credit and broad money supply (MZM plus time deposits) growth remain steady, tracking nominal GDP growth at around 5.0%. A spike in credit growth often precedes a similar spike in broad money supply by several quarters.

Credit and Broad Money Supply Growth

And a surge in broad money supply growth, ahead of nominal GDP, flagged rising inflationary pressures ahead of the last two recessions, prompting the Fed to step on the brakes.

Nominal GDP and Broad Money Supply Growth

Overall, the inflation outlook appears subdued, with little urgency to hike interest rates at present.

The market is also getting more comfortable with the idea of trade tariffs. The S&P 500 is testing resistance at 2800. Breakout is likely and would suggest a primary advance to 3000.

S&P 500

The Nasdaq 100 followed through above 7300, confirming the primary advance, with a target of 7700.

Nasdaq 100

This is the final stage of a bull market but there is no sign of it ending. I am wary of the impact of a trade war on individual stocks and have reduced exposure to multinationals that make a sizable percentage of their sales in China.

Financial markets are supposed to swing like a pendulum: They may fluctuate wildly in response to exogenous shocks, but eventually they are supposed to come to rest at an equilibrium point…. Instead, as I told Congress, financial markets behaved more like a wrecking ball, swinging from country to country and knocking over the weaker ones. It is difficult to escape the conclusion that the international financial system itself constituted the main ingredient in the meltdown process.

~ George Soros on the 1997 Asian Financial Crisis and the need for greater regulation of global financial markets

S&P 500 and Nasdaq relief

June average hourly earnings growth came in flat at 2.74% for Total Private sector and 2.72% for Production and Non-supervisory Employees. This suuports the argument that underlying inflation remains benign, easing pressure on the Fed to accelerate interest rates.

Average Hourly Earnings Growth

The S&P 500 rallied off its long-term rising trendline. Follow-through above 2800 would suggest another primary advance with a target of 3000.

S&P 500

The Nasdaq 100 respected its new support level at 7000, signaling a primary advance. The rising Trend Index indicates buying pressure. Target for the advance is 7700.

Nasdaq 100

The Leading Index from the Philadelphia Fed is a healthy 1.51% for May. Well above the 1.0% level that suggests steady growth (falls below 1.0% are cause for concern).

Leading

Our estimate of annual GDP growth — total payroll x average weekly hours worked — is muted at 1.91% but suggests that earnings growth will remain positive.

Real GDP Estimate

Personal consumption figures for Q1 2018 show growth in consumption of services is slowing but durable goods remain strong, while nondurable goods are steady.

Consumption to Q1 2018

Declining consumption of nondurables normally coincides with a recession but is often preceded by slowing durable goods — below 5.0% on the chart below — for several quarters.

Consumption to Q1 2018

Conclusion: Expect further growth but be cautious of equities that are vulnerable to escalating trade tariffs.

We live in a global economy, but the political organization of our global society is woefully inadequate. We are bereft of the capacity to preserve peace and to counteract the excesses of the financial markets. Without these controls, the global economy, is liable to break down.

~ George Soros: The Crisis of Global Capitalism (1998)

Australia: Good news and bad news

First, the good news from the RBA chart pack.

Exports continue to climb, especially in the Resources sector. Manufacturing is the only flat spot.

Australia: Exports

Business investment remains weak and is likely to impact on long-term growth in both profits and wages.

Australia: Business Investment

The decline is particularly steep in the Manufacturing sector and not just in Mining.

Australia: Business Investment by Sector

But government investment in infrastructure has cushioned the blow.

Australia: Public Sector Investment

Profits in the non-financial sector remain low, apart from mining which has benefited from strong export demand.

Australia: Non-Financial Sector Profits

Job vacancies are rising which should be good news for wage rates. But this also means higher inflation and, down the line, higher interest rates.

Australia: Job Vacancies

The housing and financial sector is our Achilles heel, with household debt climbing a wall of worry.

Australia: Housing Prices and Household Debt

House prices are shrinking despite record low interest rates.

Australia: Housing Prices

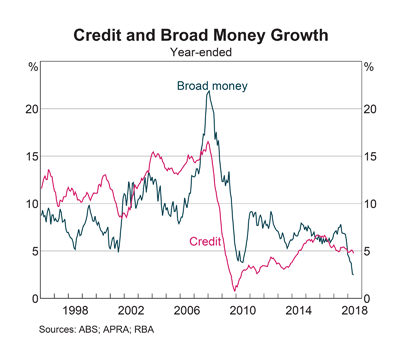
Broad money and credit growth are slowing, warning of a contraction.

Australia: Broad Money and Credit Growth

Bank profits remain strong.

Australia: Bank Profits

But capital ratios are low, with the bulk of profits distributed to shareholders as dividends. The ratios below are calculated on risk-weighted assets. Raw leverage ratios are a lot weaker.

Australia: Bank Capital Ratios

One of the primary accelerants of the housing bubble and household debt has been $900 billion of offshore borrowings by domestic banks. The chickens are coming home to roost, with bank funding costs rising as the Fed hikes interest rates. In the last four months the 90-day bank bill swap rate (BBSW) jumped 34.5 basis points.

The banks face a tough choice: pass on higher interest rates to mortgage borrowers or accept narrower margins and a profit squeeze. With an estimated 30 percent of households already suffering from mortgage stress, any interest rate hikes will impact on both housing prices and delinquency rates.

I continue to avoid exposure to banks, particularly hybrids where many investors do not understand the risks.

I also remain cautious on mining because of a potential slow-down in China, with declining growth in investment and in retail sales.

China: Activity

Low inflation risk keeps yield curve safe

The Fed is advancing interest rates at a measured pace, with the objective of restoring balance in financial markets rather than to curbing inflationary pressures. Only if inflation spikes is the Fed likely to adopt a restrictive stance.

Elliot Clarke from Westpac sums up the FOMC (Fed Open Market Committee) view from their latest minutes:

Beginning with inflation, whereas the market has recently been concerned that inflation may be getting away from the FOMC (given annual CPI inflation at 2.5%yr and persistent strength in the oil price), the Committee is unperturbed.

Instead of the CPI, the FOMC’s benchmark remains PCE inflation, which is currently 2.0%yr on a headline basis and 1.9%yr for core…..

To see upside inflation risks build, a stronger wage inflation pulse is necessary. At present the employment cost index is only reporting “a gradual pickup in wage increases”, and the signal from other wage measures is “less clear”. Two other important considerations for the pass through of wages to activity and thus inflation is that real hourly earnings growth is currently flat and the savings rate near historic lows. The capacity of households to boost consumption and thus inflation is therefore very limited.

Hourly wage rates are growing at a gradual pace.

Hourly Wage Rate Growth

Personal savings are low.

Personal Savings

And credit growth is modest.

Credit Growth

So not much sign of inflationary pressure.

….Turning to financial conditions, as yet there is no concern of them becoming an impediment to growth or policy. The 10yr yield has moved back to the highs of 2013, but the US dollar has only partly retraced its 2017 depreciation. Further, asset markets remain near recent highs.

Equally significant however is the reference to being nearer neutral and a clear desire to keep the yield curve’s positive slope…..

We do not believe that the yield curve will invert in this instance, in part because higher deficits should see the term premium rise. However, the curve will remain comparatively flat versus history, restricting both the timing and the scale of further rate hikes. This is a key justification for both the market’s and our own view of only two further hikes in 2018 and two more in 2019 – a stark contrast to the FOMC’s seven hikes to end-2020.

Yield Differential

A negative yield curve — when 10-year minus 3-month Treasury yields falls below zero — would give a strong recession warning. But the yield curve is only likely to invert if the Fed steps up interest rate increases. With little sign of rising inflationary pressure at present, the prospect seems remote.

No Fed Squeeze in Sight

In January I warned that the Fed’s normalization plan, which will shrink its balance sheet at the rate of $100 billion in 2018 and $200 billion a year thereafter, would cause Treasury yields to rise and the Dollar to weaken.

10-Year Treasury yields are now testing resistance at 3.0 percent. Breakout would signal the end of a decades-long bull market in bonds and start of a bear market as yields rise.
10-Year Treasury yields

The Dollar Index is in a primary down-trend but the recent rally above the descending trendline suggests that a bottom may be forming.

Dollar Index

Commodity prices, which I suggested would climb as the Dollar weakened, are strengthening but remain in an ascending triangle, testing resistance at 90 on the Dow Jones – UBS Commodity Index.

Dow Jones - UBS Commodity Index

Crude, however, is surging and commodities are likely to follow.

WTI Light Crude

Rising commodity prices — especially crude — would lift inflation, raising the threat of tighter Fed monetary policy.

Until now, financial markets have absorbed the Fed shrinking its balance sheet. Primarily because there hasn’t been any contractionary effect at all.

The orange line on the chart below shows Fed assets net of excess reserves of commercial banks on deposit at the Fed. If commercial banks withdraw excess reserves at a faster rate than the Fed shrinks its balance sheet then the net effect is expansionary, with a rising orange line as at present. There are still $2 trillion of excess reserves on deposit at the Fed, so this could go on for years.

Fed Assets Net of Excess Reserves

The Fed funds rate is climbing, but at a measured pace. I doubt that the market will be too concerned by the FFR at 2.0 percent. The threat is if the Fed accelerates rate hikes in response to rising inflation, as in 2004 to 2006.

Fed Funds Rate and MZM Money Stock

Inflationary forces remain subdued, with the average hourly wage rate growing at a modest 2.6 percent a year.

Average Hourly Wage Rate Growth

A spike above 3.0 percent would spur the Fed into action but there is no sign, so far, as rising automation and competition from offshore labor markets ease upward pressure despite low unemployment.