Ultra-low interest rates may lead to a ‘debt trap’

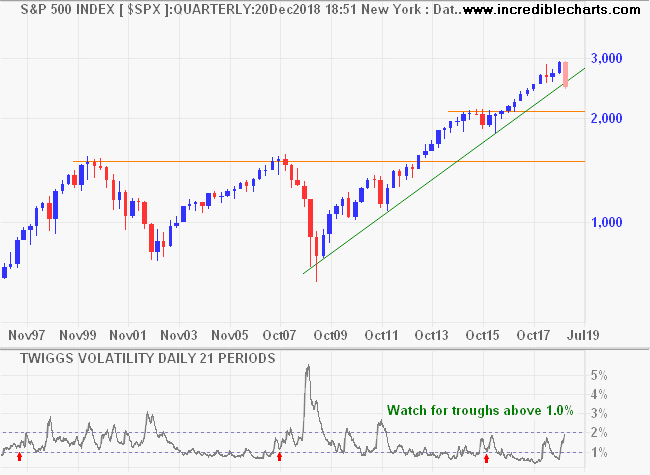
The highly-regarded Stephen Bartholomeusz warns that central bank policies may lead to a ‘debt trap’:

“….With the world apparently re-starting the use of unconventional monetary policies even before central banks have extricated themselves from the legacies of a decade of those policies, there is a real risk that the impacts and the threats posed by their side effects will swell and that the world will be caught within what the BIS has previously described as a “debt trap’’ with no exit.

The other disturbing aspect of the [BIS] report is that it repeatedly says it is too early to assess the longer-term implications of the policies the central banks have employed.

Central bankers respond to the latest data – they respond to short-term signals – but the side-effects of their post-crisis policies have already been building for a decade and will continue to build while they maintain ultra-low or negative policy rates and keep buying bonds and other fixed interest securities to depress longer-term interest rates and suppress risk premia.

How those side-effects are unwound and how the banks extricate themselves from their policies and the legacies of those policies won’t be known until they try, but the potential for another crisis has been increased by the big surge in global leverage and the elevated asset prices the policies have encouraged.

Negative rates and quantitative easing and variations on those themes might, as the BIS report says, be useful additions to central bankers’ toolboxes but the past decade has shown they aren’t by themselves a panacea for economic ills and they bring with them potentially unpleasant side effects the longer they are in place.”

Debt traps occur when the interest rate needed to service the government debt is greater than the growth rate of GDP, according to former Fed governor Robert Heller:

“…In such a situation, debt service obligations grow more rapidly than the economy; eventually, the accumulated debt can no longer be serviced properly. In other words, the dynamics of the situation become unsustainable and a death spiral ensues.”

So far, central banks have responded by driving interest rates to record lows but unintended consequences are emerging, with low interest rates leading to low GDP growth. A feedback loop is emerging:

    • Low interest rates

Australia: 10-Year Bond Yield

    • Low bank interest margins

Australia: Bank Net Interest Margins

    • Low credit growth

Australia: Credit & Broad Money Growth

    • Low inflation

Australia: Underlying Inflation

    • And low economic growth

Australia: GDP Growth

We are venturing where angels fear to tread: central banks trialing new policies without empirical evidence as to their long-term consequences.

Monetary policy should be administered judiciously, intervening only when the financial system is in dire straits, outside the realm of the regular business cycle. Instead monetary policy is treated as a panacea, the constant drip-feed building a long-term dependence on further stimulus.

The problem with ‘traps’ is that they are difficult to escape.

“If you find yourself in a hole, the first thing to do is stop digging.”

~ Will Rogers

[NOTE: I should clarify that Australia has relatively low fiscal debt and is not in any immediate danger of a debt trap. But the ‘lucky country’ would suffer severely from fallout if the US or China were caught in a debt trap.]

S&P 500 buying pressure but payrolls disappoint

August labor stats, released today, point to low real GDP growth for Q3. Growth in weekly hours worked came in at a low 1.09% and GDP is likely to follow.

Real GDP and Hours Worked

While inflation is not the primary concern at the Fed right now, rising annual hourly wage rate growth (3.46% for total private) flags an increase in underlying inflationary pressure. This may make the Fed more hesitant about cutting rates despite Donald Trump’s tweet storm.

Average Hourly Wage Rate

Most important is the continued decline in annual payroll growth. At 1.38% for August, further weakness is likely and a fall below 1.0% would warn of an economic slow-down.

Real GDP and Hours Worked

The S&P 500 is headed for another test of resistance at 3000. The Trend Index oscillating above zero for the last 9 months indicates buying pressure but I expect strong resistance at 3000. Upside is limited while downside risks are expanding.

S&P 500

Semiconductors are doing better than expected, despite the trade war, but I suspect will weaken when the surge in orders ahead of tariffs tails off.

Semiconductors

Retail has stalled since late 2018 and bearish divergence on the Trend Index suggests selling pressure.

Retail

Automobiles, in a decline since 2017, have rallied over the last 6 months. But, again, further weakness is expected.

Automobiles

On the global front, weak crude oil prices flag an anticipated slow-down in the global economy. Breach of support at $50/$51 per barrel would be a strong bear signal, warning of a decline to $40 per barrel.

Nymex Light Crude

We maintain our bearish outlook and have reduced equity exposure for international stocks to 40% of portfolio value.

S&P 500: Treasuries reflect flight to safety

10-Year Treasury yields plunged below 2.0% on Donald Trump’s announcement of further tariffs (10% on $300bn) on China. The fall reflects rising demand for Treasuries as a safe haven in these turbulent times.

10-Year Treasury Yield

The spread between 10-Year and 3-Month Treasuries recovered above zero. This is a bearish sign: recession normally follows the recovery and not the initial inversion.

10-Year 3-Month Treasury Spread

The S&P 500 retreated below 3000 on Trump’s announcement, strengthening the bearish divergence signal on Twiggs Money Flow which warns of a correction. A test of support at 2750 is likely.

S&P 500

The Russell 2000 ETF (IWM) is expected to test primary support at 145. Small cap stocks have lagged the S&P 500 this year, highlighting risk aversion.

Russell 2000 Small Caps Index

Dow Jones Euro Stoxx 600, reflecting large cap stocks in the European Union, is similarly headed for a test of primary support at 365. Strong bearish divergence on the Trend Index warns of a reversal.

DJ Euro Stoxx 600

Falling commodity prices reflect market concerns for the global economy. A Nymex Light Crude breach of $51/barrel would signal a primary down-trend. Declining peaks on the Trend Index warn of selling pressure.

Nymex Light Crude

The DJ-UBS Commodity Index is similarly headed for a test of support at 75. Breach would signal a primary down-trend. A peak near zero on the Trend Index warns of strong selling pressure.

DJ-UBS Commodity Index

Dr Copper, often used as a barometer of the global economy, has breached primary support at 5800, signaling a decline. Again, a Trend Index peak below zero warns of strong selling pressure.

Copper

Employment stats for July have improved slightly, with Average Hourly Wages growth easing to 3.3% (Total Private).

Average Hourly Wage

And annual payroll growth ticked up to 1.5%

Employment Growth & FFR

But weekly hours worked are declining, warning that real GDP will decline further, after printing 2.3% for the second quarter.

Real GDP & Weekly Hours Worked

I have warned my clients to cut exposure to the market. It’s a good time to be cautious.

“Price is what you pay; value is what you get.”

~ Benjamin Graham

Rate cuts and buybacks – the emperor’s new clothes

The interest rate outlook is softening, with Fed chairman Jerome Powell hinting at rate cuts in his Wednesday testimony to Congress:

“Our baseline outlook is for economic growth to remain solid, labor markets to remain strong and inflation to move back over time.”
but…. “Uncertainties about the outlook have increased in recent months. In particular, economic momentum appears to have slowed in some major foreign economies and that weakness could affect the US economy.”

Stephen Bartholomeusz at The Sydney Morning Herald comments:

“Perhaps the most disturbing aspect of the Fed shifting into an easing cycle before there is strong evidence to warrant it, is economies already stuck in high debt and low growth environments will be forced even deeper into the kind of policies that in Japan have produced more than 30 years of economic winter with no apparent escape route.”

If the Fed moves too early they could further damage global growth, with long-term consequences for US stocks. But markets are salivating at the anticipated sugar hit from lower rates. Stocks surged in response to Powell’s speech, with the S&P 500 breaking resistance at 3000. A rising Trend Index indicates buying pressure.

S&P 500

The argument for higher stock prices is that lower interest rates may stave off a recession. The chart below shows how recessions (gray bars) are normally preceded by rising interest rates (green) followed by sharp cuts when employment growth (blue) starts to fall.

Fed Funds Rate & Payroll Growth

Rate cuts themselves are not a recession warning, unless accompanied by declining employment growth. Otherwise, as in 1998 when there was minimal impact on employment, the economy may recover. Falling employment growth is, I believe, the most reliable recession warning. So far, the decline in growth has been modest but should be monitored closely.

Falling employment is why recessions tend to lag an inverted yield curve (negative 10-year minus 3-month Treasury yield spread) by up to 18 months. The negative yield curve is a reliable warning of recessions only because it reflects the Fed response to rising inflation and then falling employment.

Yield Spread

Valuations

A forward Price-Earnings ratio of 19.08 at the end of June 2019 warned that stocks are highly priced relative to forecast earnings. The forward PE  jumped to 19.55 by Friday — an even stronger warning.

S&P 500 Forward Price-Earnings Ratio

June 2019 trailing Price-Earnings ratio at 21.52 warned that stock prices are dangerously high when compared to the 1929 and 1987 peaks preceding major crashes. That has now jumped to 22.04.

S&P 500 Price-Earnings (based on highest trailing earnings)

The only factor that could support such a high earnings multiple is unusually strong earnings growth.

But real corporate earnings are declining. Corporate profits, before tax and adjusted for inflation, are below 2006 levels and falling. There are still exceptional stocks that show real growth but they are counter-balanced by negative real growth in other stocks.

Corporate Profits before tax adjusted for Inflation

Impossible, you may argue, given rising earnings for the S&P 500.

S&P 500 Earnings

There are three key differences that contribute to earnings per share growth for the S&P 500:

  1. Inflation;
  2. Taxes; and
  3. Stock Buybacks.

Inflation is fairly steady at 2.0%.

GDP Implicit Price Deflator & Core CPI

Quarterly tax rates declined from 25% in Q3 2017 to 13.22% in Q4 2018 (source: S&P Dow Jones Indices).

S&P 500 Quarterly Tax Rates

Stock buybacks are climbing. The buyback yield for the S&P 500 rose to 3.83% in Q4 2018 (source: S&P Dow Jones Indices).

S&P 500 Buyback Yield

The 2017 Tax Cuts and Jobs Act caused a surge in repatriation of offshore cash holdings — estimated at almost $3 trillion — by multinationals. And a corresponding increase in stock buybacks.

S&P 500 Buybacks, Dividends & Earnings

In summary, the 2018 surge in S&P 500 earnings is largely attributable to tax cuts and Q1 2019 is boosted by a surge in stock buybacks in the preceding quarter.

Buybacks plus dividends exceed current earnings and are unsustainable in the long run. When the buyback rate falls, and without further tax cuts, earnings growth is going to be hard to find. Like the emperor’s new clothes.

It’s a good time to be cautious.

“Only when the tide goes out do you discover who’s been swimming naked”.

~ Warren Buffett

S&P 500: Short-term versus long run

The market is excited at the prospect of Fed rate cuts (in response to the US-CCP trade war), with the S&P 500 headed for another test of its earlier high at 2950. A Trend Index trough above zero indicates short-term buying pressure.

S&P 500

Falling bond yields, however, warn of a flight to safety. 10-Year Treasury yields have fallen close to 120 basis points (bps) since late 2018, as investors shift from equities to bonds. Prices are being supported by stock buybacks rather than investor inflows.

10-year Treasury Yields

The Yield Differential between 10-year (purple) and 3-month (lime) Treasury yields is now negative, a reliable early warning of recession.

Yield Differential: 10-Year and 3-Month Treasuries

Corporate bond spreads, the difference between lowest investment grade (Baa) and Treasury yields, are rising. An indicator of credit risk, a spread above 2.5% (amber) is an early warning of trouble ahead, while 3.0% (red) signals that risk is elevated.

10-Year Baa minus Treasury Yield

Falling employment growth is another important warning. Annual employment growth below 1.0% (amber) would normally cause the Fed to cut interest rates. In the current scenario, that is almost certain.

Employment Growth & FFR

What is holding the Fed back is average hourly wages. Annual growth above 3.0% is indicative of a tight labor market and warns against cutting rates too hastily.

Average Hourly wage Rate

Stats for Q1 2019 warn that compensation is rising as a percentage of net value added, while profits are falling. As can be seen from the previous two recessions (gray bars), rising compensation (as % of NVA) normally leads to falling profits and a recession. Cutting interest rates would accelerate this.

Profits & Compensation % of Value Added

Annual GDP growth came in at 3.2% (after inflation) for the first quarter, but growth in hours worked is slowing. GDP growth is likely to follow.

Real GDP & Hours Worked

Personal consumption expenditure for Q1 was largely positive, with an uptick in services and non-durable goods. But consumption of durable goods fell sharply, warning that consumer confidence in the medium-to-long-term is declining.

Consumption

On the global stage, commodity prices are falling, indicating an anticipated drop in demand, especially from China.

DJ-UBS Commodity Index

Nymex crude is following, and expected to test support between $40 and $45 per barrel.

Crude Oil

Short-term prospects may appear reasonable, but the long-term outlook is decidedly negative.

In the short run, the market is a voting machine but in the long run, it is a weighing machine.

~ Benjamin Graham

“Stocks rebound but sentiment soft”

From Bob Doll at Nuveen Investments. His weekly top themes:

1. We think the odds of a U.S. recession are low, but we also believe growth will remain soft for a couple of quarters. U.S. growth may bottom in the first half of 2019 following a relatively disappointing fourth quarter and the recent government shutdown. We expect growth will improve in the second half of the year.

Agreed, though growth is likely to remain soft for an extended period. The Philadelphia Fed Leading Index is easing but remains healthy at above 1.0% (December 2018).

Leading Index

2. Inflation remains low, but upward pressure is mounting. With unemployment under 4% and average hourly earnings rising to an annual 3.6% level, we may start to see prices rise. So far, better productivity growth has kept the lid on prices, but this trend bears watching.

Agreed. Average hourly earnings are rising and inflation may follow.

Hourly Earnings Growth

3. Trade issues remain a wildcard. The U.S./China trade dispute appears to be making progress, but the timeline is slipping and significant disagreement remains over tariff levels and intellectual property protections.

This is the dominant issue facing global markets. Call me skeptical but I don’t see a happy resolution. There is too much at stake for both parties. Expect a drawn out conflict over the next two decades.

4. We do not expect Brexit to cause widespread market issues. We think the risk of a hard Brexit is low, since no one wants to see that outcome. Some sort of soft separation or even a Brexit vote redo appears more likely.

Agreed. Hard Brexit is unlikely. Soft separation is likely, while no Brexit is most unlikely.

5. The health care sector may remain under pressure due to political rhetoric. Health care stocks in general, and managed care companies in particular, have struggled in light of talk about ending private health care coverage. We think Congress lacks the votes to enact such legislation. But this issue, as well as drug pricing policies, are likely to remain at the center of the political dialogue through the 2020 elections.

Health care is a political football and may take longer to resolve than the trade war with China.

6. Downward earnings revisions may present the largest risk for stocks. As recently as September 30, expectations for first quarter earnings growth were +7%. That slipped to +4% by January 1 and has since fallen to -3%.

A sharp fall in earnings would most likely spring from a steep rise in interest rates if the Fed had to combat rising inflation. That doesn’t seem imminent despite rising average hourly earnings. The Fed is maintaining money supply growth at close to 5.0%, around the same level as nominal GDP, keeping a lid on inflationary pressures.

Money Supply & Nominal GDP growth

7. Equity returns may be modest over the next decade compared to the last. Since the bull market began 10 years ago, U.S. stocks have appreciated over 400%. It’s nearly impossible to imagine that pace will be met again, but we feel confident that stocks will outperform Treasuries and cash over the next 10 years.

Expect modest returns on stocks, low interest rates, and low returns on bonds and cash.

Robust US employment but global bear market warning

The US economy remains robust, with hours worked (non-farm) ticking up 2.2% in January, despite the government shutdown. Real GDP growth is expected to follow a similar path.

Real GDP and Hours Worked

Average hourly earnings growth increased to 3.4% p.a. for production and non-supervisory employees (3.2% for all employees). The Fed has limited wiggle room to hold back on further rate hikes if underlying inflationary pressures continue to rise.

Average Wage Rate Growth

History shows that the Fed lifts short-term interest rates more in response to hourly wage rates than core CPI.

Average Wage Rate Growth, Core CPI and 3-Month T-Bills

The Leading Index from the Philadelphia Fed ticked down below 1% (0.98%) for November 2018. While not yet cause for concern, it does warn that the economy is slowing. Further falls, to below 0.5%, would warn of a recession.

Leading Index

Markets are anticipating a slow-down, triggered by falling demand in China more than in the US.

S&P 500 volatility remains high and a large (Twiggs Volatility 21-day) trough above 1.0% (not zero as stated in last week’s newsletter) on the current  rally would signal a bear market. Retreat below 2600 would strengthen the signal.

S&P 500

Crude prices have plummeted, anticipatiing falling global (mainly Chinese) demand. Another test of primary support at $42/barrel is likely.

Light Crude

Dow Jones-UBS Commodity Index breached primary support at 79, signaling a primary decline with a target of 70.

DJ-UBS Commodity Index

China’s Shanghai Composite Index is in a bear market. Respect of resistance at 2700 would confirm.

Shanghai Composite Index

Bearish divergence on India’s Nifty also warns of selling pressure. Retreat below 10,000 would complete a classic head-and-shoulders top but don’t anticipate the signal.

Nifty Index

DJ Stoxx Euro 600 rallied but is likely to respect resistance at 365/370, confirming a bear market.

DJ Stoxx Euro 600 Index

The UK’s Footsie also rallied but is likely to respect resistance at 7000. Declining Trend Index peaks indicate selling pressure, warning of a bear market.

FTSE 100 Index

My conclusion is the same as last week. This is a bear market. Recovery hinges on an unlikely resolution of the US-China ‘trade dispute’.

Concessions to adversaries only end in self reproach, and the more strictly they are avoided the greater will be the chance of security.

~ Thucydides (460 – 400 B.C.)

It’s a funny kind of bear market

The US economy continues to show signs of robust good health.

Total hours worked are rising, signaling healthy real GDP growth.

Real GDP and Total Hours Worked

Growth in average hourly wage rates is rising, reflecting a tighter labor market. Underlying inflationary pressures may be rising but the Fed seems comfortable that this is containable.

Average Hourly Wage Rates

The Leading Index from the Philadelphia Fed maintains a healthy margin above 1.0% (below 1% is normally a signal that the economy is slowing).

Leading Index

But market volatility remains high, with S&P 500 Volatility (21-day) above 2.0%. A trough above 1% on the next multi-week rally would confirm a bear market — as would an index retracement that respects 2600.

S&P 500

The Nasdaq 100 is undergoing a similar retracement with resistance at 6500.

Nasdaq 100

The primary disturbance is the trade confrontation between the US and China. There is plenty of positive spin from both sides but I expect trade negotiations to drag out over several years — if they are successful. If not, even longer.

I keep a close watch on the big five tech stocks as a barometer of how the broader market will be affected. So far the results are mixed.

Apple is most vulnerable, with roughly 25% of projected sales to China. Recent downward revision of their sales outlook warns that Chinese retail sales are falling. AAPL is testing its primary support level at 150.

ASX 200

Facebook and Alphabet are largely unaffected by a Chinese slowdown, but have separate issues with user privacy. Facebook (FB) is in a primary down-trend.

ASX 200

While Alphabet (GOOGL) is testing primary support at 1000.

ASX 200

Amazon (AMZN) is similarly isolated from a Chinese slow-down although there may be a secondary impact on suppliers. Primary support at 1300 is likely to hold.

ASX 200

Microsoft (MSFT) is the strongest performer of the five. Their segment reporting does not provide details of exposure to China but it appears to be a small percentage of total sales.

ASX 200

The outlook for stocks is therefore mixed. Be cautious but try to avoid a bearish mindset, where you only see problems and not the opportunities. Even if China does suffer a serious slowdown we can expect massive stimulus similar to 2008 – 2009, so the impact on developing markets and resources markets may be cushioned.

Best wishes for the New Year.

Significant divergence

Market commentators are sifting through the data, looking for reasons to explain the sharp sell-off in stocks over the last two months. But everything they examine is likely to be shaded by their bear-tinted spectacles after the S&P 500 broke primary support at 2550.

S&P 500

The Nasdaq 100 also broke primary support, confirming the bear market.

Nasdaq 100

Of the big five tech stocks, Apple and Google are both testing primary support, threatening to follow Facebook into a primary down-trend. If the two break primary support, that would further strengthen the bear signal.

Big Five tech stocks

Volatility (21-day) is now close to 2% but the key is how volatility behaves on the next multi-week rally. If volatility forms a trough above 1% that would confirm the elevated risk.

S&P 500

Divergence? What Divergence?

Why do I say there is a significant divergence? Look at the fundamentals.

Fedex has just released stats for its most recent quarter, ended November 30. Package volumes are rising, not falling.

Fedex Stats

Supported by a very bullish Freight Transportation Index.

Freight Transportation Index

Consumption is strong, with Services and Non-durable goods rebounding. No sign of a recession here.

Consumption

Light vehicle sales are at a robust annual rate of 17.5 million.

Light Vehicle Sales

Retail sales growth (ex motor vehicles and parts) weakened in the last month but is still in an up-trend.

Retail

Housing starts and authorizations are still climbing.

Housing

Real construction spending (adjusted by CPI) is strong.

Construction

Manufacturers new orders (ex defense and aircraft) have rebounded after a weak 2015 – 2016.

Manufacturers New Orders

Corporate investment is growing at a faster rate than the economy, with rising new capital formation over GDP.

New Capital Formation

The Fed is shrinking its balance sheet which is expected to impact on liquidity. But commercial banks are running down excess reserves on deposit at the Fed at a faster rate, so that Fed assets net of excess reserves (green line) is actually rising. Hardly a drain on liquidity.

Fed Balance Sheet

Market pundits are watching the yield curve with bated breath, waiting for the 10-year to cross below the 2-year yield.

Yield Differential 10-Year minus 2-Year

In the past this has served as a reliable early warning, normally 12 to 24 months ahead of a recession. But the St Louis Fed Financial Stress Index is well below zero, signaling an accommodative financial environment.

Financial Stress Index

Why the mismatch? Fed actions — QE, Operation Twist, and even steps to shrink its balance sheet — have all suppressed long-term interest rates. We need to be wary of taking signals from a distorted yield curve.

Why have stocks reacted?

This is not a Pollyanna outlook. Never argue with the tape — we are clearly in a bear market. So why are stocks diverging from the economy?

The answer is China.

The impact of a trade war with the US would most likely cause a recession in China. Oil prices are already plunging in anticipation of falling demand.

Nymex Light Crude and Brent Crude

Commodities are likely to follow.

DJ UBS Commodities Index

The impact of a Chinese recession would be felt around the globe. Europe has its own problems and could easily follow.

DJ Europe Financial Index

The US is likely to emerge relatively unscathed but Wall Street is going to be exceedingly cautious until some semblance of normality is restored.

I do not suggest selling all your stocks but make sure that there is enough cash in the portfolio to take advantage of opportunities when they arise.