S&P 500 rallies while consumer sentiment falls

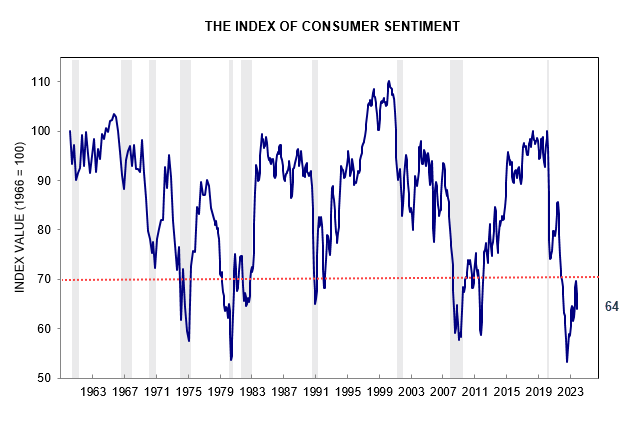
The University of Michigan Index of Consumer Sentiment declined to 61.3 for November. Levels below 70 in the past have signaled a recession.

University of Michigan Consumer Sentiment

Consumer sentiment is in sharp contrast to robust personal consumption expenditures which at 93% of disposable personal income are well above pre-pandemic levels.

Personal Consumption Expenditure/Disposable Personal Income

Mortgage rates above 7.0% failed to dampen discretionary spending, with most households having locked in low fixed mortgage rates over the pandemic.

30-Year Mortgage Rate

Home Sales

Existing home sales declined to an annual rate of 3.8 million, with households are reluctant to give up their cheap fixed-rate mortgages.

Existing Home Sales

New home sales surged as a result, boosting residential construction.

New One-Unit Home Sales

Inflation Expectations

The University of Michigan November survey shows 1-year inflation expectations increased to 4.50%.

University of Michigan Inflation Expectations 1-Year

Five-year expectations increased to 3.2%, with the 3-month moving average of 3.0% well above the Fed’s 2.0% target.

University of Michigan Inflation Expectations 5-Year

Rising inflation expectations mean that the Fed is unlikely to cut interest rates in the foreseeable future.

Interest Rates

10-Year Treasury yields continue to test support at 4.40% after Treasury weighted new issuance towards the front-end of the yield curve — largely funded by money market funds currently invested in repo. Breach of support would offer a target of 4.0% — bearish for the Dollar.

10-Year Treasury Yield

Stocks

The S&P 500 is testing its July high of 4600. Breakout is uncertain but would not signal a bull market unless confirmed by other indices.

S&P 500

The S&P 500 Equal-Weighted Index ($IQX) has recovered less than 60% of its last decline.

S&P 500 Equal-Weighted Index

The Russell 2000 Small Caps ETF (IWM) is even weaker, retracing less than 50% of its last decline, suggesting that investors have little appetite for risk.

Russell 2000 Small Caps Index iShares ETF (IWM)

Dow Jones Transportation Average has also retraced less than 50%. The Trend Index below zero continues to warn of selling pressure.

Dow Jones Transportation Average ($DJT)

Gold and the Dollar

The Dollar Index retraced to test resistance at 104. Respect is likely and breakout below 103 would offer a target of 100.

Dollar Index

The weakening Dollar is bullish for Gold which is testing resistance at $2000 per ounce. Breakout would offer a short-term target of the previous high at $2050.

Spot Gold

Commodities

Dow Jones Industrial Metals Index ($BIM) fell sharply, warning of another test of primary support at 153. Breach would warn of a global recession, especially if mirrored by a similar breach in Copper.

Dow Jones Industrial Metals Index ($BIM)

Copper is testing its descending trendline at 8300. Reversal below primary support at 7800 would warn of a global recession. China consumes about 50% of the world’s copper production, most of it used in construction. So a lot depends on China’s efforts to rescue their ailing property sector.

Copper

The downward spiral of China’s ailing property sector shows no sign of abating despite the government’s rollout of a seemingly endless series of supportive but as yet ineffective measures, with the crisis stretching for over three years…..

The market for Chinese developers’ dollar-denominated bonds has seen a meltdown over the past two years, losing 87% of its value. The rout has wiped out $135.5 billion of value from $154.9 billion of outstanding notes, according to analysis by Debtwire. (Caixin)

Brent crude is testing resistance at $83 per barrel. Respect would warn of another downward leg to $72 and strengthen a bear market warning from Copper and base metals.

Brent Crude

Conclusion

Personal consumption expenditures remain strong despite falling consumer sentiment. The S&P 500 is testing resistance at 4600 but the advance is narrow, with investors avoiding risk in the broader market.

The Dollar weakened on the back of falling long-term Treasury yields, boosting demand for Gold which is testing resistance at $2000 per ounce. Breakout would offer a short-term target of $2050.

Copper and base metals are expected to again test primary support as doubts remain over China’s ailing property sector. Breach of support would warn of a global recession.

Inflation expectations remain persistent, with five-year expectations at 3.0% in the November University of Michigan consumer survey, well above the Fed’s target of 2.0%. The likelihood of rate cuts in early 2024 is remote unless a major collapse in financial markets forces the Fed’s hand.

Acknowledgements

Macrobusiness: China’s property black hole sucks in the CCP.

Moody’s negative outlook and falling consumer sentiment

Ten-year Treasury yields continue to respect support at 4.50%. We expect another test of resistance at 5.0%.

10-Year Treasury Yield

Moody’s kept their AAA rating for the US government but changed their outlook from stable to negative. The reasons cited  — large deficits and a polarized ineffective Congress — are strong arguments for higher Treasury yields:

Moody's Rating

Japan has also broken above 150 yen to the Dollar, increasing pressure on the BoJ to relax their cap on long-term JGB yields. Any move to relax yield curve control would be likely to cause an outflow from US Treasuries and the Dollar, driving down prices.

USDJPY

Inflation

Inflation expectations are rising, with University of Michigan 1-year expectations jumping to 4.4% — and the 3-month moving average to 3.9%.

University of Michigan Inflation expectations 1-Year

Five-year expectations are also rising, reaching 3.2% in October, with the 3-month moving average at 3.0%.

University of Michigan Inflation expectations 5-Year

Higher inflation expectations add to upward pressure on long-term yields.

Financial Conditions

Financial conditions remain loose — despite the strong rise in long-term yields — with the spread between Baa corporate bonds and the equivalent Treasury yield at a low 1.84%.
Moody's Baa Corporate Bond Spreads

Economic Outlook

Low consumer sentiment, with the University of Michigan Index at 64, continues to warn of a recession.
University of Michigan Consumer Sentiment

Heavy truck sales — a reliable leading indicator — are falling steeply. A fall below 35,000 units would be cause for concern.

Heavy Truck Sales

Stocks

The S&P 500 ended the week stronger, with a bullish candle testing resistance at 4400.

S&P 500

Small caps continue to warn of weakness, however, with the Russell 2000 iShares ETF (IWM) likely to test primary support at 162. Trend Index peaks below zero warn of strong selling pressure. Small caps tend to outperform large caps by a wide margin in the first phase of a bull market — clearly not the case here.

Russell 2000 Small Caps iShares ETF (IWM)

Global Economy

Copper is retracing for another test of primary support at $7800 per metric ton. Breach would warn of a global recession.

Copper

Gold

Gold broke support at $1900 per ounce, indicating a test of $1900. Rising long-term interest rates are undermining investor demand for Gold.

Spot Gold

But Gold is supported by strong central bank purchases, led by China.

Central Bank Gold Purchases & Sales

Australia

The ASX 200 retreated below 7000 on Friday but a bullish close on the S&P 500 should see retracement to test resistance. Declining Trend index peaks, however, warn of rising selling pressure.

ASX 200

Conclusion

We expect upward pressure on long-term Treasury yields to continue, boosted by Moody’s negative outlook for the US, a weakening Japanese Yen and rising inflation expectations.

Declining heavy truck sales and weak consumer sentiment are bearish for the economy. The S&P 500 remains bullish but small caps are more bearish, warning that this is not a broad-based recovery.

Copper breach of $7800 per metric ton would warn of a global recession.

We remain overweight cash, money market funds, short-duration term deposits and financial securities (up to 12 months), defensive stocks, critical materials and gold.

Acknowledgements

Dr Lacy Hunt: The impending recession

Not the best interviewer but you always get your money’s worth from Dr Lacy Hunt, former chief economist at the Dallas Fed.

The highlights:

  • Dr Hunt warns of a hard landing.
  • Recent GDP gains are led by consumer spending (+4%) but real disposable income declined (-1%). Personal saving depressed at 3.4%, compared to the GFC low of 2.4%.
  • UOM consumer sentiment is below level of previous recessions.
  • A sharp surge in the economy often occurs just before recession.
  • Dollar is too strong for global stability. It will fall as US goes into recession but then stabilize as the impact flows through to rest of the world.
  • Three signs of weakness:
    • Negative net national saving has never occurred before in a period where GDP is rising (economy is weaker than we think).
    • Bank credit is already contracting. This normally only occurs when the economy is already in recession.
    • Inflation is likewise falling before the recession.

Debt reduction, buybacks and S&P 500 P/E multiples

There is a rising trend — especially in the telecommunications, utilities, and REITs sectors — of selling off non-core assets and using the proceeds to reduce debt. Rising long-term interest rates are likely to accelerate this trend.

Debt reduction reduces funds available for stock buybacks. This chart from S&P Dow Jones Indices shows buybacks on the S&P 500 have been declining since Q2 of last year.

S&P 500 Buybacks

Without buybacks, S&P 500 earnings growth is expected to follow declining year-on-year sales growth, removing the justification for high earnings multiples.

S&P 500 Sales Growth

Price-earnings multiple for the S&P 500 is expected to decline towards its 50-year average of 16.4.

S&P 500 Price/Highest Trailing Earnings

Conclusion

Debt reduction is likely to accelerate the decline of stock buybacks, eroding support for elevated price-earnings multiples.

Declining sales growth is likely to reduce earnings growth and further erode the justification for high earnings multiples.

The price-earnings multiple for the S&P 500 is expected to decline towards its 50-year average of 16.4 (based on highest trailing earnings).

Acknowledgements

Stan Druckenmiller’s macro outlook

“….We need to make an adjustment fundamentally and price wise. And if you look at the market, in the non-QE world, free world, 15 times earnings was about right. We’re at 20 times earnings. I don’t know what we’re doing 20 times earnings. It’s hard for me to get excited about the long side of the overall market with the market, say, 20% above its normal valuation. When you have a federal fiscal recklessness problem, you have supply chain problems, you have the worst geopolitical situation I’ve seen in my lifetime.

’78, ’79 was bad. But I mean, for the first time, it’s a very low probability, but you gotta put the potential outcome of World War on the table. Not exactly an environment that excites me about paying 20 to 30%, above the multiple for equity prices. The next six months, who knows? And we’re certainly washed out to some extent.”

Acknowledgements

Rising long-term rates could spoil the party

Real GDP for the September quarter reflects an annual growth rate of 2.9% for the US, well below the Atlanta Fed GDPNow estimate of 5.4%. Growth in weekly hours worked declined to 1.5% for the 12 months ended September, indicating that GDP is likely to slow further in the fourth quarter.

Real GDP & Estimated Total Weekly Hours

New Orders

Manufacturers’ new orders for durable goods, adjusted for inflation, shows signs of strengthening.

Manufacturers' New Orders: Durable Goods

Transport

Transport indicators show a long-term down-trend but truck tonnage has grown since May 2023.

Truck Tonnage

Container (intermodal) rail freight likewise grew for several months but then turned down in August..

Rail Freight

Growth in weekly payrolls of transport and warehousing employees slowed to an annual rate of 3.6% in September but remains positive.

Transport & Warehousing Weekly Payrolls

Consumer Cyclical

Light vehicle sales continue to trend higher, suggesting consumer confidence.

Light Vehicle Sales

Housing

New housing starts (purple) have been trending lower since their peak in 2022 but new permits (green) are now strengthening.

Housing Starts & Permits

New single family houses sold are trending higher.

New Home Sales

Despite a steep rise in mortgage rates. In a strange twist, higher rates have reduced the turnover of existing homes on the market, with owners reluctant to give up their low fixed rate mortgages. Low supply of existing homes has boosted sales of new homes, lifting employment in residential construction.

30-Year Mortgage Rate

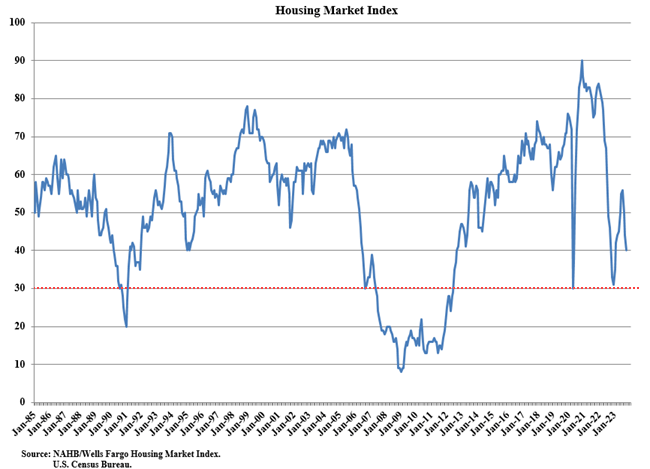
The National Association of Home Builders Housing Market Index (HMI), however, reflects falling sentiment — likely to be followed by declining new home sales and housing starts.

NAHB/Wells Fargo Housing Market Index

HMI is a weighted average of three separate component indices. A monthly survey of NAHB members asks respondents to rate market conditions for the sale of new homes at the present time; sales in the next six months; and the traffic of prospective buyers. (NAHB)

Financial Markets

The ratio of bank loans and leases to GDP declined to 0.44 in the third quarter but remains elevated compared to levels prior to 2000.

Bank Loans & Leases

The cause of ballooning debt is not hard to find, with negative real interest rates for large parts of the past two decades.

Real Fed Funds Rate

Now real rates are again positive and money supply is contracting relative to GDP, the days of easy credit are at an end. A significant contraction of credit is likely unless the Fed intervenes, either by cutting rates or expanding its balance sheet to inject more liquidity into the system.

M2 Money Supply/GDP

Commercial banks continued to raise lending standards in Q3, making credit less accessible.

Bank Lending Standards

Conclusion

This is not a normal market cycle and investors need to be prepared for sudden shifts in financial markets.

The US economy is slowing but cyclical elements like light vehicle sales and new home sales are holding up well.

The rise in long-term Treasury yields, however, is likely to cause a sharp credit contraction if the Fed does not intervene by cutting rates or expanding its balance sheet (QE).

10-Year Treasury Yields

The Fed is reluctant to intervene because this would undermine their efforts to curb inflation. But they may be forced to if there is a credit event that unsettles financial markets.

Moody's Baa Corporate Bond Yield minus 10-Year Treasury Yield

Fed intervention is unlikely without a steep rise in credit spreads. But would be especially bullish for Gold.

Strong US retail activity unlikely to last

Real retail sales remain strong, holding above the pre-pandemic trend (dotted line) in September.

Real Retail Sales

Supported by a strong jobs market, with low unemployment.

Unemployment Rate

The labor market remains tight, with employers holding on to staff — cutting weekly hours rather than resorting to layoffs.

Average Weekly Hours Worked

The consumer sentiment trough in June 2022 coincided with a peak in gasoline prices. Sentiment has been rising over the past 12 months but this could be derailed by a spike in gas prices.

University of Michigan Consumer Sentiment & Gasoline Prices

The up-trend in light vehicle sales reflects growing consumer confidence.

Light Vehicle Sales

The NAHB homebuilder sentiment index (blue below) is falling sharply, however, warning that the recent recovery in new building permits (red) is about to reverse. Residential housing is a major cyclical employer and a collapse of building activity would warn that recession is imminent.

NAHB Sentiment Index

Industry & Transport

Industry indicators show gradually slowing activity but no alarming signs yet. CSBS Community Bank Sentiment index indicates slightly improved business conditions in Q3.

CSBS Community Banks Index - Business Sentiment

Investment in heavy trucks — a useful leading indicator — remains strong.

Heavy Truck Sales

Intermodal rail freight traffic — mainly containers — declined in August after a four-month rally. But the longer-term trend is down.

Rail Freight

Truck tonnage increased in August for the fifth month but earlier breach of the long-term up-trend (green) warns of weakness ahead.

Truck Tonnage

Manufacturers new orders for capital goods, adjusted by PPI, indicates declining activity which is likely to weigh on future growth.

Manufacturing Orders: Capital Goods

Conclusion

The tight labor market supports strong consumer spending but high mortgage rates are likely to slow homebuilding activity causing a rise in cyclical employment. A sharp increase in crude oil could also cause higher gasoline prices which would damage consumer sentiment.

Industry and transport activity is gradually weakening but has not yet caused alarm.

“How did you go bankrupt?” Bill asked.

“Two ways,” Mike said. “Gradually, then suddenly.”

~ Ernest Hemingway: The Sun Also Rises

Copper breaks support while crude gets hammered

Copper broke support at $7900/tonne, signaling a primary decline with a target of its 2022 low at $7000. The primary down-trend warns of a global economic contraction.

Copper

The bear signal has yet to be confirmed by the broader-based Dow Jones Industrial Metals Index ($BIM) which is testing primary support at 155.

DJ Industrial Metals Index ($BIM)

Crude oil

Crude fell sharply this week, after a 3-month rally.

Nymex Light Crude

The fall was spurred by an early build of gasoline stocks ahead of winter, raising concerns of declining demand.

Gasoline inventories added a substantial 6.5 million barrels for the week to September 29, compared with a build of 1 million barrels for the previous week. Gasoline inventories are now 1% above the five-year average for this time of year….. production averaged 8.8 million barrels daily last week, which compared with 9.1 million barrels daily for the prior week. (oilprice.com)

Gasoline Stocks

Crude inventories have stabilized after a sharp decline during the release of strategic petroleum reserves (SPR).

EIA Crude Inventory

Releases from the SPR stopped in July — which coincides with the start of the recent crude rally. It will be interesting to see next week if a dip in this week’s SPR contributed to weak crude prices.

Strategic Petroleum Reserves (SPR)

Stocks & Bonds

The 10-year Treasury yield recovered to 4.78% on Friday.

10-Year Treasury Yield

Rising yields are driven by:

  • a large fiscal deficit of close to $2T;
  • commercial banks reducing Treasury holdings; and
  • the Bank of Japan allowing a limited rise in bond yields which could cause an outflow from USTs.

Bank of Japan - YCC

The S&P 500 rallied on the back of a strong labor report.

S&P 500

The S&P 500 Equal-Weighted Index test of primary support at 5600 is, however, likely to continue.

S&P 500 Equal-Weighted Index

Expect another Russell 2000 small caps ETF (IWM) test of primary support at 170 as well.

Russell 2000 Small Caps ETF (IWM)

Labor Market

The BLS report for September, with job gains of 336K, reflects a robust economy and strong labor market.

Job Gains

Average hourly earnings growth slowed to 0.207% in September, or 2.5% annualized. Manufacturing wages reflect higher growth — 4.0% annualized — but that is a small slice of the economy compared to services.

Average Hourly Earnings

Average weekly hours worked — a leading indicator — remains stable at 34.4 hours/week.

Average Weekly Hours

Unemployment remained steady at 6.36 million, while job openings jumped in August, maintaining a sizable shortage.

Job Openings & Unemployment

Real GDP (blue) is expected to slow in Q3 to 1.5%, matching declining growth in aggregate weekly hours worked (purple).

Real GDP & Hours Worked

Dollar & Gold

The Dollar Index retraced to test new support at 106 but is unlikely to reverse course while Treasury yields are rising.

Dollar Index

Gold is testing primary support at $1800 per ounce, while Trend Index troughs below zero warn of selling pressure. Rising long-term Treasury yields and a strong Dollar are likely to weaken demand for Gold.

Spot Gold

Conclusion

Long-term Treasury yields are expected to rise, fueled by strong supply (fiscal deficits) and weak demand (from foreign investors and commercial banks). The outlook for rate cuts from the Fed is also fading as labor market remains tight.

The sharp drop in crude oil seems an overreaction when the labor market is strong and demand is likely to be robust. Further releases from the strategic petroleum reserve (SPR), a sharp fall in Chinese purchases, or an increase in supply (from Iran or Venezuela) seem unlikely at present.

Falling copper prices warn of a global economic contraction led by China, with Europe likely to follow. Confirmation by Dow Jones Industrial Metals Index ($BIM) breach of primary support at 155 would strengthen the bear signal.

Strong Treasury yields and a strong Dollar are likely to weaken demand for Gold unless there is increased instability, either geopolitical or financial.

A tectonic shift hurts highly-leveraged sectors

The global economy is experiencing a tectonic shift — from a lack of demand (requiring stimulus) to a lack of supply (requiring suppression of demand).

The sharp rise in interest rates is just part of the adjustment to the new reality.

The rise in short-term rates did not have much impact on consumer spending. Personal Consumption is still above pre-pandemic levels relative to disposable personal income, while the savings rate has fallen to almost half of pre-pandemic levels.

Personal Consumption/Disposable Personal Income

High prices are the cure for high prices

The bond market and oil markets are now testing the assumption that the economy can cope with high interest rates and pull off a soft landing.

Two key prices — long-term interest rates and crude oil — are rising. This is likely to cause a strong contraction.

Mortgage rates (7.49% for 30-year) are at their highest level in more than 20 years.

30-Year Mortgage Rate

Corporate debt more than doubled relative to GDP since the 1980s, as corporations took advantage of cheap debt. When they roll over borrowings, they are now confronted with a sharp increase in debt servicing costs, forcing them to de-leverage.

Non-Financial Corporate Debt/GDP

Telecommunications Sector

The impact is clearly visible on sectors with high debt levels — like telecommunications, utilities, and real estate. The chart below compares performance of major telecommunications companies.

Telecommunications Sector

Only Orange (FNCTF), the French national carrier, has held its value since the start of 2022. Some, like Telstra (TLS) and Vodafone (VOD), succeeded in reducing debt by selling key assets (e.g. mobile phone towers) into a separate infrastructure trust. Spanish carrier Telefonica (TEFOF) has also done reasonably well, selling off some international interests. Many — notably Verizon (VZ), AT&T (T), Vodafone (VOD), and BT Group (BT) — have lost 40% of value in less than two years. Belgian carrier Proxima (BGAOF) gets the wooden spoon with a 60% loss.

Further adjustment will be necessary as the recent rise in long-term interest rates forces corporations to rein in capital expenditure and shed non-core assets in order to reduce debt exposure. That in turn impacts on equipment manufacturers like Ericsson (ERIC) and Nokia (NOK).

Ericsson (ERIC) and Nokia (NOK)

Conclusion

Rising long-term interest rates and crude oil prices are likely to cause a global economic contraction.

Sectors with high debt levels — like telecommunications, utilities, and real estate — will be forced to restructure due to rising interest rates. This is likely to have a domino effect on other sectors of the economy.

Acknowledgements