Bull Markets & Irrational Exuberance

Bob Doll from Nuveen Investments is more bullish on stocks than I am but sets out his thoughts on what could cause the current run to end:

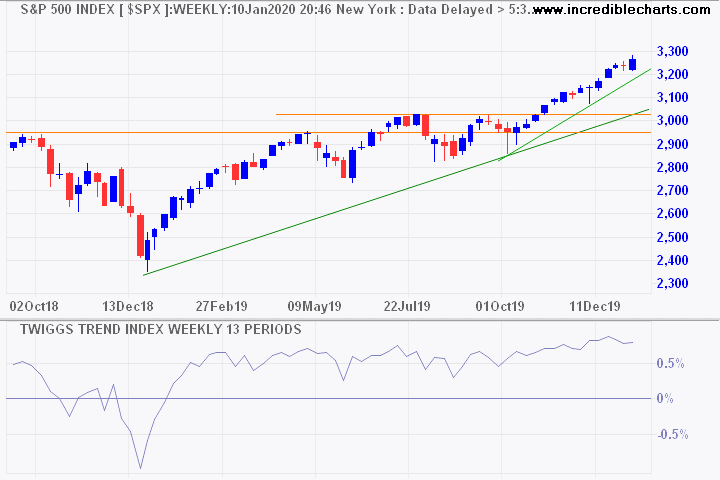
“Stock valuations are starting to look full, and technical factors are beginning to appear stretched. As stock prices have risen since last summer, bond yields have crept higher. Should this trend persist, it could eventually cause a headwind for stocks. Credit spreads are signaling some risks, as non-energy high yield corporate bond spreads have dropped to multi-decade lows.

As such, we think stocks may be due for a near-term correction or consolidation phase. Nevertheless, we expect any such phase to be mild and brief as long as monetary conditions remain accommodative and economic and earnings growth holds up. In other words, although we see some near-term risks, we don’t think this current bull market is ending.

That raises the question of what might eventually cause the current cycle to end. We see three possibilities. First, recession prospects could increase significantly. We see little chance of that happening any time soon, given solid economic fundamentals. Second, a political disruption like a resurgence in trade protectionism could occur. We also don’t think that is likely to happen, especially in an election year. Third, bond yields and interest rates could move higher as economic conditions improve, creating problems for stocks. This one seems like a higher probability, and we’ll keep an eye on it.”

Economy

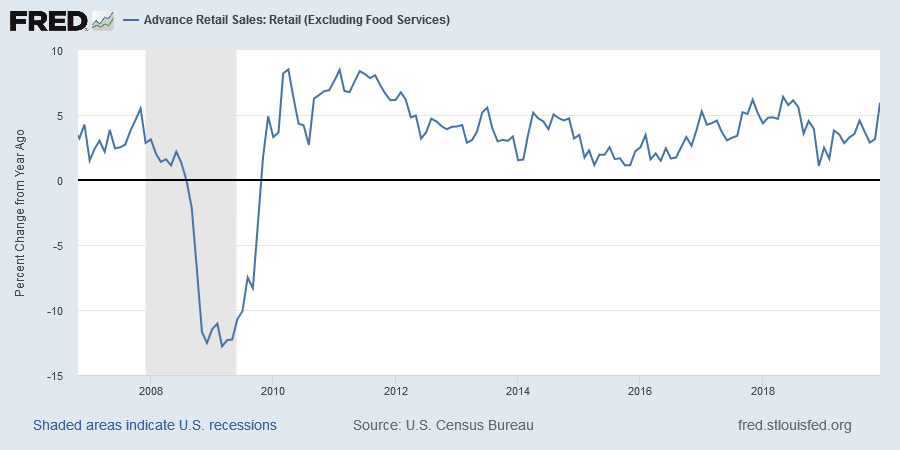
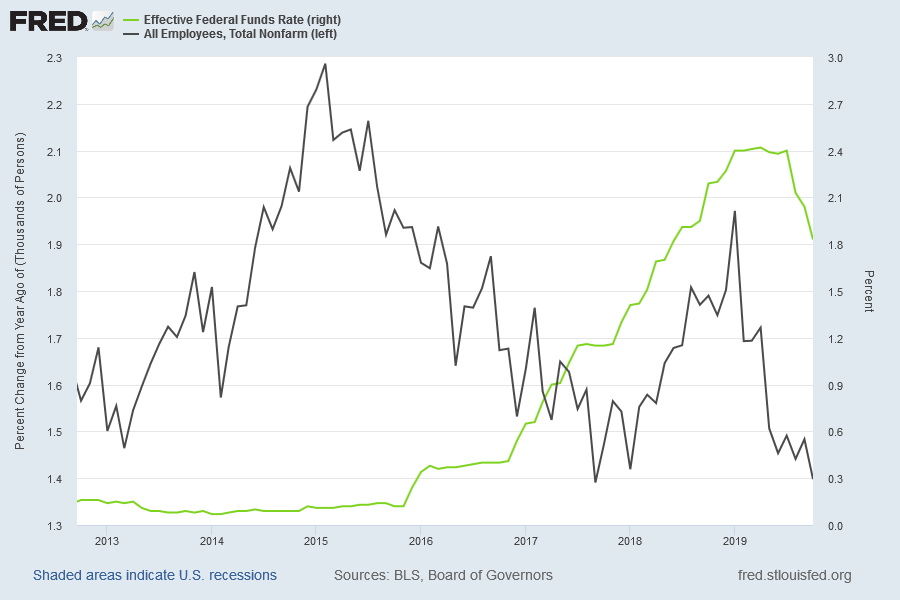
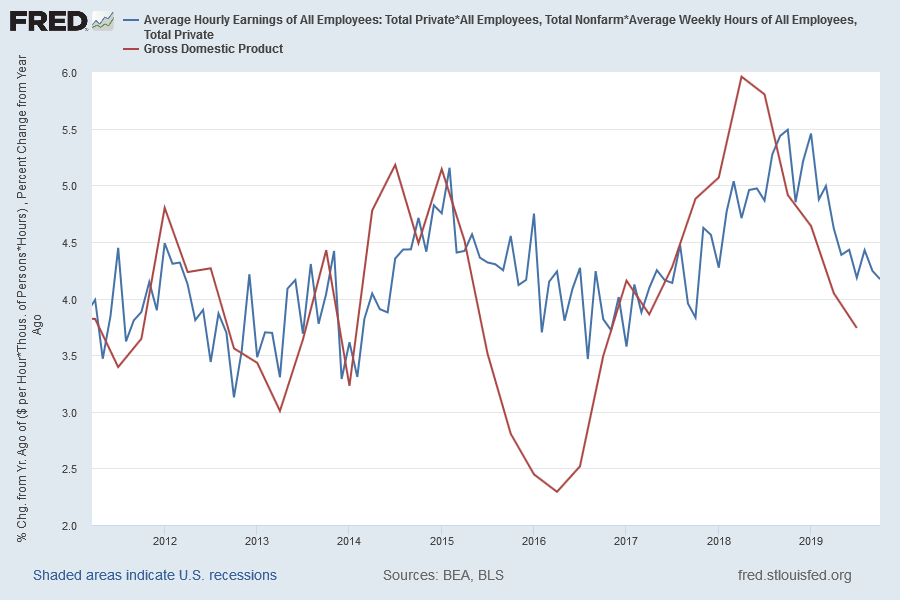
The upsurge in retail sales and housing starts may have strengthened Bob’s view of the economy but manufacturing is in a slump and slowing employment growth could hurt consumption. The inverted yield curve is a long-term indicator and I don’t yet see any indicators confirming an imminent collapse.

Treasury 10 Year-3 Month Yield Differential

I rate economic risk as medium at present.

Political Disruption

US-China trade risks have eased but I continue to rate political disruption as a risk. This could come from any of a number of sources. US-Iran is not over, the Iranians are simply biding their time. Putin’s attempted constitutional coup in Russia. China-Taiwan. Libya. North Korea. Brexit is not yet over. Huawei and 5G are likely to disrupt relations between China, the US and European allies, with China threatening German automakers. Europe also continues to wrestle with fallout from the euro monetary union, a system that is likely to eventually fail despite widespread political support. Impeachment of Trump may not succeed because of the Republican majority in the senate but could produce even more erratic behavior with an eye on the upcoming election. Who can we bomb next to win more votes?

Bonds & Interest Rates

I don’t see inflation as a major threat — oil prices are low and wages growth is slowing — and the Fed is unlikely to raise interest rates ahead of the November election. Bond yields may rise if China buys less Treasuries, allowing the Yuan to strengthen against the Dollar, but the Fed is likely to plug any hole in demand by further expanding its balance sheet.

Market Risk: Irrational Exuberance

The market is running on more stimulants than a Russian weight-lifter. Unemployment is near record lows but Treasury is still running trillion dollar deficits.

Federal Deficit & Unemployment

While the Fed is cutting interest rates.

Fed Funds Rate & Unemployment

And again expanding its balance sheet. More than twelve years after the GFC. The blue line reflects total assets on the Fed’s balance sheet, mainly Treasuries and MBS, while the orange line (right-hand scale) shows how shrinking excess reserves on deposit at the Fed have helped to create a $2 trillion surge in liquidity in financial markets since 2009. Even when the Fed was supposedly tightening, with a shrinking balance sheet, in 2018 to 2019.

Fed Totals Assets & Net of Excess Reserves on Deposit

The triple boost has lifted stock valuations to precarious highs. The chart below compares stock market capitalization to profits after tax over the past 60 years.

Market Cap/Profits After Tax

Ratios above 15 flag that stocks are over-priced and likely to correct. Peaks in 1987 and 2007, shortly before the GFC, are typical of an over-heated market. The Dotcom bubble reflected “irrational exuberance” — a phrase coined by then Fed Chairman Alan Greenspan — and I believe we are entering a second such era.

Recovery of the economy under President Trump is no economic miracle, it is simply the triumph of monetary and fiscal stimulus over rational judgement. Trump knows that he has to keep the party going until November to win the upcoming election, so expect further excess. Whether he succeeds or not is unsure but one thing is certain: the longer the party goes on, the bigger the hangover.

William McChesney Martin Jr., the longest-serving Fed Chairman (1951 to 1970), famously described the role of the Fed as “to take away the punch bowl just as the party gets going.” Unfortunately Jerome Powell seems to have been sufficiently cowed by Trump’s threats (to replace him) and failed to follow that precedent. We are all likely to suffer the consequences.

US Stocks: Bull or Bear?

I have read several commentators proclaiming that the crisis is over and the stock market and US economy are back on track for solid growth. Let’s examine some of the evidence.

The Yield Curve (Bearish)

While the US yield curve has uninverted in the past and yet a recession has still come along, the uninversion seen in recent months coming after such a shallow and short-lived inversion provides confidence that the inversion seen last year gave a false signal…. (Shane Oliver at AMP)

Treasury 10 Year-3 Month Yield Differential

Yield curve inversions seldom last long. For one simple reason: the Fed fires up the printing press to reduce short-term interest rates and boost the economy. The yield curve uninverted before the last three recessions and this time looks no different.

Consumer Confidence (Bullish)

Retail sales kicked up in December, a sign of growing consumer confidence.

Retail excluding Auto

Auto sales are still flat but housing starts have also jumped.

Housing Starts & Permits

Economic Activity (Bearish)

When it comes to economic activity, Cass freight shipments are falling.

Cass Index

Rail freight indicators also point to declining activity levels.

Rail Freight

Employment (Neutral)

Leading employment indicators, such as temporary jobs and job openings, warn that labor market growth is slowing.

Temporary Jobs

Job Openings

But overall payroll growth, albeit subdued is still stable, with the 3-month TMO of non-farm payroll growth respecting the 0.5% amber warning level.

Payroll TMO

Valuations (Bearish)

Last week we compared market cap to profits before tax. This week, we compare to profits after tax. Recent levels above 20 have only previously been exceeded, in the past 60 years, during the Dotcom bubble.

Market Cap/Corporate Profits after Tax

Dallas Fed president Robert Kaplan conceded that expansion of the Fed balance sheet is helping to lift asset prices.

Commenting on the Fed’s massive liquidity response to the repo crisis, Kaplan said that “my own view is it’s having some effect on risk assets……It’s a derivative of QE when we buy bills and we inject more liquidity; it affects all risk assets. This is why I say growth in the balance sheet is not free. There is a cost to it. And we need to be very disciplined about it and sensitive to it.”

This is a clear warning to investors to stay on the defensive. We maintain our view that stocks are over-valued and will remain under-weight equities (over-weight cash) until normal earnings multiples are restored.

Warren Buffett is not infallible but the level of cash on Berkshire’s balance sheet seems to indicate a similar view regarding stock valuations.

Berkshire Hathaway Cash Holdings

S&P 500: Stocks lift but jobs and profits a red flag

The S&P 500 has advanced steadily since breaking resistance at 3000.

S&P 500

Lifted by Fed liquidity injections in the repo market.

S&P 500 and Fed Assets

Optimism over improved global trade has spread, with the DJ Euro Stoxx 600 breaking resistance at 400.

DJ Euro Stoxx 600

South Korea’s KOSPI completed a double-bottom reversal to signal an up-trend.

KOSPI

And India’s Nifty Index broke resistance at 12,000.

Nifty

Commodity prices remain low but rising Trend Index troughs on the DJ-UBS Commodity Index suggest that a bottom is forming.

DJ-UBS Commodity Index

Crude spiked up with rising US-Iran tensions but is expected to re-test support at 50 as supply threats fade.

Nymex Light Crude

Fedex recovered above primary support at 150, but the outlook for economic activity remains bearish.

Fedex

Falling US wages growth warns of slowing job creation.

Average Hourly Wages

Declining employment growth highlights similar weakness.

Employment Growth

Initial jobless claims, while not alarming, are now starting to rise.

Initial Claims

Growth in weekly hours worked has slowed, with real GDP expected to follow.

Real GDP and Weekly Hours Worked

While GDP growth is slowing, corporate profits (before tax) are also declining as a percentage of GDP.

Corporate profits Before Tax/GDP

Market Capitalization of equities has spiked to a ratio of 20 times Corporate Profits (before tax), an extreme only previously seen in the Dotcom bubble.

Market Cap/Corporate Profits before Tax

The market can remain irrational for longer than you or I can stay solvent, but this is a clear warning to investors to stay on the defensive.

We maintain our view that stocks are over-valued and will remain under-weight equities (over-weight cash) until normal earnings multiples are restored.

Australia: Bearish apart from mining

Household disposable income lifted in response to the recent tax cuts but households remain risk-averse, with consumption still falling and extra income going straight to debt repayment — reflected by a jump in the Saving ratio below.
Australia Household Saving

Housing prices are recovering despite high levels of mortgage stress in the outer suburbs but building approvals for new housing continue to fall. Construction expenditure is likely to follow.

Australia Building Approvals

GDP growth is falling, while corporate profits (% of GDP) remain in the doldrums apart from the mining sector.

Australia Corporate Profits

Low household disposable income and corporate profit growth in turn lead to low business investment (% of GDP).

Australia Business Investment

Low investment leads to low job creation. Job vacancies and job ads both warn of declining employment growth.

Australia Job Ads

Cyclical employment growth is expected to slow in line with the fall in the Leading Indicator over the past year.

Australia Leading Employment Indicator

We maintain a bearish outlook for the Australian economy, though Mining continues to surprise to the upside.

What is causing the current S&P 500 rise and how is it likely to end?

In November 2007, six months after the inverted yield curve (3M-10Y) recovered to a positive slope, bellwether transport stock Fedex broke primary support at 100 to warn of an economic slow-down.

Today, two months after rate cuts restored an inverted yield curve to positive, Fedex again broke primary support, this time at 150. Their CEO observed that the stock market might be booming but the “industrial economy does not reflect any growth at all.”

Fedex

Real GDP growth is slowing, with our latest estimate, based on weekly hours worked, projecting GDP growth of 1.5% for the calendar year.

Real GDP and Weekly Hours Worked

While real corporate profits are declining.

Corporate Profits Before Tax adjusted for Inflation

What is keeping stocks afloat?

First, a flood of new money from the Fed. They expanded their balance sheet by $375 billion since September 2019 and are expected to double that to $750 billion — bringing total Fed holdings to $4.5 trillion by mid-January — to head off an expected liquidity crisis in repo and FX swap markets. The red line below shows expansion of the Fed’s balance sheet, the blue is the S&P 500 index.

S&P 500 and Fed Assets

Second, ultra-low bond yields have starved investment markets of yield, boosting earnings multiples. P/E of historic earnings rose to 22.01 at the end of the September quarter and is projected to reach 22.82 in the December quarter (based on current S&P earnings estimates).

S&P 500 P/E (maximum of previous earnings)

That is significantly higher than the peak earnings multiples achieved before previous crashes — 18.86 of October 1929 and 18.69 in October 1987 — and is only surpassed by the massive spike of the Dotcom bubble.

How could this end?

First, if the Fed withdraws (or makes any move to withdraw) the $750 billion temporary liquidity injection, intended to tide financial markets over the calendar year-end, I expect that the market would crash within minutes. They are unlikely to be that stupid but we should recognize that the funding is permanent, not temporary.

Second, if bond yields rise, P/E multiples are likely to fall. 10-Year breakout above 2.0% would signal an extended rise in yields.

10-Year Treasury Yields

China has slowed its accumulation of US Dollar reserves, allowing the Yuan to strengthen against the Dollar (or at least weaken at a slower rate). Reduced Treasury purchases are causing yields to rise. The chart below shows in recent months how Treasury yields have tracked the Yuan/US Dollar (CNYUSD) exchange rate.

CNYUSD

Accumulation of USD foreign exchange reserves (by China) is likely to be a central tenet of US trade deal negotiations — as they were with Japan in the 1985 Plaza Accord. Expect upward pressure on Treasury yields as growth in Chinese holdings slows and possibly even declines.

Third, and most importantly, are actual earnings. With 98.6% of S&P 500 companies having reported, earnings for the September quarter are 6.5% below the same quarter last year. Poor Fedex results and low economic growth warn of further poor earnings ahead.

We maintain our view that stocks are over-priced and that investors need to exercise caution. We are over-weight cash and under-weight equities and will hold this position until normal P/E multiples are restored.

S&P 500 recovers but employment gains sluggish

Short retracement on the S&P 500 that respected support at 3000 strengthens the bull signal. Further gains are expected in the short- to medium-term.

S&P 500

Corporate profits before tax continue to decline after adjusting for inflation, exposing the vulnerability of high earnings multiples.

S&P 500

Hours worked (non-farm payroll x average weekly hours) for November also point to low annual GDP growth of around 1.5% after inflation.

Real GDP and Hours Worked

Employment growth for the 12 months to November came in at a similar 1.48%.

Employment Growth & Fed Funds Rate

Not enough to justify a P/E multiple of 23.25.

Average hourly earnings growth is increasing, especially for production & non-supervisory employees (3.65% for 12 months to November), but in the present environment the Fed seems unconcerned about inflationary pressures.

Average Hourly Earnings

Patience

Patience is required. We have had a weak S&P 500 retracement confirm the breakout but there is minimal up-turn in November employment indicators to support the bull signal. Market risk is elevated and investors should exercise caution.

“The world has a way of undermining complex plans. This is particularly true in fast moving environments. A fast moving environment can evolve more quickly than a complex plan can be adapted to it….”
~ Carl Von Clausewitz, Vom Kriege (On War) (1780-1831)

Stretching credulity

Fed Chairman, Jay Powell says the US economy is strong.

But they have cut interest rates three times this year.

And it’s all hands to the pump below decks. The Fed expanded their balance sheet by $288 billion since September and broad money (MZM plus time deposits) growth has almost doubled to $1.4 trillion this year.

Fed Assets and Broad Money Growth

Donald Trump says that a Phase 1 trade deal has been settled with China.

But the two parties can’t seem to agree on whether China’s agricultural purchases are part of the deal (China is reluctant to commit to a $ amount).

Nor can they recall whether rolling back tariffs was part of the deal. China would like to think so but Trump is now threatening to increase tariffs if a deal isn’t signed.

Fundamentals show that activity is contracting. Industrial production is falling.

Fed Assets and Broad Money Growth

Freight shipments are contracting.

Cass Freight Shipments

And retail sales growth is declining.

Advance Retail Sales

Yet Dow Jones Industrials just broke 28,000 for the first time, while Trend Index troughs above zero show long-term buying pressure.

Dow Jones Industrial Average

Paul Tudor Jones

“Explosive” is the right word.

ASX 200 diverges from fundamentals

Seasonally adjusted labour force estimates show a decline in October 2019:

  • Employment decreased by 19,000 to 12,919,200 people
    (full-time -10,300 and part-time -8,700).
  • Unemployment rate increased by 0.1 pts to 5.3%.
  • Monthly hours worked in all jobs decreased by 2.8 million hours to 1,783.9 million hours.

The leading indicator of employment has been predicting a down-turn in employment for some time, recording its sixteenth consecutive monthly fall in November.

Australia: Leading Employment Indicator

Job advertisements have also declined since late 2018.

Australia: Job Ads & Vacancies

Falling employment has a knock-on effect in other areas of the economy:

According to Tony Weber, chief executive of the FCAI, new vehicles have now seen the nineteenth consecutive month of decreasing sales in the Australian market, with October 2019 sales down 9.1% compared to October 2018.

“Year to date sales of new motor vehicles in 2019 are almost 78,000 units (eight per cent) lower than the same period in 2018…”

Retail sales are also soft:

In volume terms, the seasonally adjusted estimate for the September quarter 2019 fell 0.1%. This follows a 0.1% rise in the June quarter 2019, and a 0.1% fall in the March quarter 2019.

But the ASX 200, seemingly unperturbed, is testing resistance at 6800. Breakout would signal a primary advance with a target of 7200. Breach of support at 6400 seems unlikely but would warn of a decline with a target of 5400.

ASX 200

There are, however, signs of weakness in the largest two sectors.

ASX 300 Banks index penetrated its rising trendline, warning of a correction. Declining peaks on the Trend Index indicate secondary selling pressure. Follow-through of the index below 7600 would strengthen the bear signal.

ASX 300 Banks

A hanging man candlestick warns the ASX 300 Metals & Mining index is likely to again test support at 4100 ( the neckline of a large head-and-shoulders reversal pattern ). A Trend Index peak near zero would indicate continued selling pressure.

ASX 300 Metals & Mining

Iron ore continues its primary decline, since breaking support at 90. Our long-term target is 65.

Iron Ore

We maintain low exposure to Australian equities, with a focus on defensive and contra-cyclical stocks, because of our bearish outlook. But ASX 200 breakout above 6800 would force us to re-examine our outlook.

“A hell of a mess in every direction” – Paul Volcker

The S&P 500 strengthened on Friday, closing at a new high of 3067. Volatility (21-day) crossed below 1%, signaling that risk is easing. Money Flow strengthened; a trough above zero suggests another advance. The medium-term target is 3250.

S&P 500

Dow Jones Industrial Average is weaker, with Money Flow having dipped below zero, but breakout above 27,400 would signal another advance. Target for the advance is 29,400.

DJ Industrial Average

“We’re in a hell of a mess in every direction,” is how Paul Volcker, the former Fed Chairman describes it.

Equities are making new highs, while the Fed cuts interest rates. Donald Trump is effectively dictating monetary policy. This could only end badly.

Unemployment and initial jobless claims are near record lows.

Unemployment and Jobless Claims

Inflationary pressures are moderate, with average wage rates growing between 3.0% and 3.5% (production and non-supervisory employees).

Average Wage Rates

GDP growth is slowing, however, and likely to fall further according to our advance indicator (estimated hours worked).

Real GDP and Estimated Hours Worked

Payroll growth is also slowing. While this has been explained as a result of record low unemployment (new employees may be hard to find) it is likely that rising uncertainty has played a big part.

Payroll Growth and Fed Funds Rate

The 3-month TMO of Non-Farm Payrolls kicked up to 0.58%, above the amber risk level of 0.5%.

Payroll Recession Warnings

With 73.5% of stocks having reported for Q3, the price-earnings ratio remains elevated. A reading above 20 warns that stocks are over-priced, especially because expected earnings growth is low.

P/E of Highest Earnings

If we project nominal GDP growth (including inflation) at 3.5% and buyback yields at 3.0% (Q2: 3.26%) that gives us anticipated growth of 6.5%. Add dividend yield of 2.0% (Q2: 1.96%) and we can expect stocks to yield a total return (dividends plus growth) of 8.5%.

Nominal GDP and Estimated Hours Worked * Average wage rate

But that assumes that current price-earnings multiples are maintained. Any downward revision, from earnings disappointments, would most likely result in a negative return.

Don’t fight the Fed

The Fed is again expanding its balance sheet in response to the recent interest rate spike in repo markets. The effect is the same as QE: the Fed is creating new money (reserve balances) and pumping this into financial markets.

Fed Assets and Excess Reserves on Deposit

Why is this happening?

The US government is issuing record amounts of new Treasuries to cover Donald Trump’s record deficit.

Fed Assets and Excess Reserves on Deposit

According to Luke Gromen: “US govt is on pace to issue $11.3T in USTs on a gross basis in F19.

Gregor Samsa at Macro-Monitor sums up the problem with the following diagram.

Macro Monitor - US Treasury Supply Demand Curves

If supply-demand curves do your head in, the above graph simply says that when you suppress interest rates, there will be a surplus of Treasuries. The yield is less attractive and demand from investors will fall.

Not only do we not have enough domestic buyers, foreign (Chinese?) purchases of US Treasuries are drying up. Primary dealers are required to take up the shortfall on any new issues. The recent price spike tells us they don’t want them.

10-Year Treasury Yields

So it’s all hands to the pump at the Fed. We are likely to see further balance sheet expansion in the months ahead, driving down Treasury yields and the Dollar.

And lifting equities.

The flush of new money is likely to suppress volatility.

S&P 500

And drive equities even further out along the risk curve. Breakout above 3025 would signal another advance.

S&P 500

We remain cautious. Stocks are highly-priced compared to earnings.

Corporate profits are falling in real terms.

Real Corporate Profits

And rising personal savings warn that consumption is likely to fall.

Personal Savings

It all depends on how much money the Fed will print.

Fed Assets and Broad Money