Dovish Fed, Dollar falls, Gold climbs

Long-term Treasury yields plunged in response to a dovish Fed meeting which kept rates on hold, with a target range of 5.25% – 5.00%. Ten-year Treasury yields are now testing our target at 4.0%.

10-Year Treasury Yield

Declining inflation and signs of labor market easing moved the FOMC to discard the additional rate hike and increase projected rate cuts to 75 basis points next year. Their dot plot now shows 2024 ending with a target range of 4.5% – 4.75%.

10-Year Treasury Yield

Unemployment is forecast to rise to 4.1%, from 3.8% at the end of 2023, but still close to full employment. PCE inflation is projected to slow from 2.8% at the end of ’23 to 2.4% by the end of ’24, with real GDP growth slowing from 2.6% in 2023 to 1.4% next year.

QT continues unchanged at the rate of $95 billion per month: $60 billion Treasuries and $35 billion MBS.

The S&P 500 closed at 4707, headed for a test of its previous high at 4800. Breakout would signal a primary advance, with a target of 5500.

S&P 500

The equal-weighted S&P 500 ($IQX) also rallied strongly, testing medium-term resistance at 6300, compared to the early 2022 high of 6665.

S&P 500 Equal-Weighted Index

Large caps show plenty of buyer interest but the Russell 2000 small caps ETF lags far behind. Normally small caps lead in the first stage of a bull market, so this warns that investors are more risk-averse than in a typical bull market.

Russell 2000 Small Caps ETF (IWM)

Gold & the Dollar

The Dollar weakened, as no doubt intended. Breach of support at 102.50 would offer a target of 100.

Dollar Index

Gold jumped to $2031 per troy ounce. Recovery above $2000 signals another test of resistance at the earlier close of $2070. Dollar Index breach of support at 102.50 would be likely to push Gold above $2070, confirming the medium-term target of $2250 per ounce.

Spot Gold

Conclusion

The bull-trend in stocks, bonds and Gold continues. Breakout to new highs on the S&P 500 and Gold are likely. But beware that the bullish outlook is built on an unstable foundation, with commodities warning of a global recession and record-high federal debt-to-GDP limiting Fed options if the Treasury market is threatened by large outflows.

Acknowledgements

10-Year Treasury yields rally, Dollar surges

Ten-year Treasury yields tested support at 4.25% yesterday before rallying to 4.35%. Breakout above 4.35% would suggest a stronger move to test 4.50%.

10-Year Treasury Yield

The Dollar index surged in response and is likely to test resistance at 103.

Dollar Index

Gold weakened slightly, to $2040 per ounce.

Spot Gold

Long-term View

Jim Bianco thinks we are headed for 5.5% yield on 10-Year Treasuries by mid-2024. He says that the 10-year yield should match nominal GDP growth:

  • No recession next year
  • Inflation bottoms around 3%
  • Real growth of 2% to 3%
  • That gives nominal growth of 5.0% to 6.0%.

Growth

Nominal GDP growth ticked up to 6.3% for the 12 months to September, but the long-term trend is downward.

Nominal GDP Growth

Growth in Aggregate weekly hours worked declined to 1.1% for the 12 months to October — a good indicator of real growth.

Estimated Aggregate Non-Farm Weekly Hours Worked

Continued unemployment claims are climbing, suggesting that (real) growth will slow further in the months ahead.

Continued Claims

Inflation

The other component of nominal GDP growth is inflation, where five-year consumer expectations (from the University of Michigan survey) have climbed to above 3.0%.

University of Michigan Inflation Expectations 5-Year

However, core PCE inflation (orange) and trimmed mean PCE (red) are both trending lower.

Core PCE & Trimmed Mean PCE Inflation

Services PCE inflation (brown below) is also trending lower but likely to prove more difficult to subdue.

PCE Services Inflation

Real Interest Rate

Jim Bianco suggests that nominal GDP growth will fall to between 5.0% and 6.0% in 2024 — a good approximate of return on new investment  — while the 10-year yield will rise to a similar level. This represents a neutral rate of interest  that is unlikely to fuel further inflation.

10-Year Treasury Yield & Nominal GDP Growth

Inflation builds when the 10-year yield exceeds GDP growth by a wide margin. The long-term chart below shows how PCE inflation (red) climbs when 10-year Treasury yields minus GDP growth (purple) fall near -5.0%. Inflation also falls sharply when the purple line rises above 5.0%, normally during a recession when GDP growth is negative.

10-Year Treasury Yield minus Nominal GDP Growth & PCE Inflation

Conclusion

Jim Bianco’s premise of 10-year yields at 5.5% is based on the expectation that the Fed will maintain neutral real interest rates in order to tame inflation. Whether the Fed will be able to achieve this is questionable.

Japan and China have stopped investing in Treasuries, commercial banks are net sellers, and the private sector does not have the capacity to absorb growing Treasury issuance to fund federal deficits. That leaves the Fed as buyer of last resort.

The Fed may be forced to intervene in the Treasury market, keeping a lid on long-term yields while expanding the money supply. The likely result will be higher inflation and a weaker Dollar, both of which are bullish for Gold.

Acknowledgements

  • CNBC/Jim Bianco: 10-Year Treasury yield to rebound to 5.5%

Michael Howell | Why Monetary Inflation will Drive Gold Higher

In this interview, Michael Howell from Cross Border Capital suggests that the Fed will be forced to step in to fund US federal government deficits.

Deficits will rise for two reasons:

  1. An ageing population means greater spending on Medicare, Medicaid and social security.
  2. Defense spending rising to 5.0% of GDP.

Japan and China are no longer buying Treasuries and the private sector doesn’t have the capacity. The Fed will have to step in.

In Howell’s words: “THERE IS NO OTHER WAY OUT”.

Conclusion

Gold is a great hedge against expected monetary inflation.

S&P 500 rallies while consumer sentiment falls

The University of Michigan Index of Consumer Sentiment declined to 61.3 for November. Levels below 70 in the past have signaled a recession.

University of Michigan Consumer Sentiment

Consumer sentiment is in sharp contrast to robust personal consumption expenditures which at 93% of disposable personal income are well above pre-pandemic levels.

Personal Consumption Expenditure/Disposable Personal Income

Mortgage rates above 7.0% failed to dampen discretionary spending, with most households having locked in low fixed mortgage rates over the pandemic.

30-Year Mortgage Rate

Home Sales

Existing home sales declined to an annual rate of 3.8 million, with households are reluctant to give up their cheap fixed-rate mortgages.

Existing Home Sales

New home sales surged as a result, boosting residential construction.

New One-Unit Home Sales

Inflation Expectations

The University of Michigan November survey shows 1-year inflation expectations increased to 4.50%.

University of Michigan Inflation Expectations 1-Year

Five-year expectations increased to 3.2%, with the 3-month moving average of 3.0% well above the Fed’s 2.0% target.

University of Michigan Inflation Expectations 5-Year

Rising inflation expectations mean that the Fed is unlikely to cut interest rates in the foreseeable future.

Interest Rates

10-Year Treasury yields continue to test support at 4.40% after Treasury weighted new issuance towards the front-end of the yield curve — largely funded by money market funds currently invested in repo. Breach of support would offer a target of 4.0% — bearish for the Dollar.

10-Year Treasury Yield

Stocks

The S&P 500 is testing its July high of 4600. Breakout is uncertain but would not signal a bull market unless confirmed by other indices.

S&P 500

The S&P 500 Equal-Weighted Index ($IQX) has recovered less than 60% of its last decline.

S&P 500 Equal-Weighted Index

The Russell 2000 Small Caps ETF (IWM) is even weaker, retracing less than 50% of its last decline, suggesting that investors have little appetite for risk.

Russell 2000 Small Caps Index iShares ETF (IWM)

Dow Jones Transportation Average has also retraced less than 50%. The Trend Index below zero continues to warn of selling pressure.

Dow Jones Transportation Average ($DJT)

Gold and the Dollar

The Dollar Index retraced to test resistance at 104. Respect is likely and breakout below 103 would offer a target of 100.

Dollar Index

The weakening Dollar is bullish for Gold which is testing resistance at $2000 per ounce. Breakout would offer a short-term target of the previous high at $2050.

Spot Gold

Commodities

Dow Jones Industrial Metals Index ($BIM) fell sharply, warning of another test of primary support at 153. Breach would warn of a global recession, especially if mirrored by a similar breach in Copper.

Dow Jones Industrial Metals Index ($BIM)

Copper is testing its descending trendline at 8300. Reversal below primary support at 7800 would warn of a global recession. China consumes about 50% of the world’s copper production, most of it used in construction. So a lot depends on China’s efforts to rescue their ailing property sector.

Copper

The downward spiral of China’s ailing property sector shows no sign of abating despite the government’s rollout of a seemingly endless series of supportive but as yet ineffective measures, with the crisis stretching for over three years…..

The market for Chinese developers’ dollar-denominated bonds has seen a meltdown over the past two years, losing 87% of its value. The rout has wiped out $135.5 billion of value from $154.9 billion of outstanding notes, according to analysis by Debtwire. (Caixin)

Brent crude is testing resistance at $83 per barrel. Respect would warn of another downward leg to $72 and strengthen a bear market warning from Copper and base metals.

Brent Crude

Conclusion

Personal consumption expenditures remain strong despite falling consumer sentiment. The S&P 500 is testing resistance at 4600 but the advance is narrow, with investors avoiding risk in the broader market.

The Dollar weakened on the back of falling long-term Treasury yields, boosting demand for Gold which is testing resistance at $2000 per ounce. Breakout would offer a short-term target of $2050.

Copper and base metals are expected to again test primary support as doubts remain over China’s ailing property sector. Breach of support would warn of a global recession.

Inflation expectations remain persistent, with five-year expectations at 3.0% in the November University of Michigan consumer survey, well above the Fed’s target of 2.0%. The likelihood of rate cuts in early 2024 is remote unless a major collapse in financial markets forces the Fed’s hand.

Acknowledgements

Macrobusiness: China’s property black hole sucks in the CCP.

Moody’s negative outlook and falling consumer sentiment

Ten-year Treasury yields continue to respect support at 4.50%. We expect another test of resistance at 5.0%.

10-Year Treasury Yield

Moody’s kept their AAA rating for the US government but changed their outlook from stable to negative. The reasons cited  — large deficits and a polarized ineffective Congress — are strong arguments for higher Treasury yields:

Moody's Rating

Japan has also broken above 150 yen to the Dollar, increasing pressure on the BoJ to relax their cap on long-term JGB yields. Any move to relax yield curve control would be likely to cause an outflow from US Treasuries and the Dollar, driving down prices.

USDJPY

Inflation

Inflation expectations are rising, with University of Michigan 1-year expectations jumping to 4.4% — and the 3-month moving average to 3.9%.

University of Michigan Inflation expectations 1-Year

Five-year expectations are also rising, reaching 3.2% in October, with the 3-month moving average at 3.0%.

University of Michigan Inflation expectations 5-Year

Higher inflation expectations add to upward pressure on long-term yields.

Financial Conditions

Financial conditions remain loose — despite the strong rise in long-term yields — with the spread between Baa corporate bonds and the equivalent Treasury yield at a low 1.84%.
Moody's Baa Corporate Bond Spreads

Economic Outlook

Low consumer sentiment, with the University of Michigan Index at 64, continues to warn of a recession.
University of Michigan Consumer Sentiment

Heavy truck sales — a reliable leading indicator — are falling steeply. A fall below 35,000 units would be cause for concern.

Heavy Truck Sales

Stocks

The S&P 500 ended the week stronger, with a bullish candle testing resistance at 4400.

S&P 500

Small caps continue to warn of weakness, however, with the Russell 2000 iShares ETF (IWM) likely to test primary support at 162. Trend Index peaks below zero warn of strong selling pressure. Small caps tend to outperform large caps by a wide margin in the first phase of a bull market — clearly not the case here.

Russell 2000 Small Caps iShares ETF (IWM)

Global Economy

Copper is retracing for another test of primary support at $7800 per metric ton. Breach would warn of a global recession.

Copper

Gold

Gold broke support at $1900 per ounce, indicating a test of $1900. Rising long-term interest rates are undermining investor demand for Gold.

Spot Gold

But Gold is supported by strong central bank purchases, led by China.

Central Bank Gold Purchases & Sales

Australia

The ASX 200 retreated below 7000 on Friday but a bullish close on the S&P 500 should see retracement to test resistance. Declining Trend index peaks, however, warn of rising selling pressure.

ASX 200

Conclusion

We expect upward pressure on long-term Treasury yields to continue, boosted by Moody’s negative outlook for the US, a weakening Japanese Yen and rising inflation expectations.

Declining heavy truck sales and weak consumer sentiment are bearish for the economy. The S&P 500 remains bullish but small caps are more bearish, warning that this is not a broad-based recovery.

Copper breach of $7800 per metric ton would warn of a global recession.

We remain overweight cash, money market funds, short-duration term deposits and financial securities (up to 12 months), defensive stocks, critical materials and gold.

Acknowledgements

Long-term outlook: How does it all end?

What economic path are the US and major allies likely to take over the next decade? Here is my take on how this is likely to pan out.

First, let’s start with a template of what a healthy, growing economy looks like.

A Virtuous Cycle

Growth is dependent on two factors:

  • Demographics — that is a growing, skilled workforce; and
  • Productivity — where output grows at a faster rate than the workforce.

Growth requires not only a growing population but a growing workforce. An ageing population or large population under the age of 25 is unlikely to contribute much to output. What is needed are people of 25 to 55 who hold down productive jobs. We also need to ensure that they have the necessary skills — productivity tends to rise with education levels. Education that is skills-based is worth a lot more than a barista with a bachelors degree.

The most important source of productivity growth, however, is investment. More specifically, private investment — government investment tends to provide a short-term boost to the economy but acts as a long-term drag on growth (Dr Lacy Hunt). Mechanization and automation increase the output per worker, boosting productivity.

The chart below shows US private domestic non-residential investment (blue) at a healthy 13.5% of GDP, while productivity (magenta), calculated as real GDP/total non-farm employees, has grown steadily since the 1950s.

Private Investment/GDP & Real GDP/Total Non-farm Payroll

Savings are needed to fund private investment. Either domestic savings or offshore borrowings. Domestic savings are better than foreign debt, especially if debt is denominated in a second currency which can cause volatile short-term capital flows. Workers tend to consume what they earn, with low rates of savings, while the wealthy tend to have far higher savings rates. High levels of inequality increases the amount of saving but depresses consumption. Low consumption leads to fewer investment opportunities, so it is important to get the balance right. Forcing workers to save (e.g. through compulsory superannuation) is one solution.

Low deficits are essential to ensure that government borrowing does not crowd out private investment. Government investment — as we mentioned earlier — is no substitute for private investment as it leads to low productivity and low growth.

Monetary policy is often used to prime the pump — stimulating consumption and investment through low interest rates. But cheap debt has short-term benefits and long-term costs that are often not carefully considered. First, low interest rates discourage private savings which are the lifeblood of a healthy economy. Second, low interest rates are effected by the Fed (or central bank) growing the supply of money at a faster rate than output (GDP). But that causes inflation after a lag of one to two years, forcing the Fed to contract the supply of money and destabilize growth. Third, cheap debt and high inflation (with negative real interest rates) encourage malinvestment in speculative assets that are expected to grow in price without necessarily growing output. The net result is that productive investment is crowded out by both malinvestment (speculation) and government deficits, harming long-term growth.

There is also a fourth, far more insidious factor, that operates with much greater lags. Home prices tend to grow at a much faster rate than incomes during times of low interest rates, reducing access to homes by younger workers entering the workforce. New household formation slows and so does the birth rate, undermining long-term demographics. This can be remedied to some extent by skilled immigration but often migrants are unskilled and face both language and cultural challenges that lead to poor assimilation and a two-tier economy.

In summary, what is needed is a growing, skilled workforce with rising productivity from healthy private investment. Private investment requires stable growth — to facilitate reliable projections rather than unstable boom-bust cycles — and sufficient funding from private saving. Government deficits need to be kept low and real interest rates reasonably high (say 3%) to ensure low inflation and encourage efficient allocation of capital (to productive private investment).

In the Wilderness

We are a long way from the above ideal.

The chart below shows the decline in 10-year average real GDP growth, since 1960, and rising debt relative to nominal GDP.

Total Debt/GDP & Real GDP Growth

Growth is slowing due to poor demographics, rising government deficits, and malinvestment from negative real interest rates. Geopolitical tensions and the need to secure supply chains and sources of energy mean that government spending is likely to exceed tax revenues by a wide margin for the foreseeable future.

Ballooning government debt is likely to crowd out private investment, ensuring low future growth. The chart below shows CBO projections of debt-to-GDP for the next thirty years.

CBO Projection of Debt/GDP

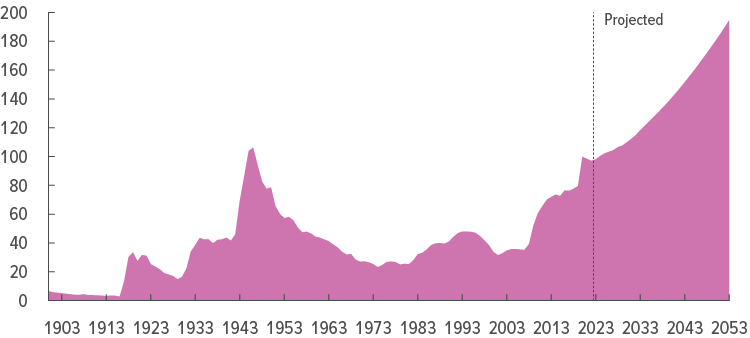
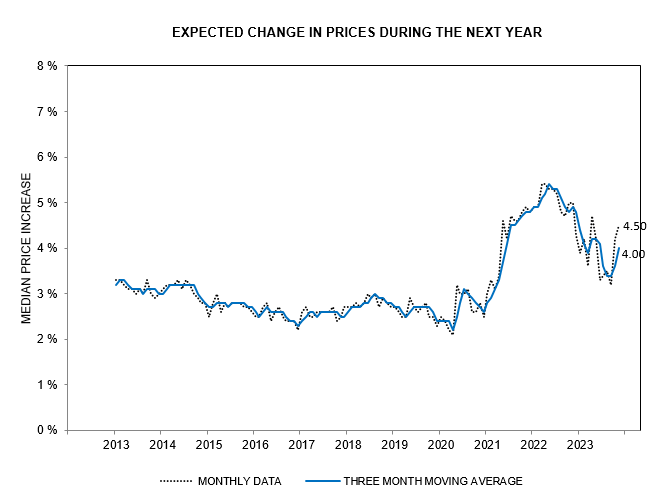
The Fed will likely have no choice but to suppress long-term interest rates in order to assist government in servicing the massive interest burden on its debt. That is likely to lead to high inflation, negative real interest rates, malinvestment in speculative assets, low growth, and rising instability (Hyman Minsky).

Conclusion

We are likely to face a decade of stagflation, with low growth, high inflation and unstable financial markets.

Hopefully, inflation will boost nominal GDP relative to government debt, increasing serviceability, over time. That would provide an opportunity to reduce fiscal deficits and establish healthy monetary policy.

In the meantime, don’t fight the Fed. When interest rates are low and inflation is high, invest in real assets. Look for value — with stable income streams which can withstand tempestuous cycles — rather than speculative growth.

Acknowledgements

Professor Percy Allan, University of Technology Sydney: Looking Beyond 2024

Dr Lacy Hunt: The impending recession

Not the best interviewer but you always get your money’s worth from Dr Lacy Hunt, former chief economist at the Dallas Fed.

The highlights:

  • Dr Hunt warns of a hard landing.
  • Recent GDP gains are led by consumer spending (+4%) but real disposable income declined (-1%). Personal saving depressed at 3.4%, compared to the GFC low of 2.4%.
  • UOM consumer sentiment is below level of previous recessions.
  • A sharp surge in the economy often occurs just before recession.
  • Dollar is too strong for global stability. It will fall as US goes into recession but then stabilize as the impact flows through to rest of the world.
  • Three signs of weakness:
    • Negative net national saving has never occurred before in a period where GDP is rising (economy is weaker than we think).
    • Bank credit is already contracting. This normally only occurs when the economy is already in recession.
    • Inflation is likewise falling before the recession.

Debt reduction, buybacks and S&P 500 P/E multiples

There is a rising trend — especially in the telecommunications, utilities, and REITs sectors — of selling off non-core assets and using the proceeds to reduce debt. Rising long-term interest rates are likely to accelerate this trend.

Debt reduction reduces funds available for stock buybacks. This chart from S&P Dow Jones Indices shows buybacks on the S&P 500 have been declining since Q2 of last year.

S&P 500 Buybacks

Without buybacks, S&P 500 earnings growth is expected to follow declining year-on-year sales growth, removing the justification for high earnings multiples.

S&P 500 Sales Growth

Price-earnings multiple for the S&P 500 is expected to decline towards its 50-year average of 16.4.

S&P 500 Price/Highest Trailing Earnings

Conclusion

Debt reduction is likely to accelerate the decline of stock buybacks, eroding support for elevated price-earnings multiples.

Declining sales growth is likely to reduce earnings growth and further erode the justification for high earnings multiples.

The price-earnings multiple for the S&P 500 is expected to decline towards its 50-year average of 16.4 (based on highest trailing earnings).

Acknowledgements